Market Wrap: Stocks, Bonds, Commodities
US stocks closed sharply higher on Friday, ending several days of sell-offs with a rebound fueled by upbeat earnings, strong economic data and easing fears of a larger-than-expected interest rate hike by the Federal Reserve.
The Dow Jones Industrial Average rose 658.09 points to 31,288.26, the S&P 500 gain 72.78 points to 3,863.16 and the Nasdaq Composite add 201.24 points to 11,452.42.
MSCI’s index of Asia-Pacific stocks outside Japan is ascend 1.75% to 639.81 levels. Australian index higher 1.23% to 6,687.10. Japanese Nikkei Index ascend 0.54% to 26,788.47.
European stocks were positive on Monday, with the Stoxx Europe 50 Index rose 1.38% to 3,525.25, Germany’s DAX advance 1.31% to 13,036.42, and France’s CAC ascend 1.29% to 6,113.74, and U.K.’s FTSE 100 surge 1.56% to 7,270.10.
Benchmark 10-year U.S. Treasury fell as demand for safe assets ascend again, today 10-year bond yields a positive 0.25% to 2.9370.
Oil prices extended gains on Monday, propped up by a weaker dollar and tight supplies that offset concerns about recession and the prospect of widespread COVID-19 lockdowns in China again reducing fuel demand.
Spot Brent crude oil add 2.26% to $103.46 per barrel. US West Texas Intermediate crude is up 2.15% to $96.60 a barrel.
The yellow metal gold is advance 0.83% to 1,717.45 dollars per ounce.
Market Wrap: Forex
The U.S. dollar edged lower in early European trade Monday, nudging down from multi-year highs, while the euro climbed away from parity ahead of the week’s European Central Bank meeting.
Today, the U.S. dollar index measures the Greenback against a trade-weighted basket of six major currencies, which is fell 0.54% to 107.323.
The Euro US Dollar (EUR/USD) is a widely traded pair that is up 0.50% today. This left the pair trading around $1.01350.
The Japanese yen was positive against the U.S. dollar on Monday as the stock up. Today USD/JPY is drop 0.41% to 137.960 level.
Another commodity-related currency positive against the U.S dollar, AUD/USD gain 0.57% to 0.68320, and NZD/USD up 0.32 to 0.61780 level.
EUR/USD Intraday: Trend on the upside
Our pivot point is at 1.01210
Preferable Price Action: Take buy positions above pivot level with targets at 1.02300 & 1.02940 in extension.
Alternative Price Action: Below pivot looks for a further downside to 1.00290 & 0.99660.
Comment: RSI above 50 levels and Pair above its 20MA & 55MA.
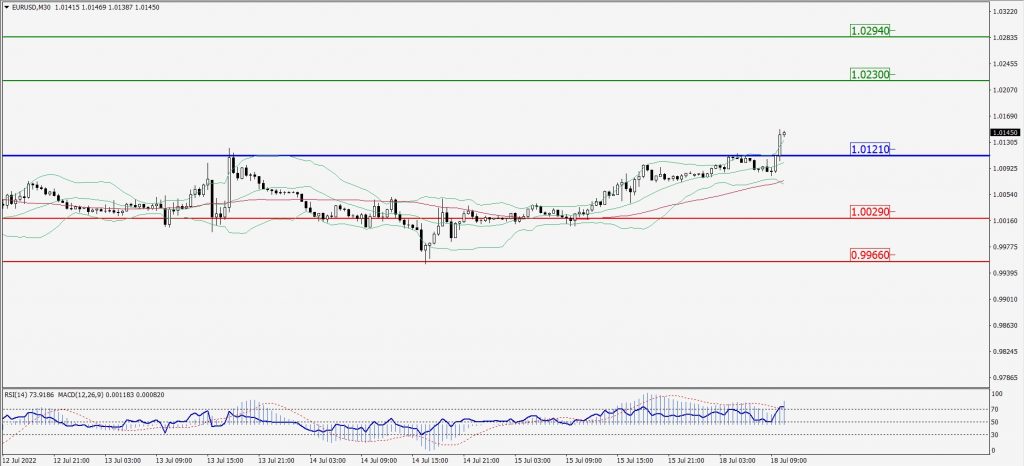
Green Lines Indicate Resistance Levels – Red Lines Indicate Support Levels
Light Blue is a Pivot Point – Black represents the price when the report was produced
GBP/USD Intraday: Trend on the upside
Our pivot point is at 1.19200
Preferable Price Action: Buy positions above pivot with targets at 1.19910 & 1.20350 in extension.
Alternative Price Action: The price below pivot would call for further downside to 1.18600 & 1.18210.
Comment: RSI above 50 levels and pair above its 20MA & 55MA.
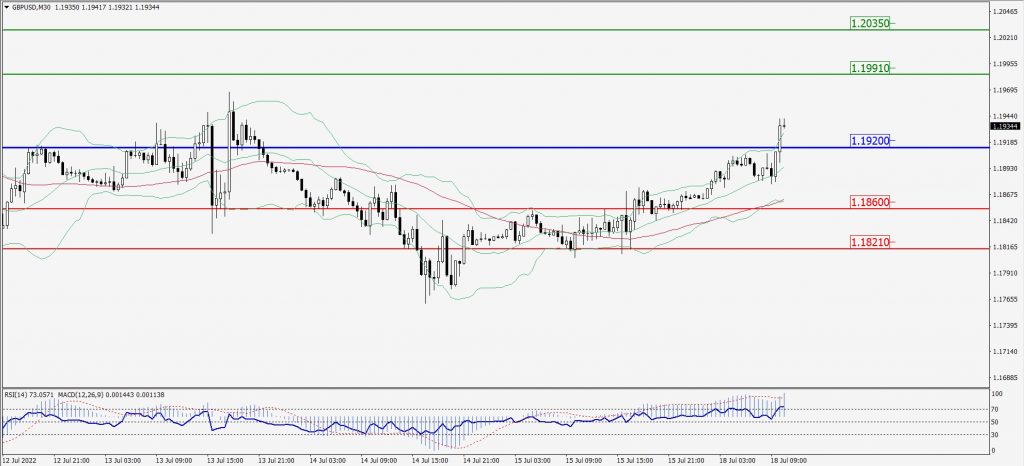
Green Lines Indicate Resistance Levels – Red Lines Indicate Support Levels
Light Blue is a Pivot Point – Black represents the price when the report was produced
USD/JPY Intraday: Trend on the downside
Our pivot point is at 138.460
Preferable Price Action: Sell position below pivot with the target at 137.500 and 136.900 in extension.
Alternative Price Action: The upside breakout of the pivot would call for 139.340 and 140.000.
Comment: MACD is negative territory and Pair below its 20MA & 55MA.
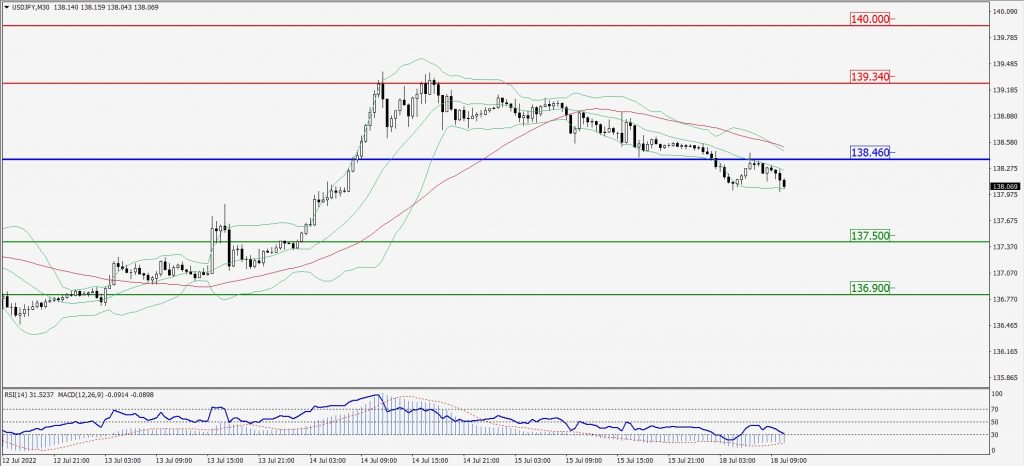
Green Lines Indicate Resistance Levels – Red Lines Indicate Support Levels
Light Blue is a Pivot Point – Black represents the price when the report was produced
AUD/USD Intraday: Support level at 0.68140
Our pivot point is at 0.68140
Preferable Price Action: Buy Positions above pivot with targets at 0.69000 & 0.69670 in extension.
Alternative Price Action: Below pivot looks for a further downside with 0.67460 & 0.66940 as targets.
Comment: RSI above 50 levels and Pairs above ita 20MA & 55MA.
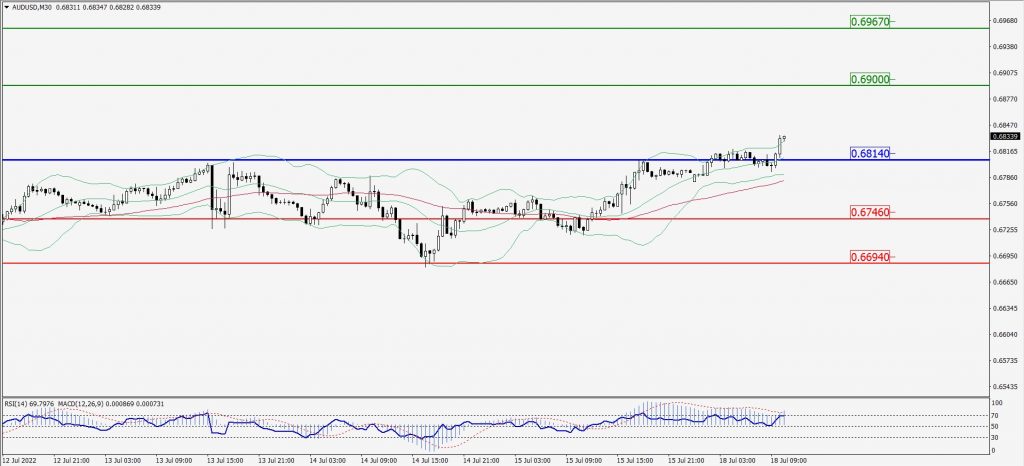
Green Lines Indicate Resistance Levels – Red Lines Indicate Support Levels
Light Blue is a Pivot Point – Black represents the price when the report was produced
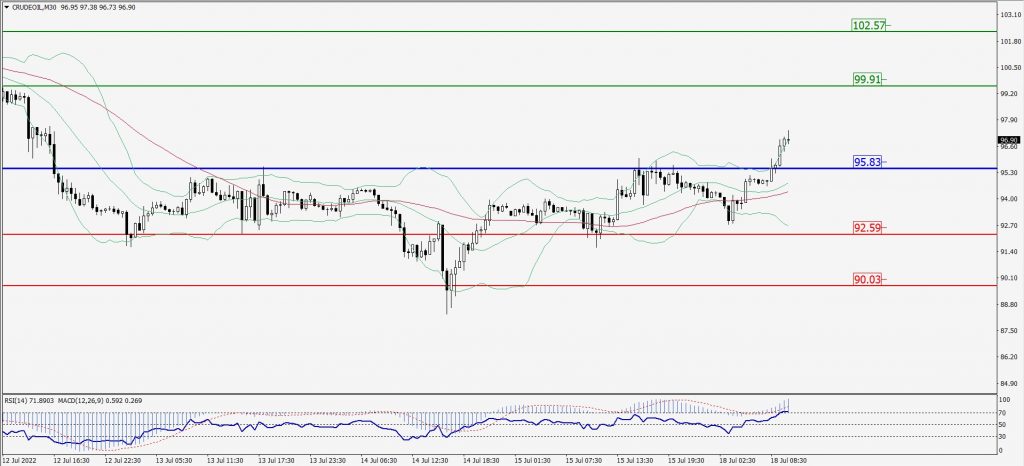
CRUDEOIL Intraday: Trend on the upside
Our pivot point is at 95.83
Preferable Price Action: Above pivots buy oil with 99.91 & 102.57 as targets.
Alternative Price Action: Sell crude below pivot with targets at 92.59 and 90.03 in extension.
Comment: MACD is in the positive territory and Pairs above its 20MA & 55MA.
Green Lines Indicate Resistance Levels – Red Lines Indicate Support Levels
Light Blue is a Pivot Point – Black represents the price when the report was produced
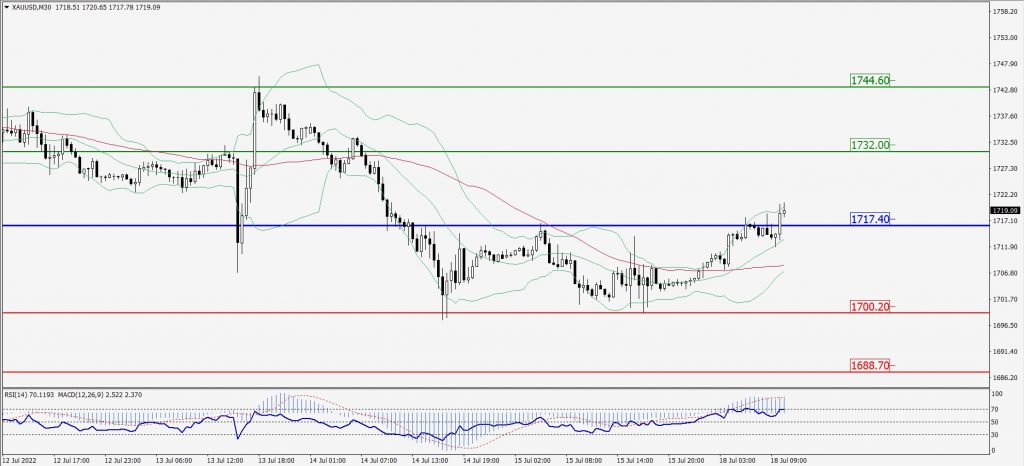
XAU/USD Intraday: Resistance level at 1717.40
Our pivot point is 1717.40
Preferable Price Action: Further upside to 1732.00 and 1744.60
Alternative Price Action: If the price gives a downside breakout of a pivot, then the price extends to 1700.20 and 1688.70.
Comment: MACD is positive territory and Pairs above its 20MA & 55MA.
Green Lines Indicate Resistance Levels – Red Lines Indicate Support Levels
Light Blue is a Pivot Point – Black represents the price when the report was produced
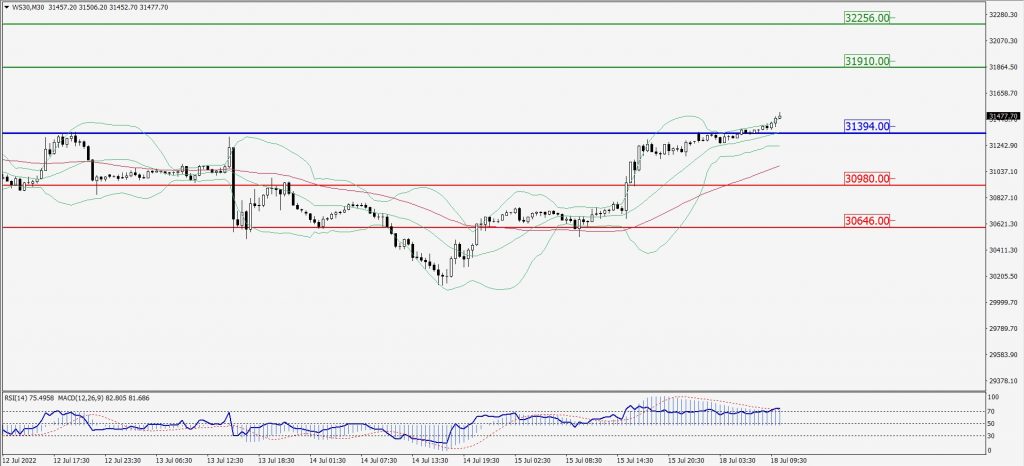
Dow Jones Intraday: Major trend on the upside
Our pivot point is 31,394.00
Preferable Price Action: Take buy positions above pivot with targets at 31,910.00 & 32,256.00.
Alternative Price Action: Below 31,394.00 looks for further downside to 30,980.00 & 30,646.00.
Comment: RSI above 50 levels and Pair above its 20MA & 55MA.
Green Lines Indicate Resistance Levels – Red Lines Indicate Support Levels
Light Blue is a Pivot Point – Black represents the price when the report was produced