Market Wrap: Stocks, Bonds, Commodities
World equities wavered on Wednesday as investors digested a report showing US annual consumer prices jumped 9.1 percent in June – the largest increase in more than four decades – leaving Americans to dig deeper to pay for gasoline, food, healthcare and rent.
The Dow Jones Industrial Average fell 208.54 points to 30,772.79, the S&P 500 lose 17.02 points to 3,801.78 and the Nasdaq Composite subtract 17.15 points to 11,247.58.
MSCI’s index of Asia-Pacific stocks outside Japan is drop 0.14% to 633.93 levels. Australian index higher 0.44% to 6,650.60. Japanese Nikkei Index ascend 0.62% to 26,643.39.
European stocks were negative on Thursday, with the Stoxx Europe 50 Index fell 0.41% to 3,438.75, Germany’s DAX decline 0.16% to 12,736.26, and France’s CAC drop 0.55% to 5,967.15, and U.K.’s FTSE 100 slipped 0.40% to 7,128.54.
Benchmark 10-year U.S. Treasury fell as demand for safe assets ascend again, today 10-year bond yields a positive 2.60% to 2.9820.
Oil prices ticked down on Thursday as investors doubled down on the possibility of a rate hike by the U.S. Federal Reserve that would stem inflation and curb oil demand.
Spot Brent crude oil subtract 1.12% to $98.45 per barrel. US West Texas Intermediate crude is down 1.40% to $94.92 a barrel.
The yellow metal gold is decline 1.20% to 1,714.65 dollars per ounce.
Market Wrap: Forex
The U.S. dollar surged higher in early European trade Thursday, continuing its seemingly relentless march higher on the back of expectations of further hefty rate hikes by the Federal Reserve after the release of the latest red-hot inflation data.
Today, the U.S. dollar index measures the Greenback against a trade-weighted basket of six major currencies, which is rose 0.58% to 108.388.
The Euro US Dollar (EUR/USD) is a widely traded pair that is down 0.35% today. This left the pair trading around $1.00230.
The Japanese yen was positive against the U.S. dollar on Thursday as the stock up. Today USD/JPY is ascend 1.34% to 139.250 level.
Another commodity-related currency negative against the U.S dollar, AUD/USD lose 0.16% to 0.67480, and NZD/USD down 0.46 to 0.61020 level.
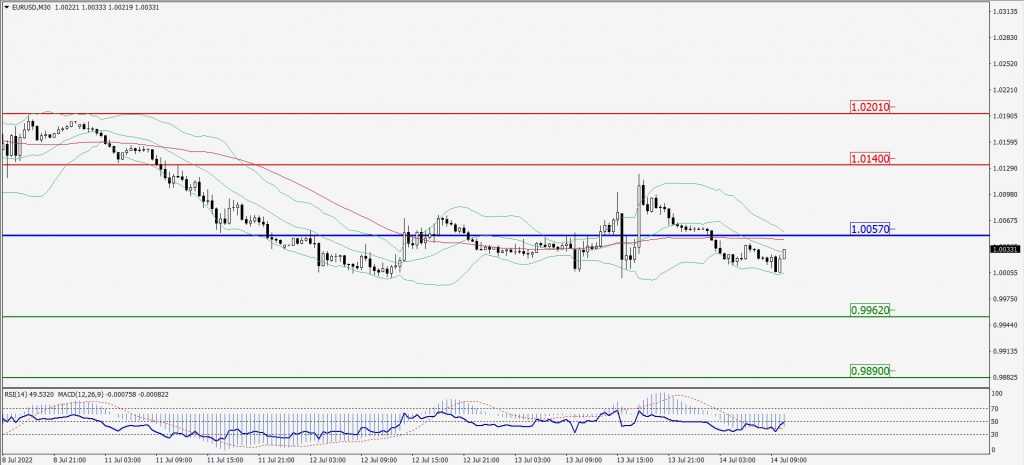
EUR/USD Intraday: In a consolidation zone
Our pivot point is at 1.00570
Preferable Price Action: Take sell positions below pivot level with targets at 0.99620 & 0.98900 in extension.
Alternative Price Action: Above pivot looks for a further upside to 1.01400 & 1.02010.
Comment: RSI at 50 levels and Pair below 55MA.
Green Lines Indicate Resistance Levels – Red Lines Indicate Support Levels
Light Blue is a Pivot Point – Black represents the price when the report was produced
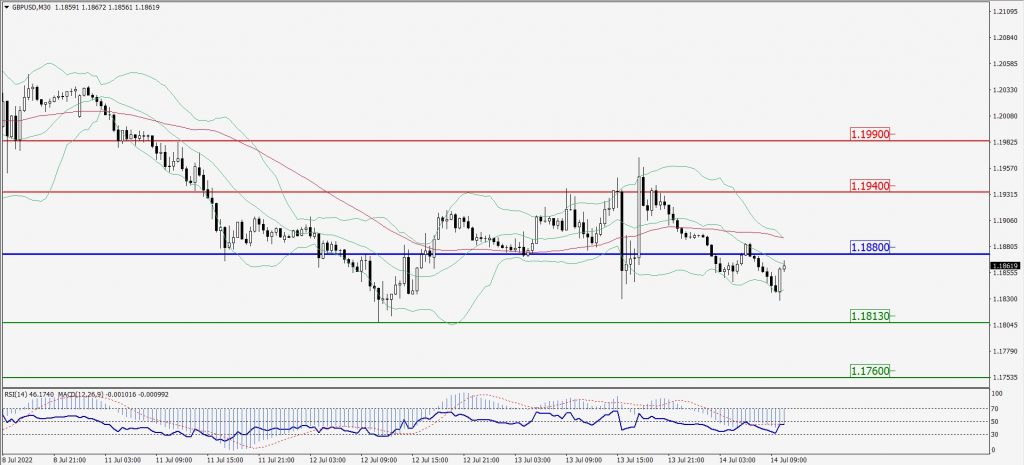
GBP/USD Intraday: Resistance level at 1.18800
Our pivot point is at 1.18800
Preferable Price Action: Sell positions below pivot with targets at 1.18130 & 1.17600 in extension.
Alternative Price Action: The price above pivot would call for further upside to 1.19400 & 1.19900.
Comment: RSI below 50 levels pair below 55MA.
Green Lines Indicate Resistance Levels – Red Lines Indicate Support Levels
Light Blue is a Pivot Point – Black represents the price when the report was produced
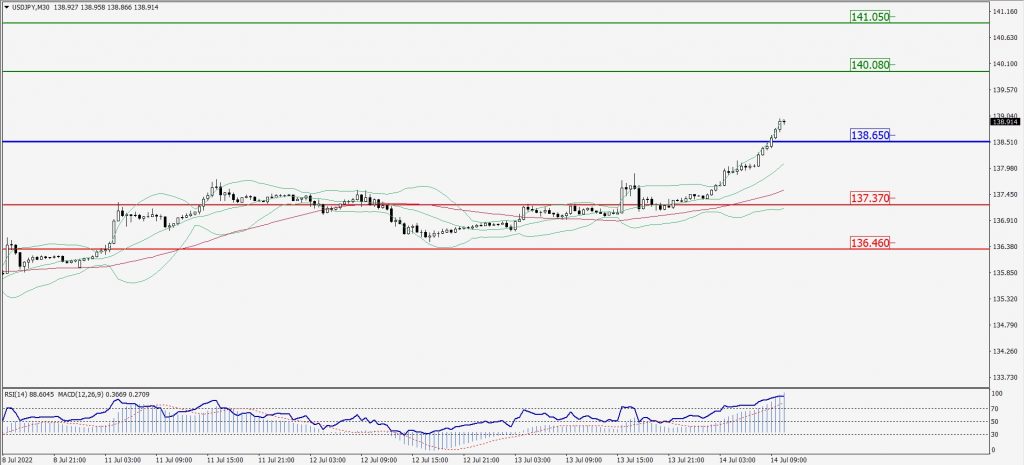
USD/JPY Intraday: Major trend on the upside
Our pivot point is at 138.650
Preferable Price Action: Buy position above pivot with the target at 140.080 and 141.050 in extension.
Alternative Price Action: The downside breakout of the pivot would call for 137.370 and 136.460.
Comment: MACD is positive territory and Pair above its 20MA & 55MA.
Green Lines Indicate Resistance Levels – Red Lines Indicate Support Levels
Light Blue is a Pivot Point – Black represents the price when the report was produced
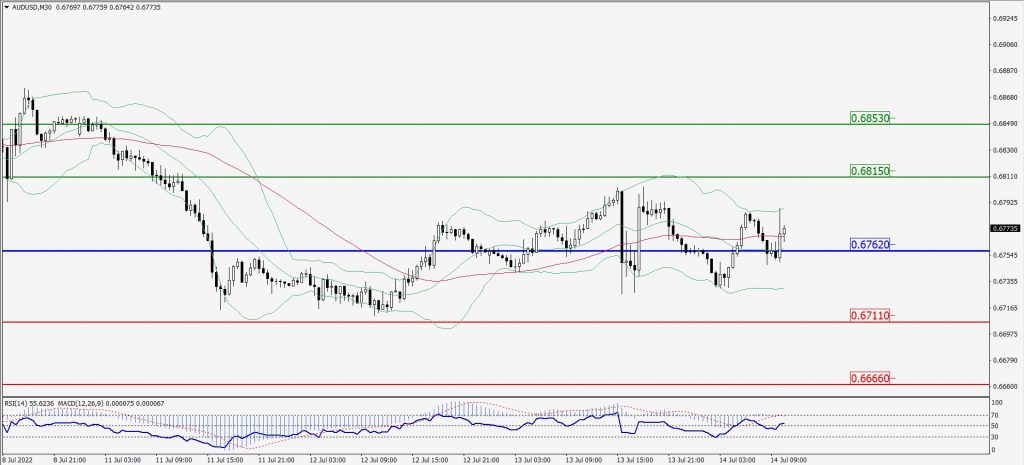
AUD/USD Intraday: Support level at 0.67620
Our pivot point is at 0.67620
Preferable Price Action: Buy Positions above pivot with targets at 0.68150 & 0.68530 in extension.
Alternative Price Action: Below pivot looks for a further downside with 0.67110 & 0.66660 as targets.
Comment: RSI above 50 levels and Pair above 20MA.
Green Lines Indicate Resistance Levels – Red Lines Indicate Support Levels
Light Blue is a Pivot Point – Black represents the price when the report was produced
CRUDEOIL Intraday: Trend on the downside
Our pivot point is at 94.19
Preferable Price Action: Below pivots sell oil with 91.15 & 89.01 as targets.
Alternative Price Action: Buy crude above pivot with targets at 97.13 and 99.22 in extension.
Comment: MACD is in the negative territory and Pair below its 20MA & 55MA.
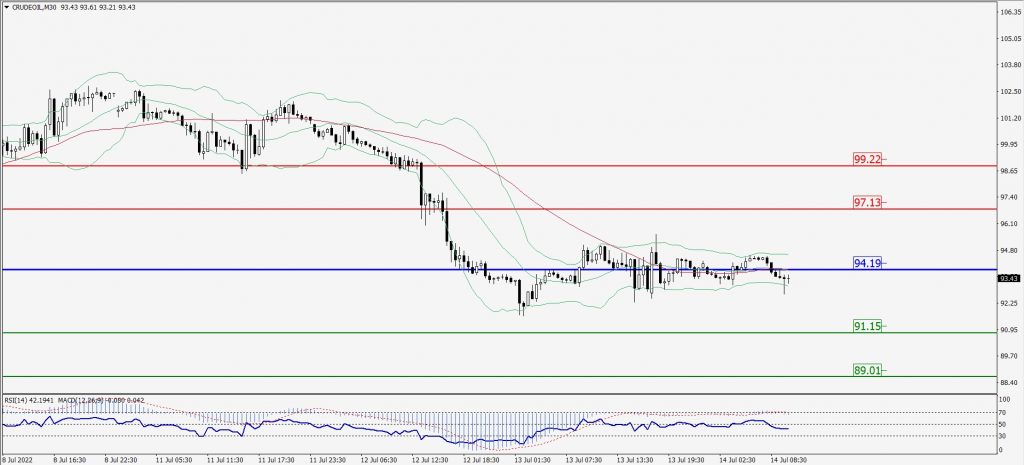
Green Lines Indicate Resistance Levels – Red Lines Indicate Support Levels
Light Blue is a Pivot Point – Black represents the price when the report was produced
XAU/USD Intraday: Trend on the downside
Our pivot point is 1725.10
Preferable Price Action: Further downside to 1708.70 and 1696.10
Alternative Price Action: If the price gives an upside breakout of a pivot, then the price extends to 1739.20 and 1750.40.
Comment: MACD is negative territory and Pairs below its 20MA & 55MA.
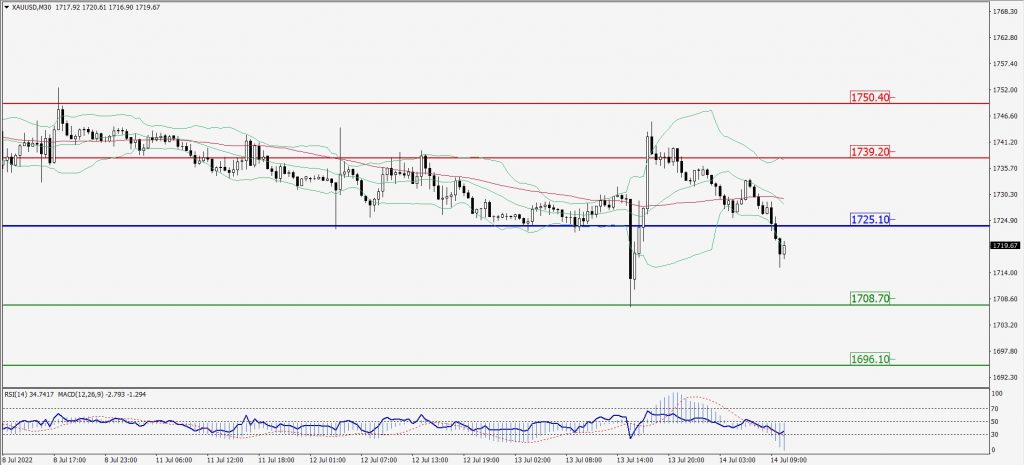
Green Lines Indicate Resistance Levels – Red Lines Indicate Support Levels
Light Blue is a Pivot Point – Black represents the price when the report was produced
Dow Jones Intraday: Trend on the downside
Our pivot point is 30,772.00
Preferable Price Action: Take sell positions below pivot with targets at 30,374.00 & 30,131.00.
Alternative Price Action: Above 30,772.00 looks for further upside to 31,086.00 & 31,354.00.
Comment: RSI below 50 levels and Pair below its 20MA & 55MA.
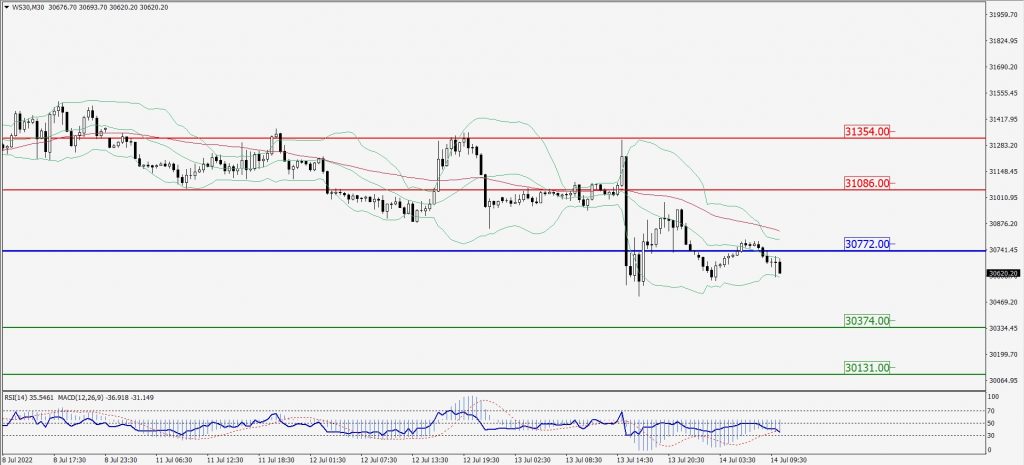
Green Lines Indicate Resistance Levels – Red Lines Indicate Support Levels
Light Blue is a Pivot Point – Black represents the price when the report was produced