Market Wrap: Stocks, Bonds, Commodities
Wall Street ticked upwards, while oil continued to slide on Wednesday as investors juggled concerns over inflation versus a recession after Federal Reserve minutes showed officials rallied around a large rate hike at their June meeting.
The Dow Jones Industrial Average rose 69.86 points to 31,037.68, the S&P 500 gain 13.69 points to 3,845.08 and the Nasdaq Composite add 39.61 points to 11,361.85.
MSCI’s index of Asia-Pacific stocks outside Japan is ascend 0.87% to 647.53 levels. Australian index higher 0.81% to 6,648.00. Japanese Nikkei Index ascend 1.47% to 26,490.53.
European stocks were positive on Thursday, with the Stoxx Europe 50 Index rose 1.77% to 3,482.55, Germany’s DAX advance 1.66% to 12,804.65, and France’s CAC gain 1.63% to 6,008.87, and U.K.’s FTSE 100 surge 1.21% to 7,189.04.
Benchmark 10-year U.S. Treasury fell as demand for safe assets ascend again, today 10-year bond yields a positive 0.90% to 2.9370.
Oil prices slipped in early Asian trade on Thursday, after hitting a nearly three-month low during the previous session, as fears of a potential global recession spurred concerns about oil demand.
Spot Brent crude oil add 0.49% to $101.20 per barrel. US West Texas Intermediate crude is up 0.40% to $98.93 a barrel.
The yellow metal gold is advance 0.40% to 1,743.55 dollars per ounce.
Market Wrap: Forex
The U.S. dollar edged lower in early European trade Thursday, handing back some of the previous session’s gains but remained near a 20-year high as the Federal Reserve retained a hawkish tone.
Today, the U.S. dollar index measures the Greenback against a trade-weighted basket of six major currencies, which is a fell 0.10% to 106.790.
The Euro US Dollar (EUR/USD) is a widely traded pair that is up 0.13% today. This left the pair trading around $1.01940.
The Japanese yen was positive against the U.S. dollar on Thursday as the stock up. Today USD/JPY is ascend 0.16% to 136.140 level.
Another commodity-related currency positive against the U.S dollar, AUD/USD gain 0.63% to 0.68180, and NZD/USD up 0.46 to 0.61750 level.
EUR/USD Intraday: Trend on the downside
Our pivot point is at 1.02350
Preferable Price Action: Take sell positions below pivot level with targets at 1.00730 & 0.99620 in extension.
Alternative Price Action: Above pivot looks for a further upside to 1.03660 & 1.04710.
Comment: RSI below 50 levels and Pair below its 20MA & 55MA.
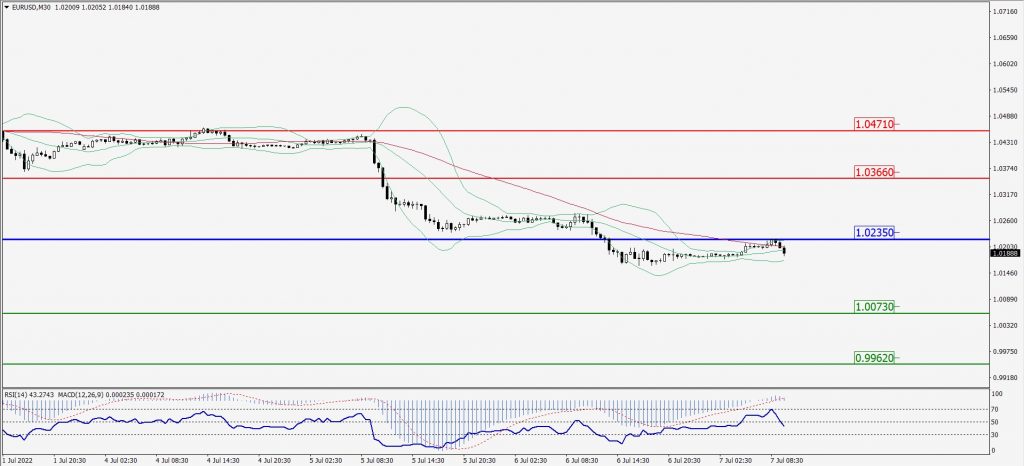
Green Lines Indicate Resistance Levels – Red Lines Indicate Support Levels
Light Blue is a Pivot Point – Black represents the price when the report was produced
GBP/USD Intraday: Major support level at 1.19350
Our pivot point is at 1.19350
Preferable Price Action: Buy positions above pivot with targets at 1.20460 & 1.21290 in extension.
Alternative Price Action: The price below pivot would call for further downside to 1.18310 & 1.17610.
Comment: RSI above 50 levels pair above its 20MA & 55MA.
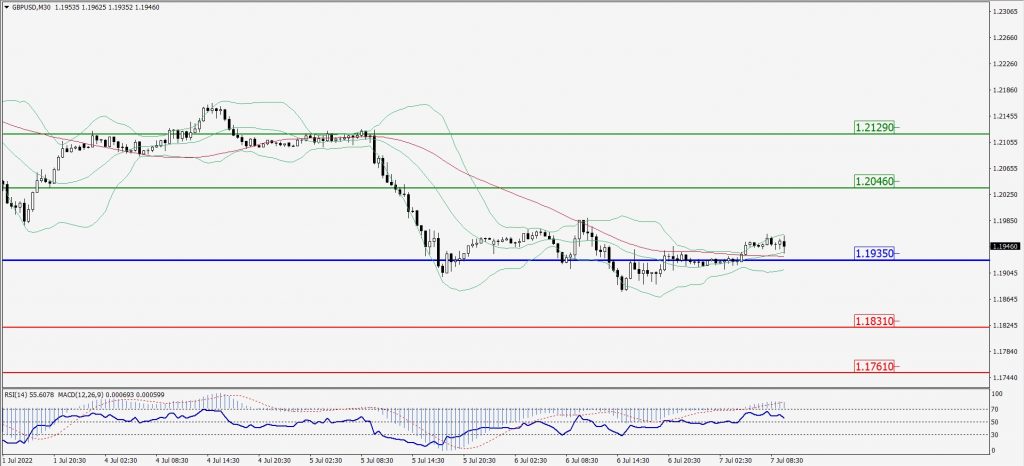
Green Lines Indicate Resistance Levels – Red Lines Indicate Support Levels
Light Blue is a Pivot Point – Black represents the price when the report was produced
USD/JPY Intraday: Support level at 135.720
Our pivot point is at 135.720
Preferable Price Action: Buy position above pivot with the target at 136.580 and 137.200 in extension.
Alternative Price Action: The downside breakout of the pivot would call for 134.850 and 134.250.
Comment: MACD is positive territory and Pair above 55MA.
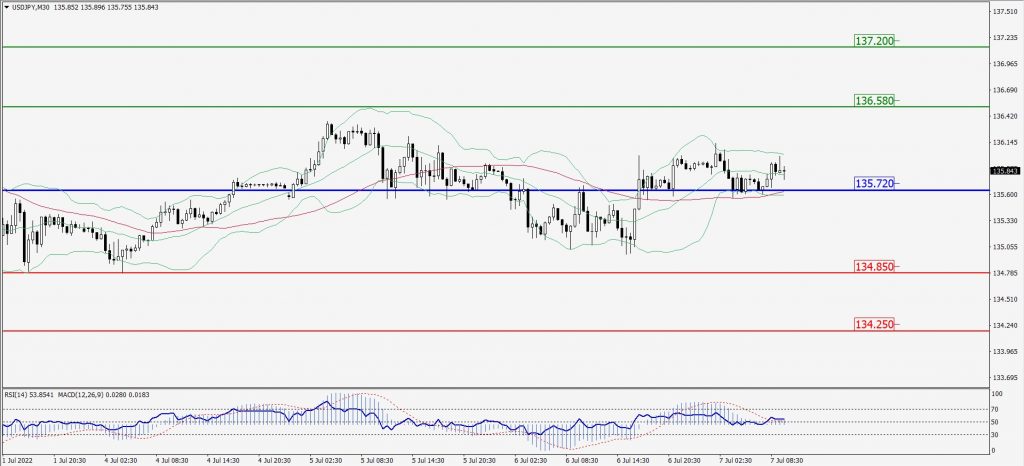
Green Lines Indicate Resistance Levels – Red Lines Indicate Support Levels
Light Blue is a Pivot Point – Black represents the price when the report was produced
AUD/USD Intraday: Trend on the upside
Our pivot point is at 0.67920
Preferable Price Action: Buy Positions above pivot with targets at 0.68740 & 0.69440 in extension.
Alternative Price Action: Below pivot looks for a further downside with 0.67130 & 0.66510 as targets.
Comment: RSI above 50 levels and Pair above its 20MA & 55MA.
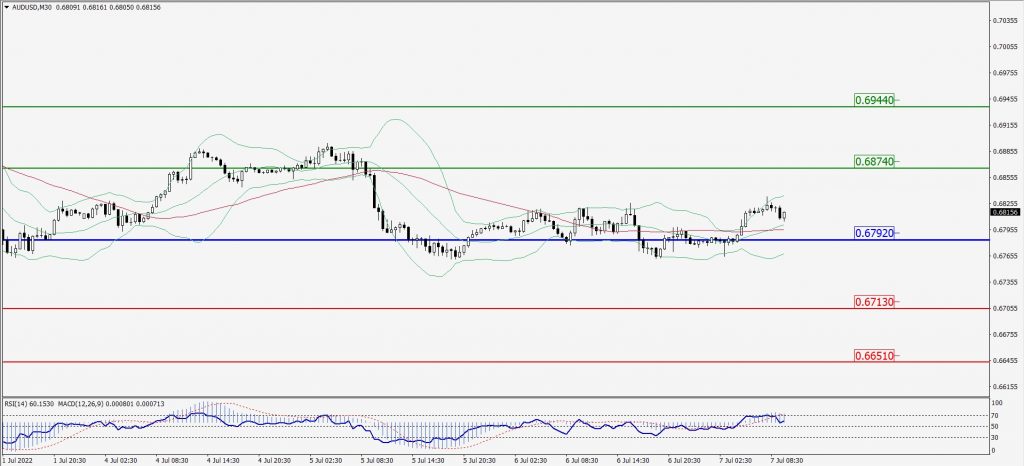
Green Lines Indicate Resistance Levels – Red Lines Indicate Support Levels
Light Blue is a Pivot Point – Black represents the price when the report was produced
CRUDEOIL Intraday: In a consolidation zone
Our pivot point is at 98.42
Preferable Price Action: Below pivots sell oil with 91.61 & 86.70 as targets.
Alternative Price Action: Buy crude above pivot with targets at 104.18 and 109.54 in extension.
Comment: MACD is in the flat territory and Pair below 55MA.
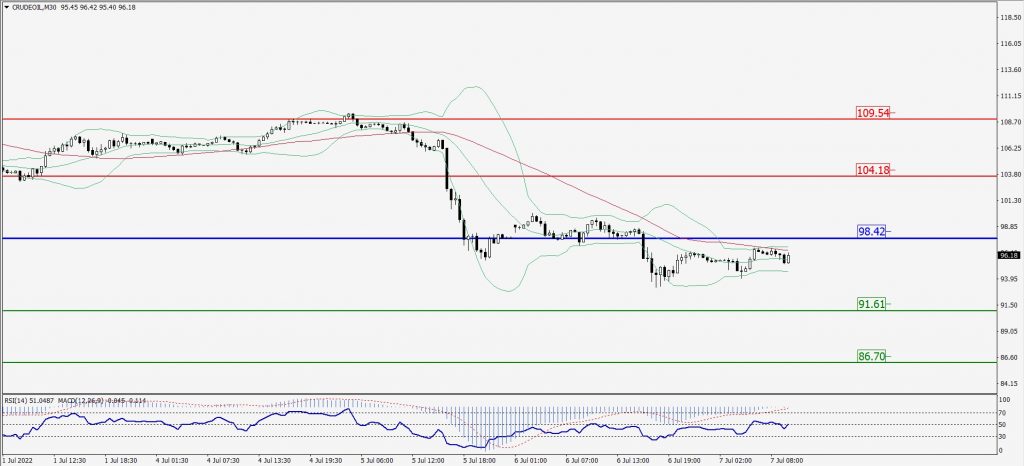
Green Lines Indicate Resistance Levels – Red Lines Indicate Support Levels
Light Blue is a Pivot Point – Black represents the price when the report was produced
XAU/USD Intraday: Trend on the downside
Our pivot point is 1753.50
Preferable Price Action: Further downside to 1715.00 and 1690.80
Alternative Price Action: If the price gives an upside breakout of a pivot, then the price extends to 1786.60 and 1814.40.
Comment: MACD is negative territory and Pair below 55MA.
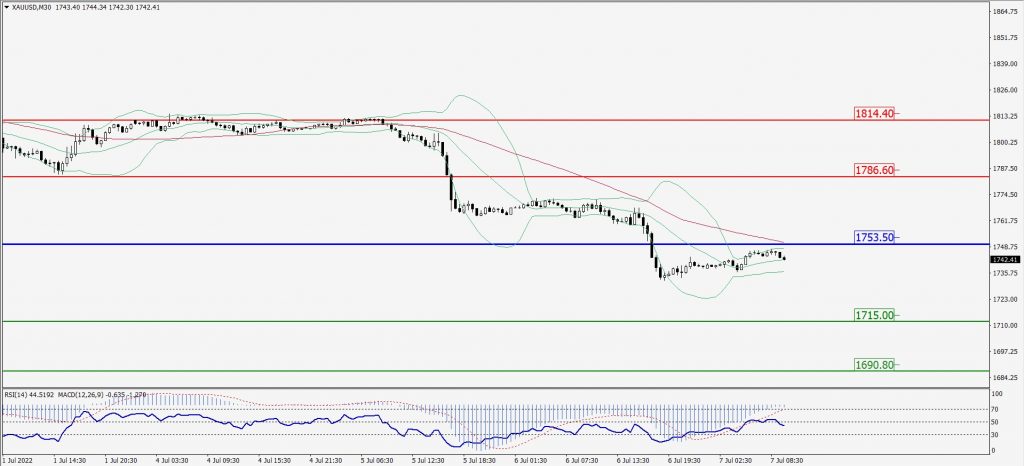
Green Lines Indicate Resistance Levels – Red Lines Indicate Support Levels
Light Blue is a Pivot Point – Black represents the price when the report was produced
Dow Jones Intraday: Trend on the upside
Our pivot point is 31,043.00
Preferable Price Action: Take buy positions above pivot with targets at 31,706.00 & 32,199.00.
Alternative Price Action: Below 31,043.00 looks for further downside to 30,524.00 & 30,114.00.
Comment: RSI above 50 levels and Pair above its 20MA & 55MA.
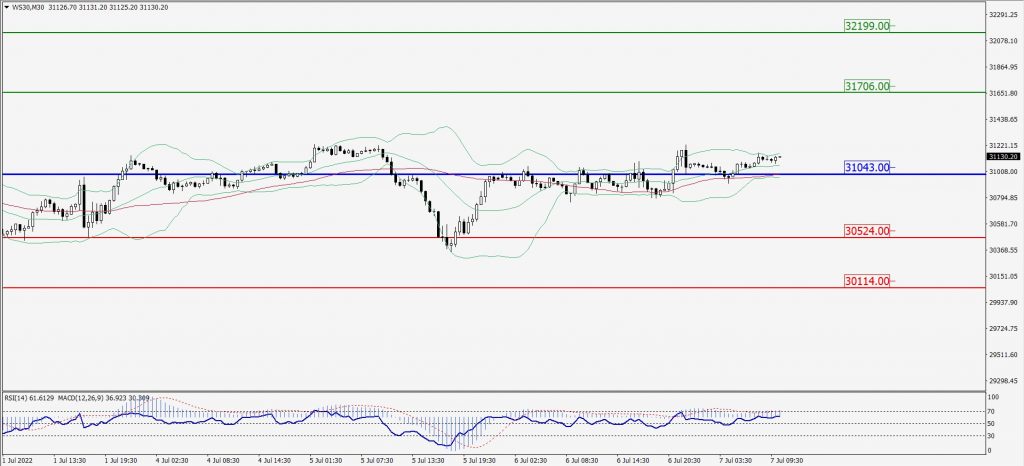
Green Lines Indicate Resistance Levels – Red Lines Indicate Support Levels
Light Blue is a Pivot Point – Black represents the price when the report was produced