Market Wrap: Stocks, Bonds, Commodities
Wall Street bounced back to a sharply higher close in light trading on Friday as investors embarked on the second half of the year ahead of the long holiday weekend.
The Dow Jones Industrial Average rose 321.83 points to 31,097.26, the S&P 500 gain 39.95 points to 3,825.33 and the Nasdaq Composite add 99.11 points to 11,127.84.
MSCI’s index of Asia-Pacific stocks outside Japan is drop 0.29% to 646.33 levels. Australian index higher 1.11% to 6,612.60. Japanese Nikkei Index ascend 0.84% to 26,153.81.
European stocks were positive on Monday, with the Stoxx Europe 50 Index rose 0.28% to 3,457.95, Germany’s DAX advance 0.18% to 12,834.47, and France’s CAC gain 0.68% to 5,971.44, and U.K.’s FTSE 100 surge 0.95% to 7,241.10.
Benchmark 10-year U.S. Treasury fell as demand for safe assets ascend again, today 10-year bond yields a negative 0.50% to 2.8890.
Oil prices reversed losses and edged up on Monday as concerns of tight supply amid lower OPEC output, unrest in Libya and sanctions on Russia outweighed fears of a global recession.
Spot Brent crude oil subtract 0.30% to $111.25 per barrel. US West Texas Intermediate crude is down 0.37% to $108.03 a barrel.
The yellow metal gold is advance 0.40% to 1,808.70 dollars per ounce.
Market Wrap: Forex
The dollar kept trade-sensitive currencies pinned near multi-year lows on Monday and the euro was under pressure as investors sought safety due to worries about slowing global growth.
Today, the U.S. dollar index measures the Greenback against a trade-weighted basket of six major currencies, which is a fell 0.04% to 104.860.
The Euro US Dollar (EUR/USD) is a widely traded pair that is down 0.02% today. This left the pair trading around $1.04250.
The Japanese yen was positive against the U.S. dollar on Monday as the stock up. Today USD/JPY is ascend 0.11% to 135.370 level.
Another commodity-related currency positive against the U.S dollar, AUD/USD gain 0.58% to 0.68530, and NZD/USD up 0.42 to 0.62320 level.
EUR/USD Intraday: Support level at 1.04280
Our pivot point is at 1.04280
Preferable Price Action: Take buy positions above pivot level with targets at 1.05000 & 1.05520 in extension.
Alternative Price Action: Below pivot looks for a further downside to 1.03650 & 1.03160.
Comment: RSI above 50 levels and Pair above 55MA.
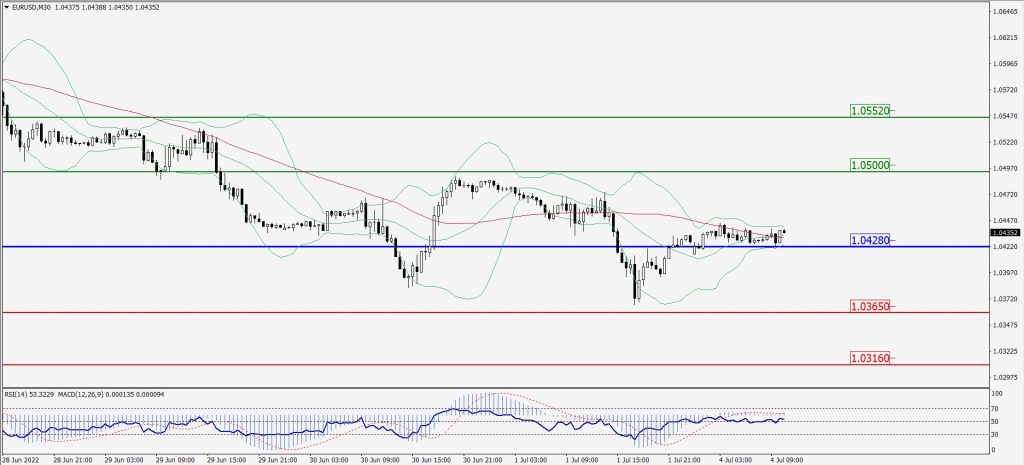
Green Lines Indicate Resistance Levels – Red Lines Indicate Support Levels
Light Blue is a Pivot Point – Black represents the price when the report was produced
GBP/USD Intraday: Trend on the upside
Our pivot point is at 1.21050
Preferable Price Action: Buy positions above pivot with targets at 1.22260 & 1.23140 in extension.
Alternative Price Action: The price below pivot would call for further downside to 1.20010 & 1.19130.
Comment: RSI above 50 levels pair above its 20MA & 55MA.
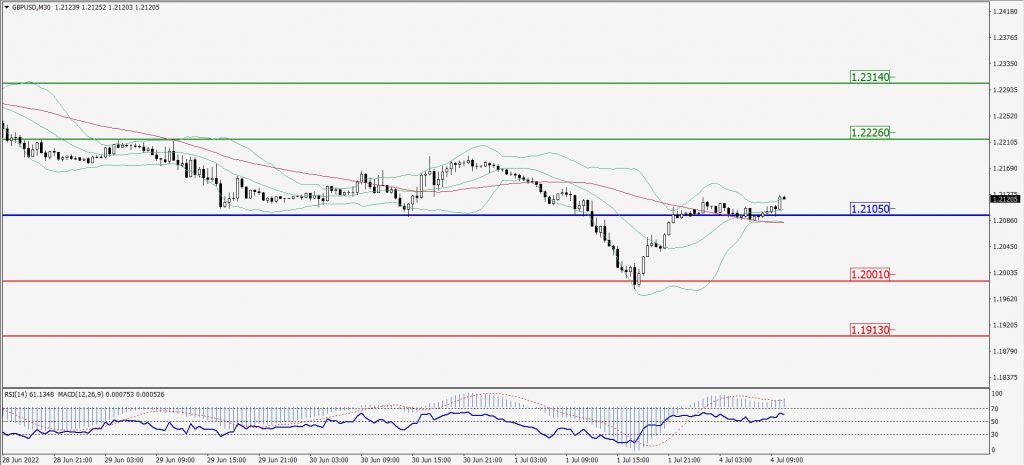
Green Lines Indicate Resistance Levels – Red Lines Indicate Support Levels
Light Blue is a Pivot Point – Black represents the price when the report was produced
USD/JPY Intraday: Trend on the upside
Our pivot point is at 135.220
Preferable Price Action: Buy position above pivot with the target at 136.460 and 137.400 in extension.
Alternative Price Action: The downside breakout of the pivot would call for 134.190 and 133.320.
Comment: MACD is positive territory and Pair above its 20MA & 55MA.
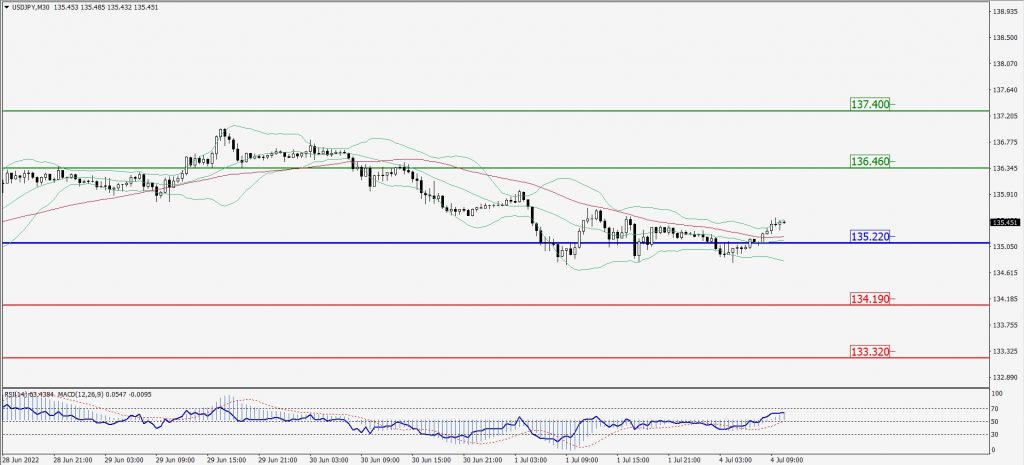
Green Lines Indicate Resistance Levels – Red Lines Indicate Support Levels
Light Blue is a Pivot Point – Black represents the price when the report was produced
AUD/USD Intraday: Major trend on the upside
Our pivot point is at 0.68320
Preferable Price Action: Buy Positions above pivot with targets at 0.69200 & 0.69820 in extension.
Alternative Price Action: Below pivot looks for a further downside with 0.67480 & 0.66890 as targets.
Comment: RSI above 50 levels and Pair above its 20MA & 55MA.
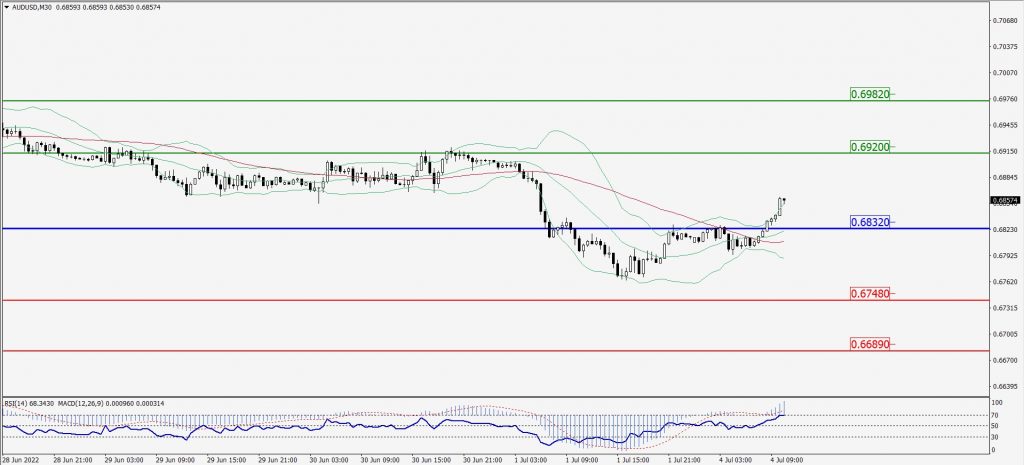
Green Lines Indicate Resistance Levels – Red Lines Indicate Support Levels
Light Blue is a Pivot Point – Black represents the price when the report was produced
CRUDEOIL Intraday: In a consolidation zone
Our pivot point is at 106.21
Preferable Price Action: Above pivots buy oil with 109.38 & 111.86 as targets.
Alternative Price Action: Sell crude below pivot with targets at 102.88 and 100.23 in extension.
Comment: MACD is in the positive territory and Pair above 55MA.
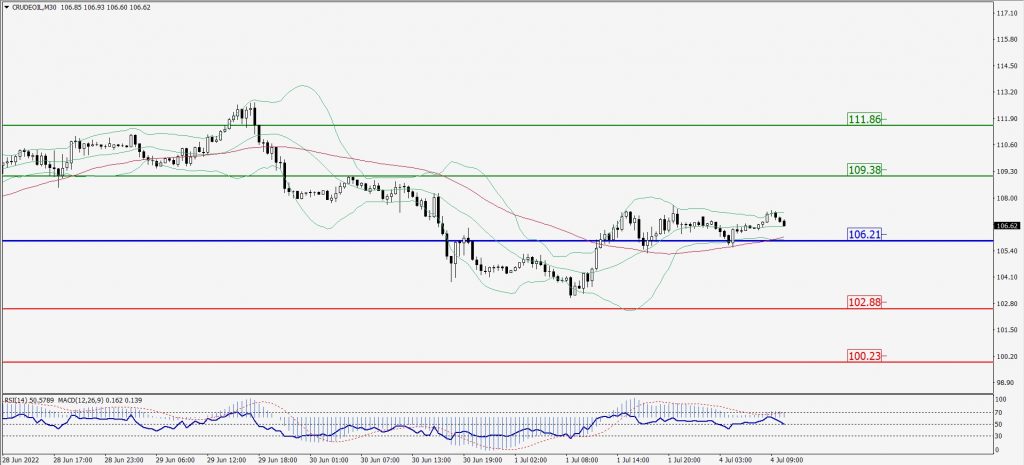
Green Lines Indicate Resistance Levels – Red Lines Indicate Support Levels
Light Blue is a Pivot Point – Black represents the price when the report was produced
XAU/USD Intraday: Resistance level at 1814.70
Our pivot point is 1814.70
Preferable Price Action: Further downside to 1790.30 and 1773.90
Alternative Price Action: If the price gives an upside breakout of a pivot, then the price extends to 1833.70 and 1847.40.
Comment: MACD is negative territory and Pair below 20MA.
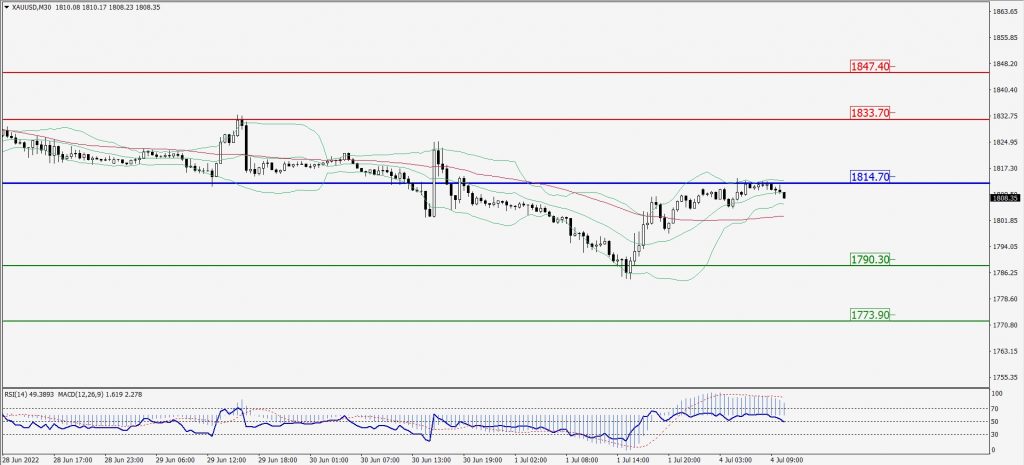
Green Lines Indicate Resistance Levels – Red Lines Indicate Support Levels
Light Blue is a Pivot Point – Black represents the price when the report was produced
Dow Jones Intraday: In a consolidation zone
Our pivot point is 30,830.00
Preferable Price Action: Take buy positions above pivot with targets at 31,481.00 & 31,982.00.
Alternative Price Action: Below 30,830.00 looks for further downside to 30,243.00 & 29,673.00.
Comment: RSI above 50 levels and Pair above 55MA.
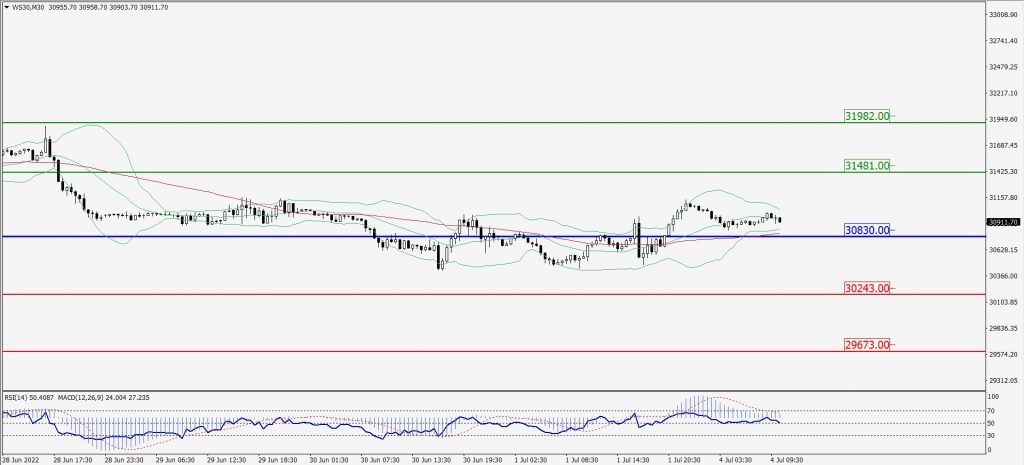
Green Lines Indicate Resistance Levels – Red Lines Indicate Support Levels
Light Blue is a Pivot Point – Black represents the price when the report was produced