Market Wrap: Stocks, Bonds, Commodities
The S&P 500 ended a seesaw session slightly down on Wednesday as investors staggered towards the finish line of a downbeat month, a dismal quarter, and the worst first-half for Wall Street’s benchmark index since US President Richard Nixon’s first term.
The Dow Jones Industrial Average rose 82.32 points to 31,029.31, the S&P 500 lose 2.72 points to 3,818.83 and the Nasdaq Composite subtract 3.65 points to 11,177.89.
MSCI’s index of Asia-Pacific stocks outside Japan is drop 0.97% to 653.72 levels. Australian index lower 1.97% to 6,568.10. Japanese Nikkei Index drop 1.54% to 26,393.04.
European stocks were negative on Thursday, with the Stoxx Europe 50 Index fell 1.77% to 3,451.95, Germany’s DAX decline 1.88% to 12,758.36, and France’s CAC lose 1.90% to 5,917.11, and U.K.’s FTSE 100 slipped 1.72% to 7,192.00.
Benchmark 10-year U.S. Treasury fell as demand for safe assets ascend again, today 10-year bond yields a negative 1.15% to 3.0570.
Oil prices were little changed on Thursday as markets weighed a rise in US gasoline and distillate inventories and worries about slower economic growth amid concerns of supply tightness.
Spot Brent crude oil add 0.41% to $112.88 per barrel. US West Texas Intermediate crude is up 0.28% to $110.12 a barrel.
The yellow metal gold is decline 0.10% to 1,815.75 dollars per ounce.
Market Wrap: Forex
The U.S. dollar stabilized in early European trade Thursday, but still lies near its two-decade peak, given safe-haven demand on renewed worries about higher rates and a global recession.
Today, the U.S. dollar index measures the Greenback against a trade-weighted basket of six major currencies, which is a fell 0.06% to 104.793.
The Euro US Dollar (EUR/USD) is a widely traded pair that is up 0.06% today. This left the pair trading around $1.04440.
The Japanese yen was positive against the U.S. dollar on Thursday as the stock up. Today USD/JPY is drop 0.27% to 136.220 level.
Another commodity-related currency positive against the U.S dollar, AUD/USD gain 0.12% to 0.68890, and NZD/USD up 0.24 to 0.62320 level.
EUR/USD Intraday: Trend on the downside
Our pivot point is at 1.04710
Preferable Price Action: Take sell positions below pivot level with targets at 1.03880 & 1.03280 in extension.
Alternative Price Action: Above pivot looks for a further upside to 1.05470 & 1.06070.
Comment: RSI below 50 levels and Pair below its 20MA & 55MA.
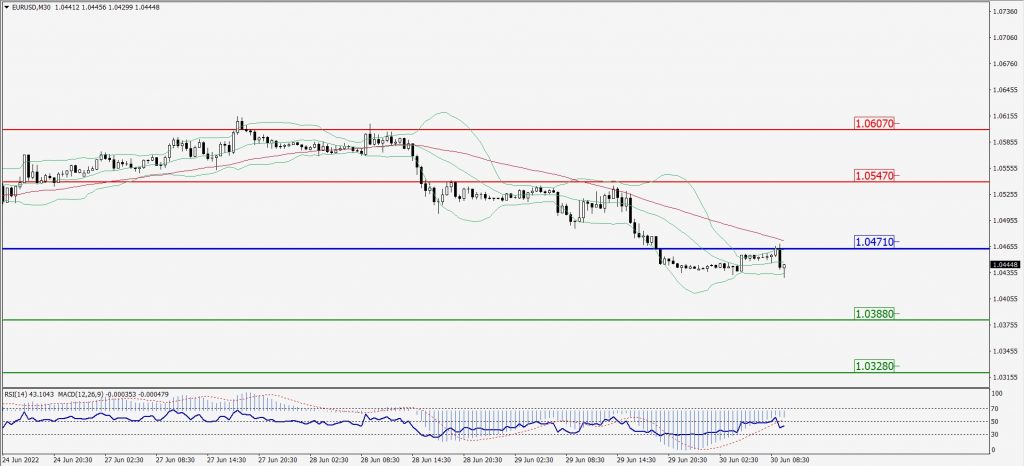
Green Lines Indicate Resistance Levels – Red Lines Indicate Support Levels
Light Blue is a Pivot Point – Black represents the price when the report was produced
GBP/USD Intraday: May trend reverse from 1.21230
Our pivot point is at 1.21230
Preferable Price Action: Buy positions above pivot with targets at 1.22060 & 1.22690 in extension.
Alternative Price Action: The price below pivot would call for further downside to 1.20420 & 1.19820.
Comment: RSI above 50 levels pair above 20MA.
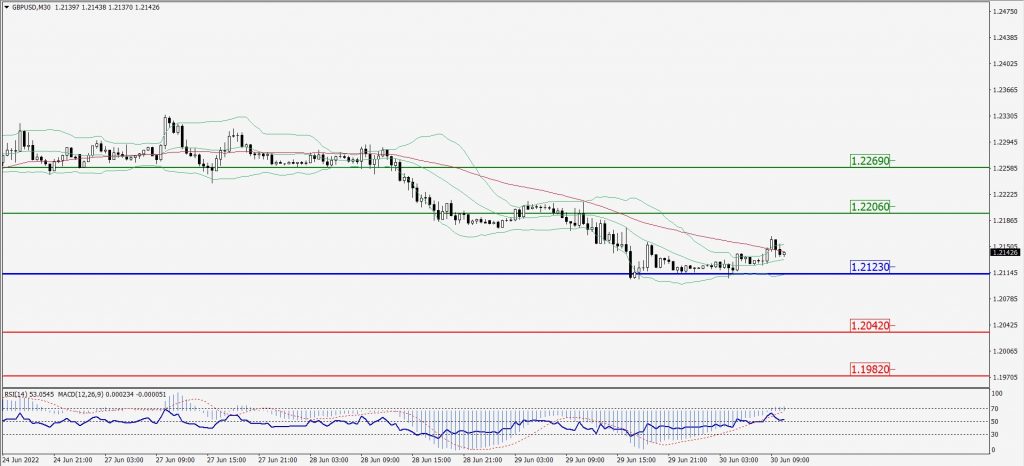
Green Lines Indicate Resistance Levels – Red Lines Indicate Support Levels
Light Blue is a Pivot Point – Black represents the price when the report was produced
USD/JPY Intraday: Trend on the downside
Our pivot point is at 136.330
Preferable Price Action: Sell position below pivot with the target at 135.280 and 134.420 in extension.
Alternative Price Action: The upside breakout of the pivot would call for 137.360 and 138.180.
Comment: MACD is negative territory and Pair below its 20MA & 55MA.
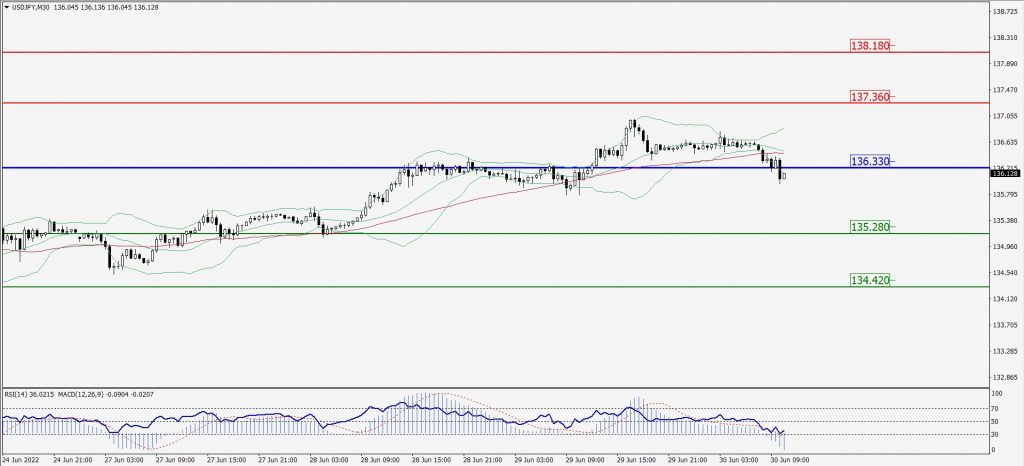
Green Lines Indicate Resistance Levels – Red Lines Indicate Support Levels
Light Blue is a Pivot Point – Black represents the price when the report was produced
AUD/USD Intraday: Support level at 0.68850
Our pivot point is at 0.68850
Preferable Price Action: Buy Positions above pivot with targets at 0.69300 & 0.69630 in extension.
Alternative Price Action: Belov pivot looks for a further downside with 0.68460 & 0.68170 as targets.
Comment: RSI at 50 levels and Pair above its 20MA & 55MA.
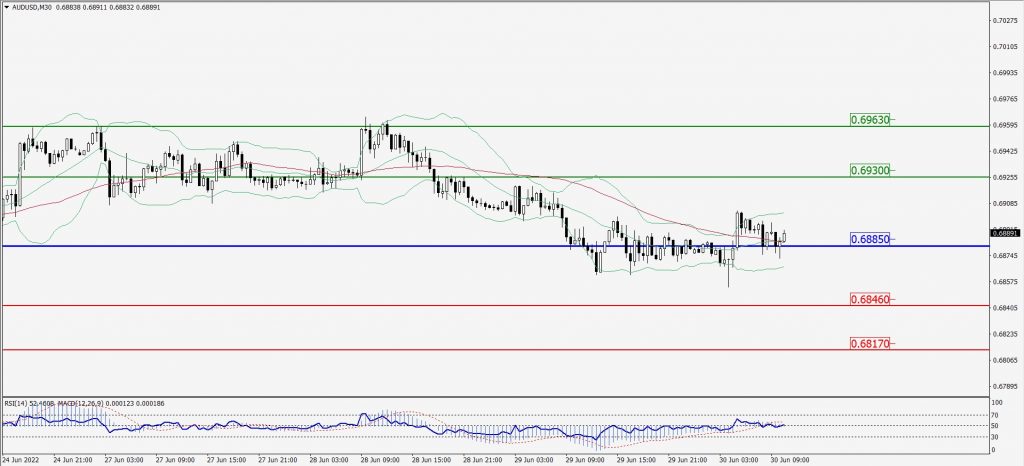
Green Lines Indicate Resistance Levels – Red Lines Indicate Support Levels
Light Blue is a Pivot Point – Black represents the price when the report was produced
CRUDEOIL Intraday: Resistance level at 109.17
Our pivot point is at 109.17
Preferable Price Action: Below pivots sell oil with 105.59 & 103.09 as targets.
Alternative Price Action: Buy crude above pivot with targets at 112.68 and 115.32 in extension.
Comment: MACD is in the negative territory and Pair below 55MA.
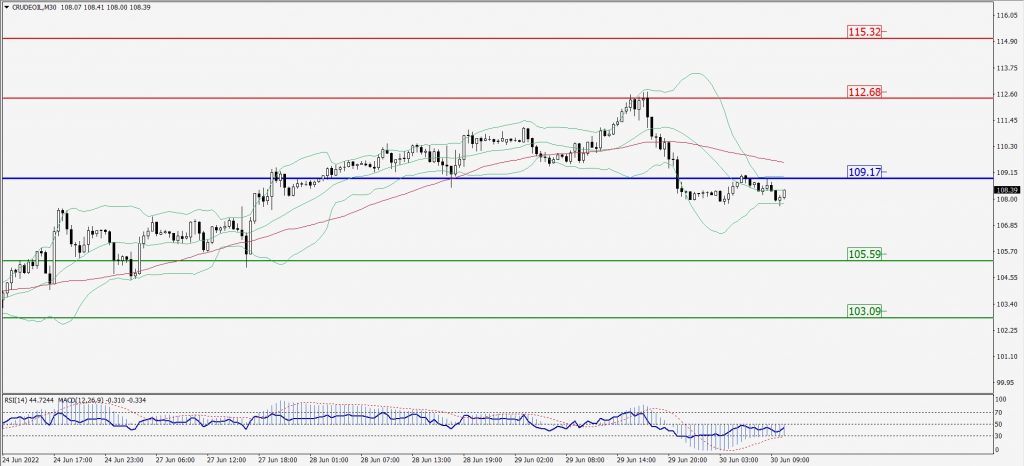
Green Lines Indicate Resistance Levels – Red Lines Indicate Support Levels
Light Blue is a Pivot Point – Black represents the price when the report was produced
XAU/USD Intraday: Major resistance level at 1820.10
Our pivot point is 1820.10
Preferable Price Action: Further downside to 1804.90 and 1793.20
Alternative Price Action: If the price gives an upside breakout of a pivot, then the price extends to 1832.90 and 1843.90.
Comment: MACD is negative territory and Pair below its 20MA & 55MA.
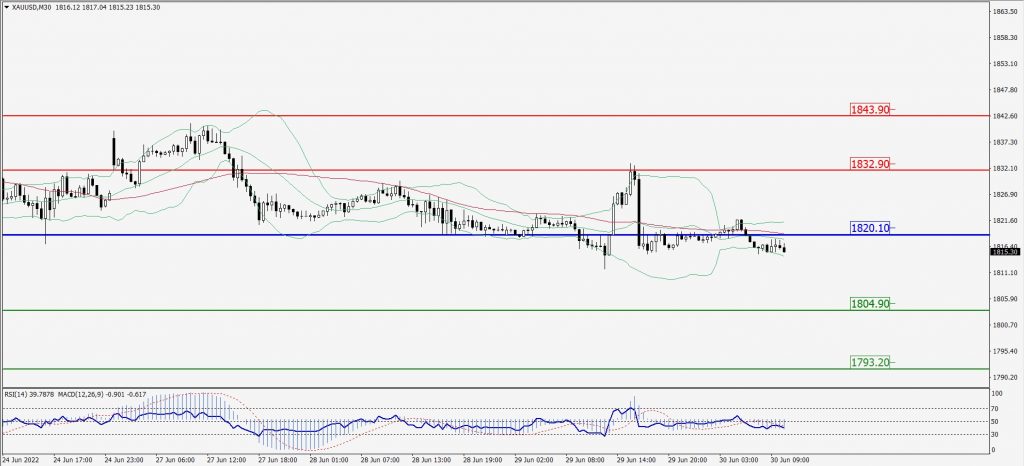
Green Lines Indicate Resistance Levels – Red Lines Indicate Support Levels
Light Blue is a Pivot Point – Black represents the price when the report was produced
Dow Jones Intraday: Major trend on the downside
Our pivot point is 30,825.00
Preferable Price Action: Take sell positions below pivot with targets at 30,287.00 & 29,932.00.
Alternative Price Action: Above 30,825.00 looks for further upside to 31,291.00 & 31,650.00.
Comment: RSI below 50 levels and Pair below its 20MA & 55MA.
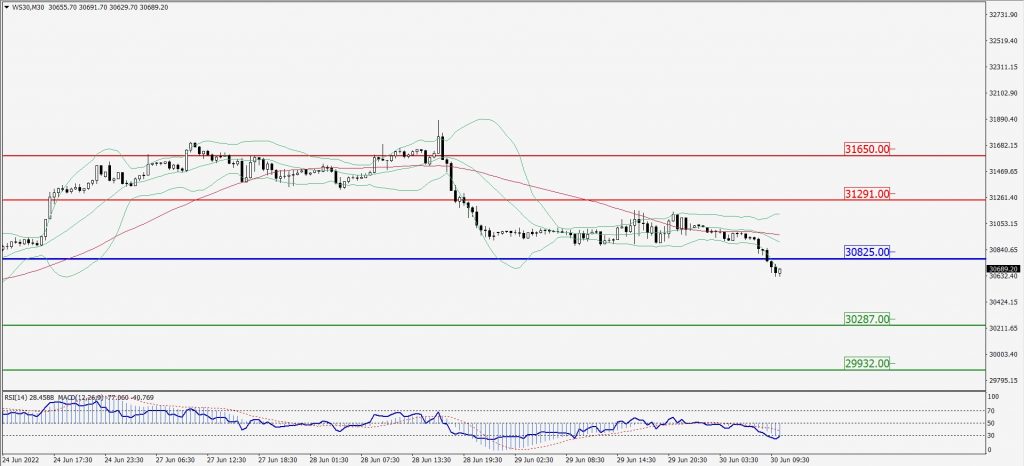
Green Lines Indicate Resistance Levels – Red Lines Indicate Support Levels
Light Blue is a Pivot Point – Black represents the price when the report was produced