Market Wrap: Stocks, Bonds, Commodities
Stocks on global indexes fell sharply on Tuesday, with the S&P 500 down 2% after a report showed US consumer confidence dropped in June amid concerns about inflation, while oil prices gained for the third day.
The Dow Jones Industrial Average fell 491.27 points to 30,946.99, the S&P 500 lose 78.56 points to 3,821.55 and the Nasdaq Composite subtract 343.01 points to 11,181.54.
MSCI’s index of Asia-Pacific stocks outside Japan is drop 1.64% to 660.56 levels. Australian index lower 0.94% to 6,700.20. Japanese Nikkei Index drop 0.91% to 26,804.60.
European stocks were negative on Wednesday, with the Stoxx Europe 50 Index fell 0.87% to 3,518.35, Germany’s DAX decline 1.32% to 13,055.73, and France’s CAC lose 0.72% to 6,042.07, and U.K.’s FTSE 100 slipped 0.51% to 7,285.20.
Benchmark 10-year U.S. Treasury fell as demand for safe assets ascend again, today 10-year bond yields a negative 1.69% to 3.1530.
Oil prices rallied for a third day on Tuesday as major producers Saudi Arabia and the United Arab Emirates looked unlikely to be able to boost output significantly while western governments agreed to explore ways to cap the price of Russian oil.
Spot Brent crude oil substract 0.07% to $113.70 per barrel. US West Texas Intermediate crude is down 0.05% to $111.69 a barrel.
The yellow metal gold is decline 0.17% to 1,817.70 dollars per ounce.
Market Wrap: Forex
The dollar climbed on Tuesday while the euro faltered after European Central Bank (ECB) President Christine Lagarde offered no fresh insight into the central bank’s policy outlook.
Today, the U.S. dollar index measures the Greenback against a trade-weighted basket of six major currencies, which is a rose 0.02% to 104.275.
The Euro US Dollar (EUR/USD) is a widely traded pair that is down 0.04% today. This left the pair trading around $1.05150.
The Japanese yen was positive against the U.S. dollar on Wednesday as the stock up. Today USD/JPY is ascend 0.03% to 136.160 level.
Another commodity-related currency negative against the U.S dollar, AUD/USD lose 0.33% to 0.68820, and NZD/USD down 0.18 to 0.62300 level.
EUR/USD Intraday: Trend on the downside
Our pivot point is at 1.05300
Preferable Price Action: Take sell positions below pivot level with targets at 1.04590 & 1.04210 in extension.
Alternative Price Action: Above pivot looks for a further upside to 1.05990 & 1.06400.
Comment: RSI below 50 levels and Pair below its 20MA & 55MA.
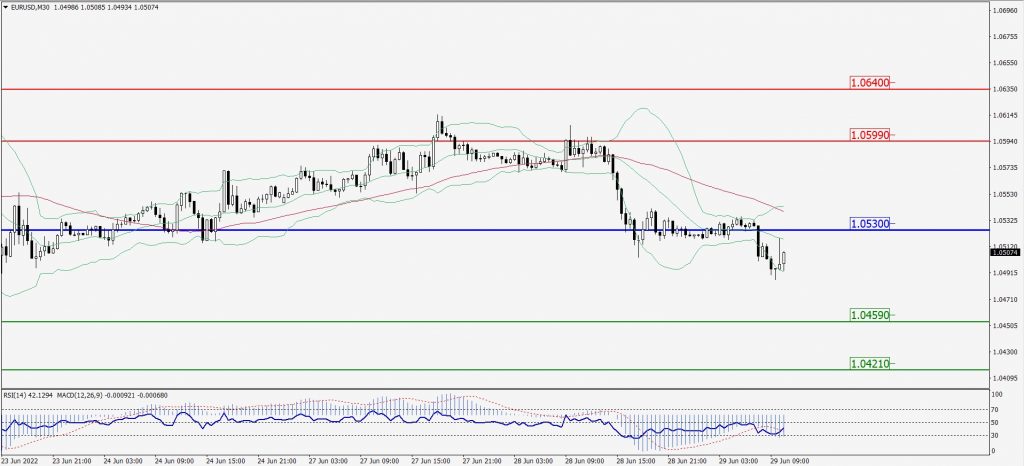
Green Lines Indicate Resistance Levels – Red Lines Indicate Support Levels
Light Blue is a Pivot Point – Black represents the price when the report was produced
GBP/USD Intraday: May trend reverse from 1.22170
Our pivot point is at 1.22170
Preferable Price Action: Sell positions below pivot with targets at 1.21460 & 1.20930 in extension.
Alternative Price Action: The price above pivot would call for further upside to 1.22840 & 1.23400.
Comment: RSI below 50 levels pair below 55MA.
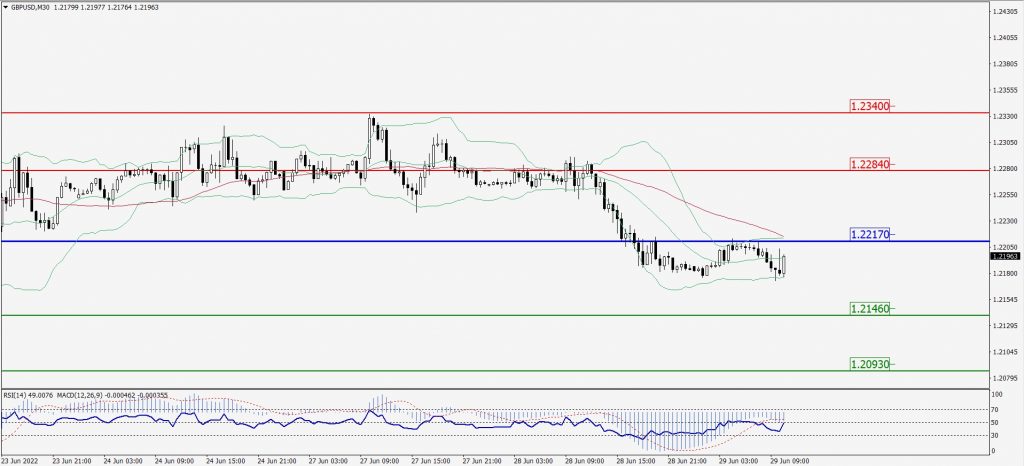
Green Lines Indicate Resistance Levels – Red Lines Indicate Support Levels
Light Blue is a Pivot Point – Black represents the price when the report was produced
USD/JPY Intraday: Support level at 135.910
Our pivot point is at 135.910
Preferable Price Action: Buy position above pivot with the target at 137.090 and 137.840 in extension.
Alternative Price Action: The downside breakout of the pivot would call for 134.930 and 134.230.
Comment: MACD is flat territory and Pair above 55MA.
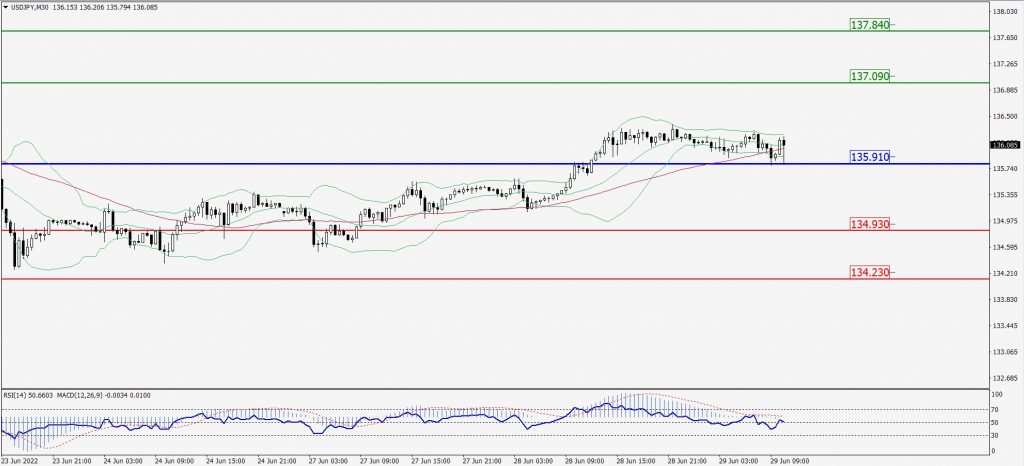
Green Lines Indicate Resistance Levels – Red Lines Indicate Support Levels
Light Blue is a Pivot Point – Black represents the price when the report was produced
AUD/USD Intraday: Trend on the downside
Our pivot point is at 0.69030
Preferable Price Action: Sell Positions below pivot with targets at 0.68540 & 0.68160 in extension.
Alternative Price Action: Above pivot looks for a further upside with 0.69480 & 0.69800 as targets.
Comment: RSI below 50 levels and Pair below its 20MA & 55MA.
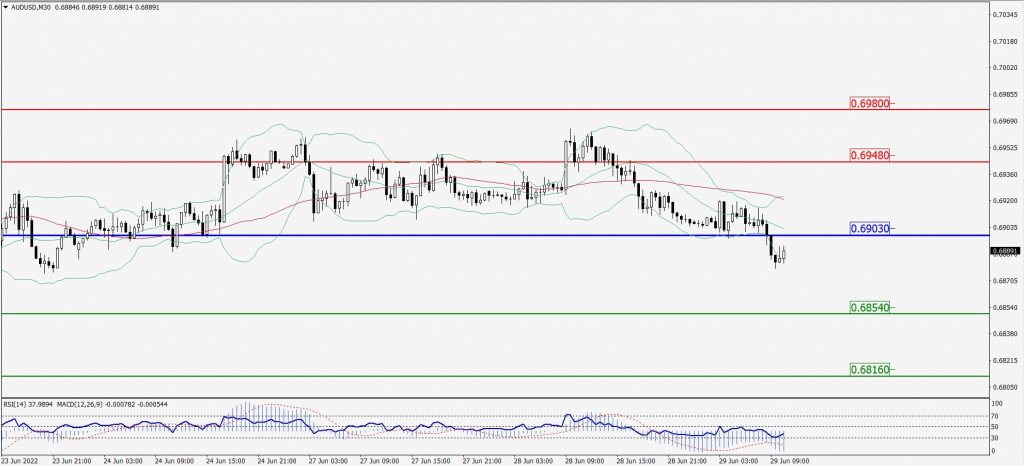
Green Lines Indicate Resistance Levels – Red Lines Indicate Support Levels
Light Blue is a Pivot Point – Black represents the price when the report was produced
CRUDEOIL Intraday: Major support level at 109.990
Our pivot point is at 109.99
Preferable Price Action: Above pivots buy oil with 114.15 & 117.08 as targets.
Alternative Price Action: Sell crude below pivot with targets at 106.59 and 104.33 in extension.
Comment: MACD is in the positive territory and Pair above 55MA.
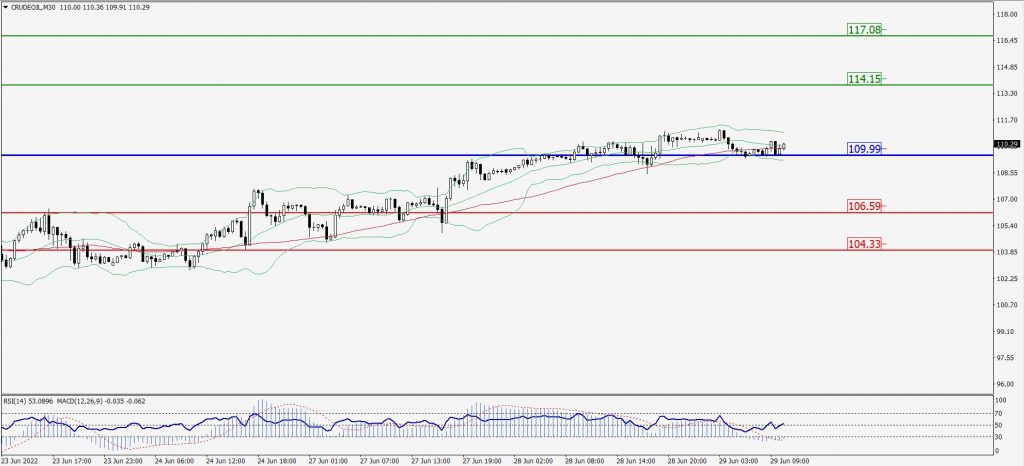
Green Lines Indicate Resistance Levels – Red Lines Indicate Support Levels
Light Blue is a Pivot Point – Black represents the price when the report was produced
XAU/USD Intraday: Resistance level at 1822.40
Our pivot point is 1822.40
Preferable Price Action: Further downside to 1807.10 and 1795.60
Alternative Price Action: If the price gives an upside breakout of a pivot, then the price extends to 1834.50 and 1845.30.
Comment: MACD is negative territory and Pair below its 20MA & 55MA.
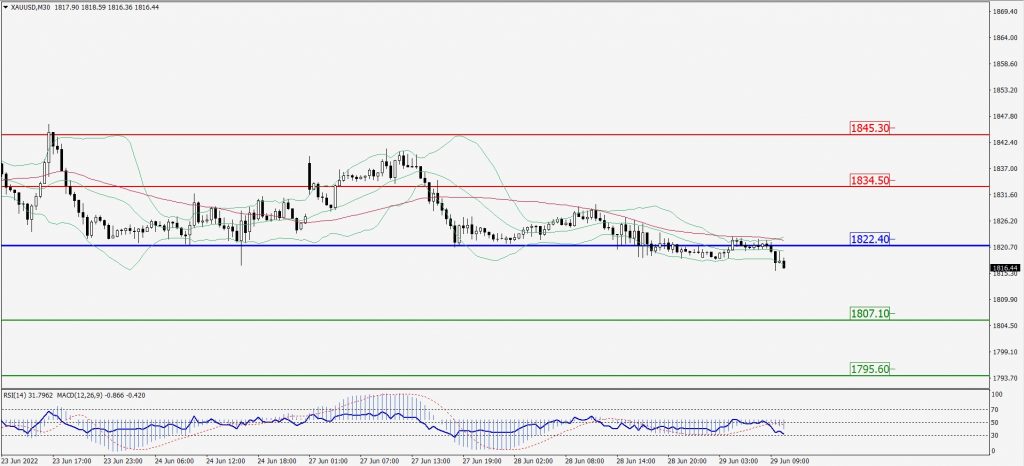
Green Lines Indicate Resistance Levels – Red Lines Indicate Support Levels
Light Blue is a Pivot Point – Black represents the price when the report was produced
Dow Jones Intraday: Major resistance level at 31027.000
Our pivot point is 31,027.00
Preferable Price Action: Take sell positions below pivot with targets at 30,657.00 & 30,364.00.
Alternative Price Action: Above 31,027.00 looks for further upside to 31,391.00 & 31,738.00.
Comment: RSI below 50 levels and Pair below 55MA.
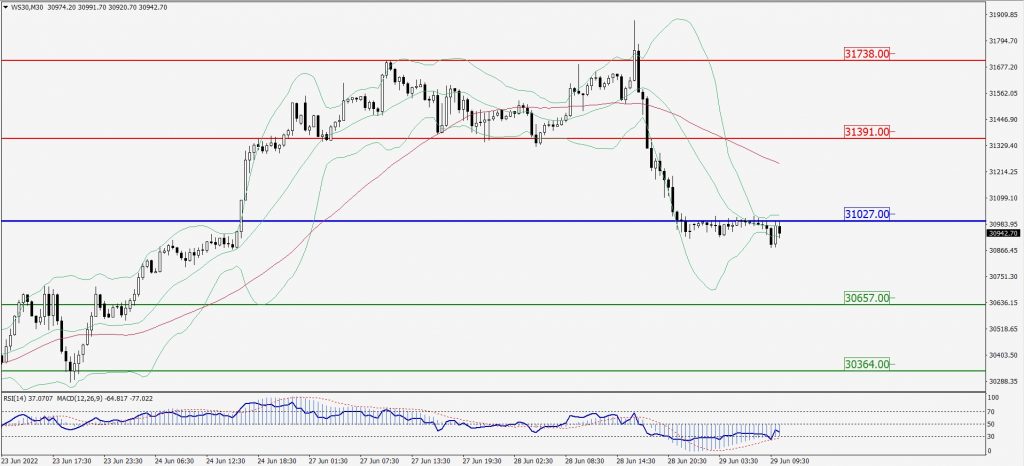
Green Lines Indicate Resistance Levels – Red Lines Indicate Support Levels
Light Blue is a Pivot Point – Black represents the price when the report was produced