Market Wrap: Stocks, Bonds, Commodities
Wall Street’s three major stock indexes ended lower on Friday after a solid jobs report ate in to hopes for a pause in the Federal Reserve’s aggressive policy-tightening which is needed to cool decades-high inflation.
The Dow Jones Industrial Average fell 348.58 points to 32,899.70, the S&P 500 lose 68.28 points to 4,108.54 and the Nasdaq Composite subtract 304.16 points to 12,012.73.
MSCI’s index of Asia-Pacific stocks outside Japan is ascend 1.01% to 684.76 levels. Australian index lower 0.45% to 7,206.30. Japanese Nikkei Index ascend 0.56% to 27,915.89.
European stocks were positive on Monday, with the Stoxx Europe 50 Index rose 1.35% to 3,834.85, Germany’s DAX advance 1.06% to 14,613.82, and France’s CAC gain 1.20% to 6,562.91, and U.K.’s FTSE 100 rose 1.30% to 7,631.02.
Benchmark 10-year U.S. Treasury fell as demand for safe assets ascend again, today 10-year bond yields a positive 0.19% to 2.961.
Oil prices rose more than $2 in early trade on Monday after Saudi Arabia raised prices sharply for its crude sales in July, an indicator of how tight supply is even after OPEC+ agreed to accelerate its output increases over the next two months.
Spot Brent crude oil add 0.18% to $119.94 per barrel. US West Texas Intermediate crude is up 0.25% to $119.22 a barrel.
The yellow metal gold is advance 0.21% to 1,854.00 dollars per ounce.
Market Wrap: Forex
The U.S. dollar edged lower in early European trade Monday, with activity limited ahead of the release of key U.S. consumer inflation data as well as a major European Central Bank meeting.
Today, the U.S. dollar index measures the Greenback against a trade-weighted basket of six major currencies, which is a fell 0.26% to 101.895.
The Euro US Dollar (EUR/USD) is a widely traded pair that is up 0.28% today. This left the pair trading around $1.07480.
The Japanese yen was positive against the U.S. dollar on Monday as the stock up. Today USD/JPY is fell 0.10% to 130.710 level.
Another commodity-related currency positive against the U.S dollar, AUD/USD gain 0.29% to 0.72280, and NZD/USD up 0.37 to 0.65330 level.
EUR/USD Intraday: In a consolidation zone
Our pivot point is at 1.07200
Preferable Price Action: Take buy positions above pivot level with targets at 1.07730 & 1.08170 in extension.
Alternative Price Action: Below pivot looks for a further downside to 1.06730 & 1.06260.
Comment: RSI above 50 levels and Pair above 20MA.
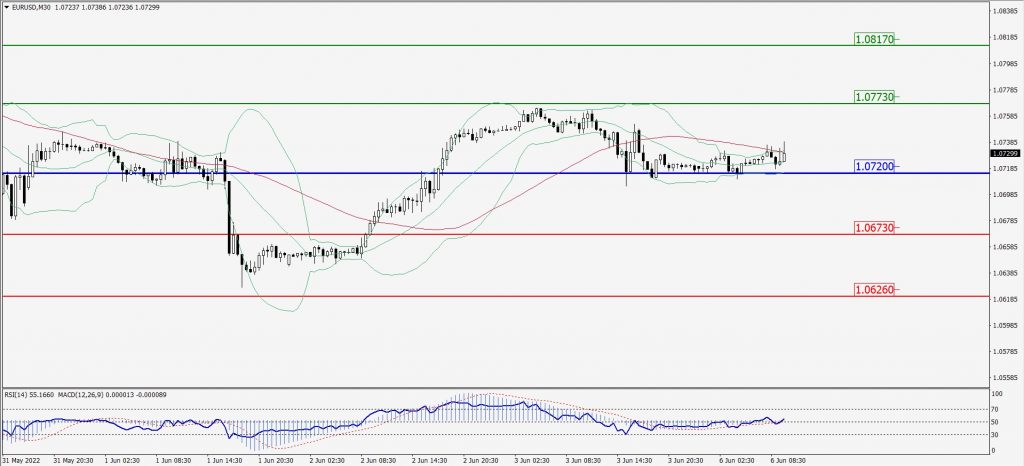
Green Lines Indicate Resistance Levels – Red Lines Indicate Support Levels
Light Blue is a Pivot Point – Black represents the price when the report was produced
GBP/USD Intraday: Major trend on the upside
Our pivot point is at 1.25430
Preferable Price Action: Buy positions above pivot with targets at 1.26420 & 1.27260 in extension.
Alternative Price Action: The price below pivot would call for further downside to 1.24530 & 1.23840.
Comment: RSI above 50 levels pair above its 20MA & 55MA.
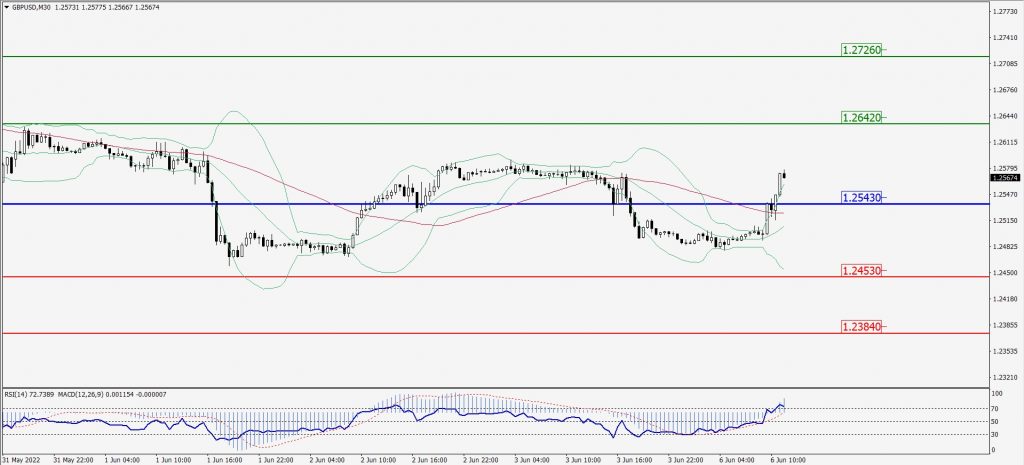
Green Lines Indicate Resistance Levels – Red Lines Indicate Support Levels
Light Blue is a Pivot Point – Black represents the price when the report was produced
USD/JPY Intraday: Trend on the upside
Our pivot point is at 130.520
Preferable Price Action: Buy position above pivot with the target at 131.490 and 132.150 in extension.
Alternative Price Action: The downside breakout of the pivot would call for 129.720 and 129.090.
Comment: MACD is positive territory and Pair above its 20MA & 55MA.
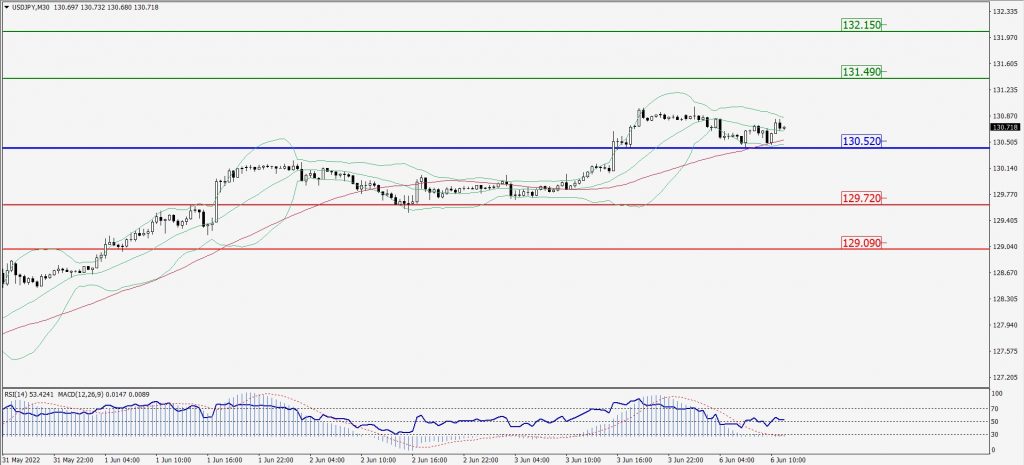
Green Lines Indicate Resistance Levels – Red Lines Indicate Support Levels
Light Blue is a Pivot Point – Black represents the price when the report was produced
AUD/USD Intraday: Trend on the upside
Our pivot point is at 0.72110
Preferable Price Action: Buy Positions above pivot with targets at 0.72750 & 0.73240 in extension.
Alternative Price Action: Below pivot looks for a further downside with 0.71550 & 0.71050 as targets.
Comment: RSI above 50 levels and Pair above its 20MA & 55MA.
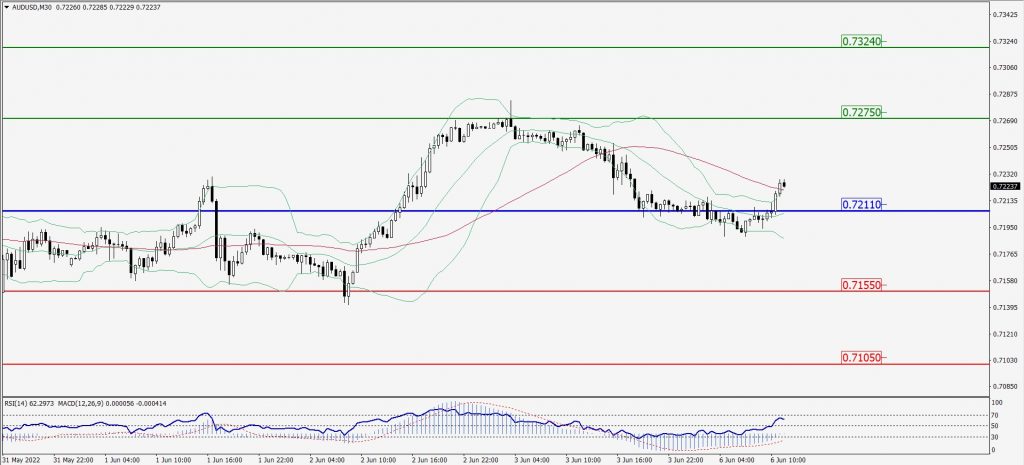
Green Lines Indicate Resistance Levels – Red Lines Indicate Support Levels
Light Blue is a Pivot Point – Black represents the price when the report was produced
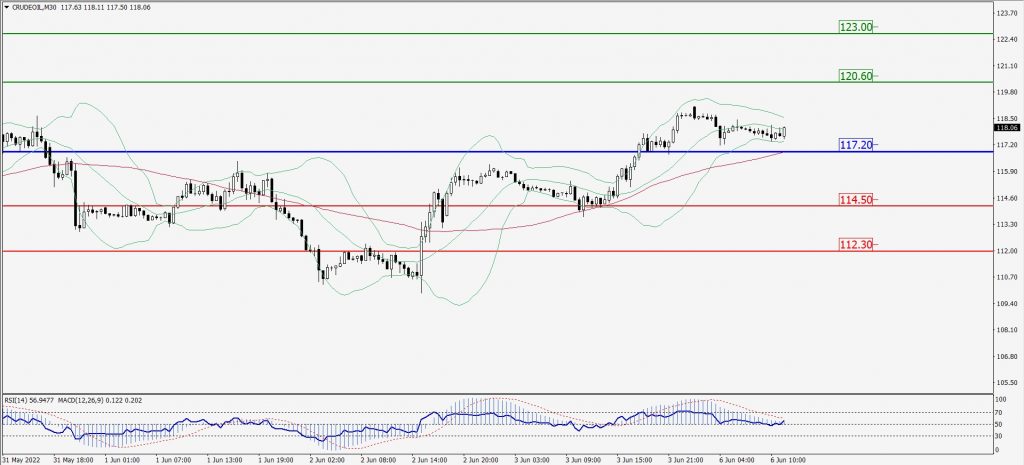
CRUDEOIL Intraday: In a consolidation zone
Our pivot point is at 117.20
Preferable Price Action: above pivots buy oil with 120.60 & 123.00 as targets.
Alternative Price Action: Sell crude below pivot with targets at 114.50 and 112.30 in extension.
Comment: MACD is in the positive territory and Pair above 55MA.
Green Lines Indicate Resistance Levels – Red Lines Indicate Support Levels
Light Blue is a Pivot Point – Black represents the price when the report was produced
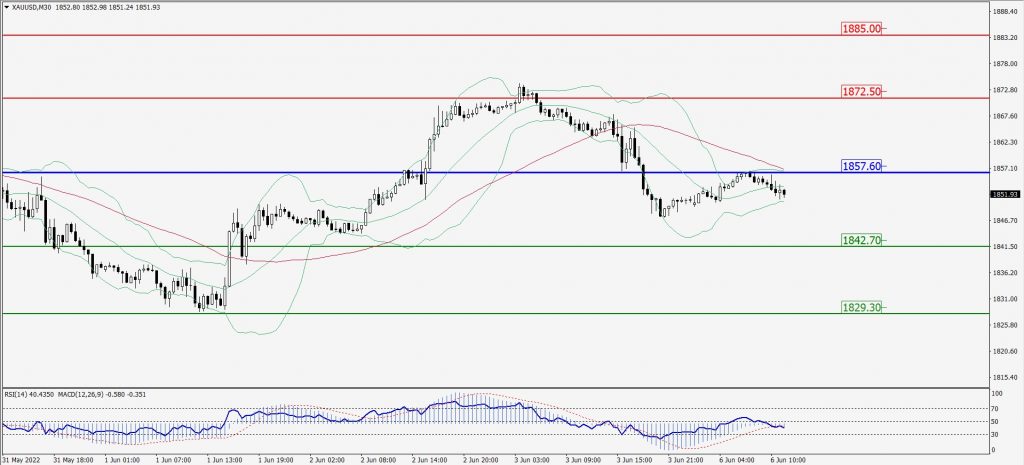
XAU/USD Intraday: Trend on the downside
Our pivot point is 1857.00
Preferable Price Action: Further downside to 1842.70 and 1829.30
Alternative Price Action: If the price gives an upside breakout of a pivot, then the price extends to 1872.50 and 1885.00.
Comment: MACD is negative territory and pair below its 20MA & 55MA.
Green Lines Indicate Resistance Levels – Red Lines Indicate Support Levels
Light Blue is a Pivot Point – Black represents the price when the report was produced
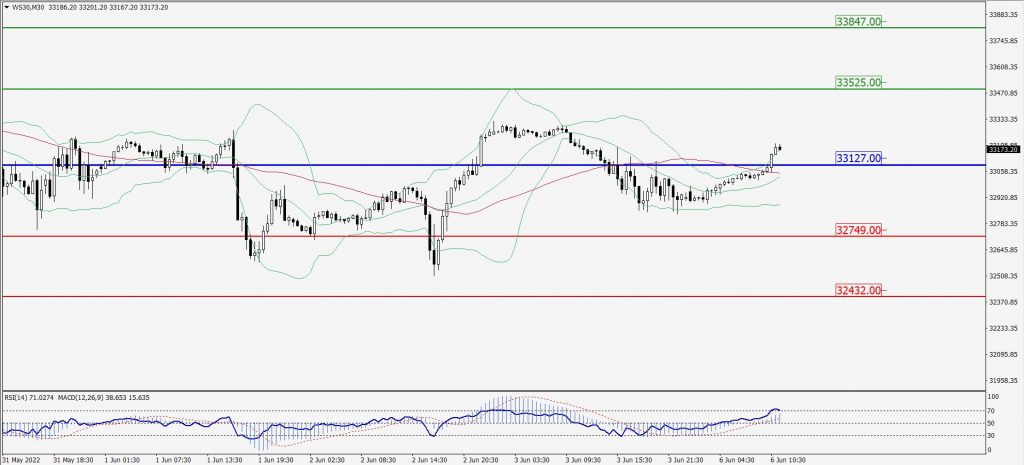
Dow Jones Intraday: Trend on the upside
Our pivot point is 33,127.00
Preferable Price Action: Take buy positions above pivot with targets at 33,525.00 & 33,847.00.
Alternative Price Action: Below 33,127.00 looks for further downside to 32,749.00 & 32,432.00.
Comment: RSI above 50 levels and Pair above its 20MA & 55MA.
Green Lines Indicate Resistance Levels – Red Lines Indicate Support Levels
Light Blue is a Pivot Point – Black represents the price when the report was produced