Market Wrap: Stocks, Bonds, Commodities
Wall Street ended sharply higher on Thursday, led by Tesla, Nvidia and other mega-cap growth stocks in a choppy session ahead of a key jobs report due on Friday.
The Dow Jones Industrial Average rose 435.05 points to 33,248.28, the S&P 500 gain 75.59 points to 4,176.82 and the Nasdaq Composite add 322.44 points to 12,316.90.
MSCI’s index of Asia-Pacific stocks outside Japan is ascend 0.34% to 680.15 levels. Australian index higher 0.88% to 7,238.80. Japanese Nikkei Index ascend 1.27% to 27,761.57.
European stocks were positive on Friday, with the Stoxx Europe 50 Index rose 0.21% to 3,803.25, Germany’s DAX advance 0.26% to 14,524.93, and France’s CAC gain 0.26% to 6,517.06, and U.K.’s FTSE 100 fell 0.98% to 7,532.95.
Benchmark 10-year U.S. Treasury fell as demand for safe assets ascend again, today 10-year bond yields a positive 0.06% to 2.917.
Oil prices were roughly unchanged on Friday, clinging to gains made in the previous session on doubts that producers belonging to OPEC+ can hike their crude output enough to make up for lost supply from Russia.
Spot Brent crude oil subtract 1.07% to $116.32 per barrel. US West Texas Intermediate crude is down 1.15% to $115.53 a barrel.
The yellow metal gold is decline 0.18% to 1,868.25 dollars per ounce.
Market Wrap: Forex
The U.S. dollar fell across the board on Thursday, ceding ground gained in recent sessions as firmer risk sentiment prompted investors to reach for higher-yielding currencies.
Today, the U.S. dollar index measures the Greenback against a trade-weighted basket of six major currencies, which is a fell 0.11% to 101.718.
The Euro US Dollar (EUR/USD) is a widely traded pair that is up 0.10% today. This left the pair trading around $1.07560.
The Japanese yen was positive against the U.S. dollar on Friday as the stock up. Today USD/JPY is rose 0.04% to 129.880 level.
Another commodity-related currency negative against the U.S dollar, AUD/USD lose 0.07% to 0.72590, and NZD/USD down 0.02 to 0.65570 level.
EUR/USD Intraday: Trend on the upside
Our pivot point is at 1.07310
Preferable Price Action: Take buy positions above pivot level with targets at 1.08000 & 1.08720 in extension.
Alternative Price Action: Below pivot looks for a further downside to 1.06670 & 1.06000.
Comment: RSI above 50 levels and Pair above 55MA.
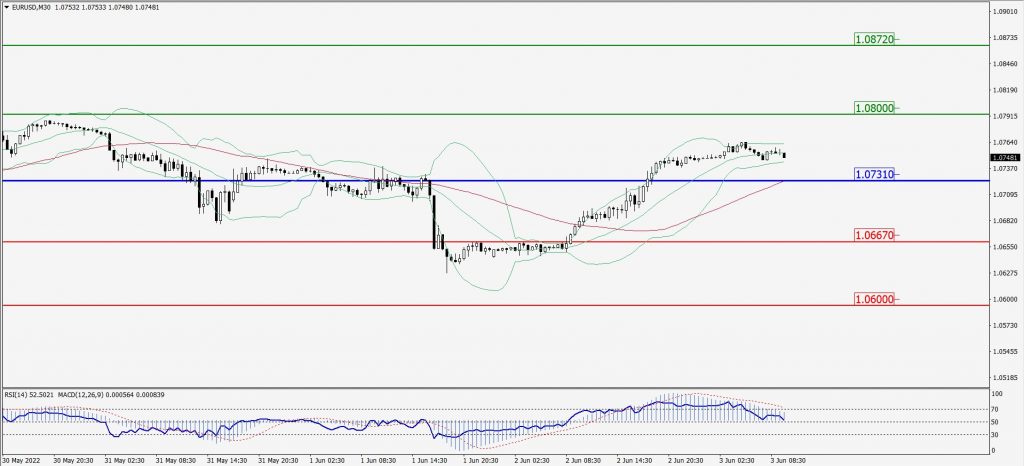
Green Lines Indicate Resistance Levels – Red Lines Indicate Support Levels
Light Blue is a Pivot Point – Black represents the price when the report was produced
GBP/USD Intraday: May trend reverse from 1.25910
Our pivot point is at 1.25910
Preferable Price Action: Sell positions below pivot with targets at 1.25230 & 1.24580 in extension.
Alternative Price Action: The price above pivot would call for further upside to 1.26570 & 1.27220.
Comment: RSI below 50 levels pair below 20MA.
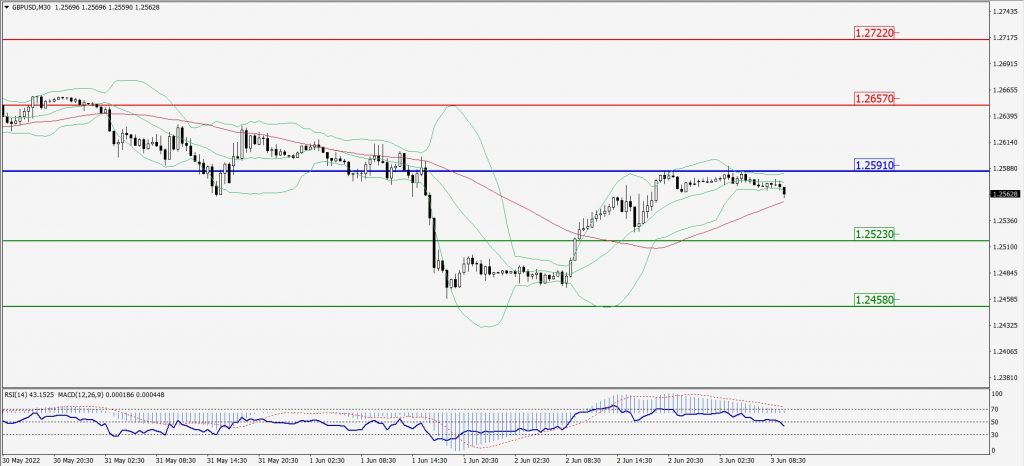
Green Lines Indicate Resistance Levels – Red Lines Indicate Support Levels
Light Blue is a Pivot Point – Black represents the price when the report was produced
USD/JPY Intraday: Trend on the upside
Our pivot point is at 129.810
Preferable Price Action: Buy position above pivot with the target at 130.760 and 131.570 in extension.
Alternative Price Action: The downside breakout of the pivot would call for 128.810 and 128.000.
Comment: MACD is positive territory and Pair above its 20MA & 55MA.
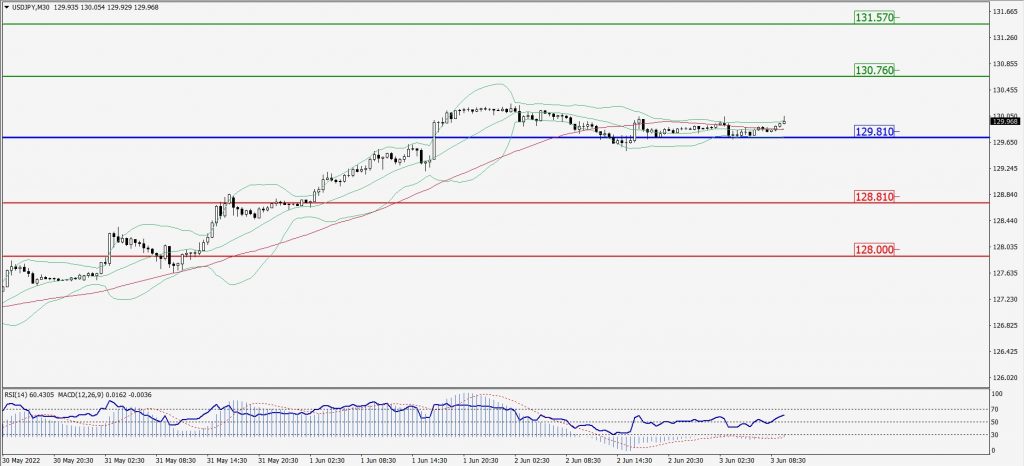
Green Lines Indicate Resistance Levels – Red Lines Indicate Support Levels
Light Blue is a Pivot Point – Black represents the price when the report was produced
AUD/USD Intraday: In a consolidation zone
Our pivot point is at 0.72430
Preferable Price Action: Buy Positions above pivot with targets at 0.73290 & 0.73890 in extension.
Alternative Price Action: Below pivot looks for a further downside with 0.71660 & 0.71060 as targets.
Comment: RSI at 50 levels and Pair above 55MA.
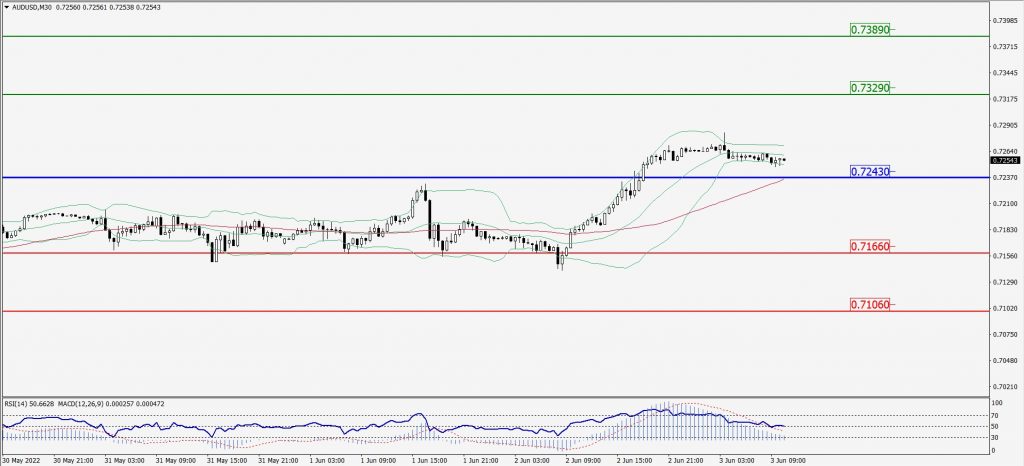
Green Lines Indicate Resistance Levels – Red Lines Indicate Support Levels
Light Blue is a Pivot Point – Black represents the price when the report was produced
CRUDEOIL Intraday: Resistance level at 115.60
Our pivot point is at 115.60
Preferable Price Action: Below pivots sell oil with 112.60 & 110.40 as targets.
Alternative Price Action: Buy crude above pivot with targets at 118.50 and 120.80 in extension.
Comment: MACD is in the negative territory and Pair below 20MA.
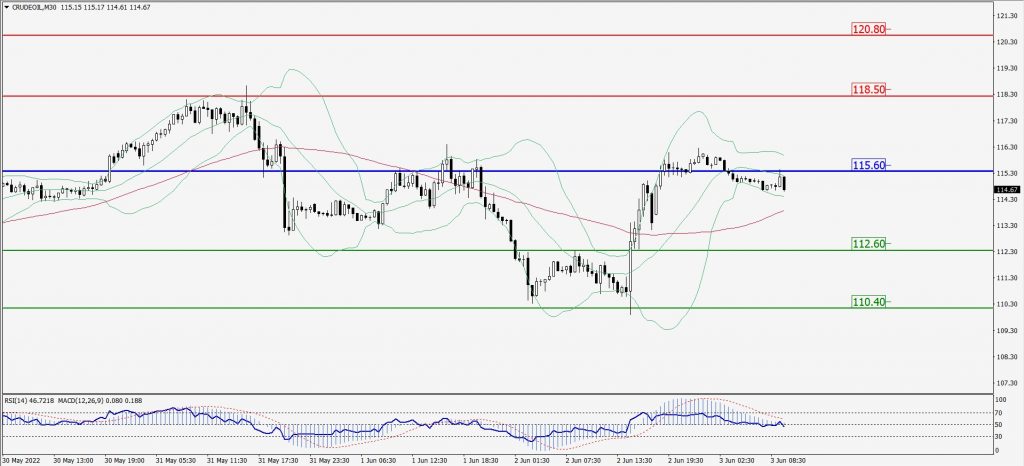
Green Lines Indicate Resistance Levels – Red Lines Indicate Support Levels
Light Blue is a Pivot Point – Black represents the price when the report was produced
XAU/USD Intraday: Trend on the downside
Our pivot point is 1872.00
Preferable Price Action: Further downside to 1854.70 and 1841.60
Alternative Price Action: If the price gives an upside breakout of a pivot, then the price extends to 1888.10 and 1899.90.
Comment: MACD is negative territory and pair below 20MA.
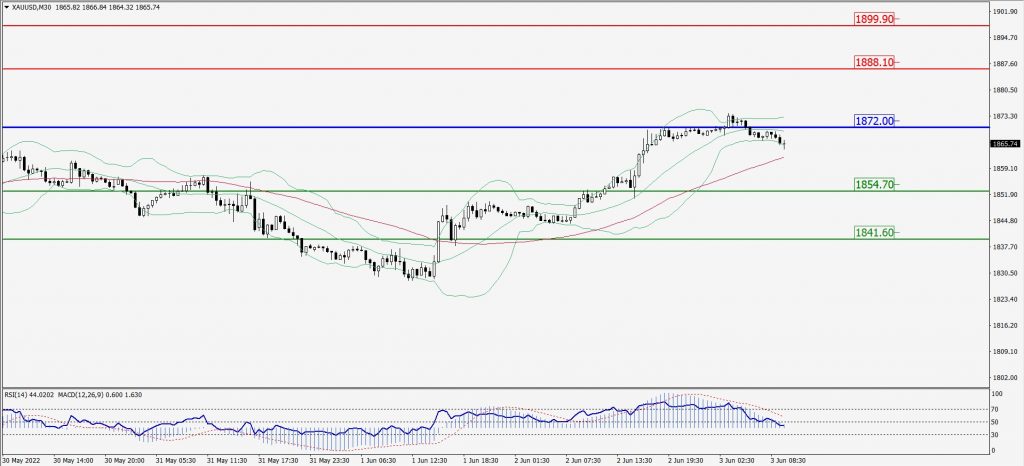
Green Lines Indicate Resistance Levels – Red Lines Indicate Support Levels
Light Blue is a Pivot Point – Black represents the price when the report was produced
Dow Jones Intraday: In a consolidation zone
Our pivot point is 33,121.00
Preferable Price Action: Take buy positions above pivot with targets at 33,612.00 & 33,989.00.
Alternative Price Action: Below 33,121.00 looks for further downside to 32,685.00 & 32,361.00.
Comment: RSI above 50 levels and Pair above 55MA.
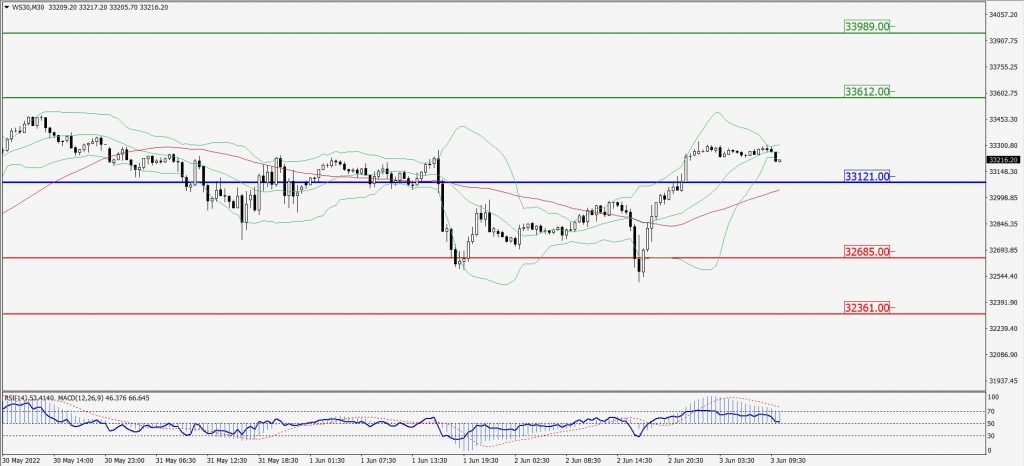
Green Lines Indicate Resistance Levels – Red Lines Indicate Support Levels
Light Blue is a Pivot Point – Black represents the price when the report was produced