Market Wrap: Stocks, Bonds, Commodities
Wall Street closed sharply higher on Friday as signs of peaking inflation and consumer resilience sent investors into the long holiday weekend with growing optimism that the Federal Reserve will be able to tighten the monetary policy without tipping the economy into recession.
The Dow Jones Industrial Average rose 575.77 points to 33,212.96, the S&P 500 gained 100.40 points to 4,158.24 and the Nasdaq Composite added 390.48 points to 12,131.13.
MSCI’s index of Asia-Pacific stocks outside Japan is ascend 2.07% to 678.37 levels. Australian index higher 1.45% to 7,286.60. Japanese Nikkei Index ascend 2.19% to 27,369.43.
European stocks were positive on Monday, with the Stoxx Europe 50 Index rose 1.11% to 3,851.05, Germany’s DAX advance 0.86% to 14,587.42, and France’s CAC rose 1.02% to 6,581.45, and U.K.’s FTSE 100 rose 0.50% to 7,624.10.
Benchmark 10-year U.S. Treasury fell as demand for safe assets ascend again, today 10-year bond yields a negative 0.21% to 2.743.
Oil prices rose to two-month highs on Monday as traders waited to see if the European Union would reach an agreement on banning Russian oil ahead of a meeting on a sixth package of sanctions against Moscow for its invasion of Ukraine.
Spot Brent crude oil advance 0.94% to $116.65 per barrel. US West Texas Intermediate crude is up 0.93% to $116.15 a barrel.
The yellow metal gold is advance 0.29% to 1,856.65 dollars per ounce.
Market Wrap: Forex
The U.S. dollar slipped lower in early European trade Monday, heading for its first monthly drop in five months as a calmer risk environment and raised expectations of a pause in the Federal Reserve’s tightening cycle weighed.
Today, the U.S. dollar index measures the Greenback against a trade-weighted basket of six major currencies, which is a fell 0.12% to 101.570.
The Euro US Dollar (EUR/USD) is a widely traded pair that is advance 0.21% today. This left the pair trading around $1.07490.
The Japanese yen was positive against the U.S. dollar on Monday as the stock up. Today USD/JPY is rose 0.16% to 127.310 level.
Another commodity-related currency positive against the U.S dollar, AUD/USD gain 0.22% to 0.71760, and NZD/USD up 0.06 to 0.65380 level.
EUR/USD Intraday: Trend on The Upside
Our pivot point is at 1.07470
Preferable Price Action: Take buy positions above pivot level with targets at 1.07980 & 1.08360 in extension.
Alternative Price Action: Below pivot looks for a further downside to 1.07030 & 1.06670.
Comment: RSI above 50 levels and Pair above its 20MA & 55MA.
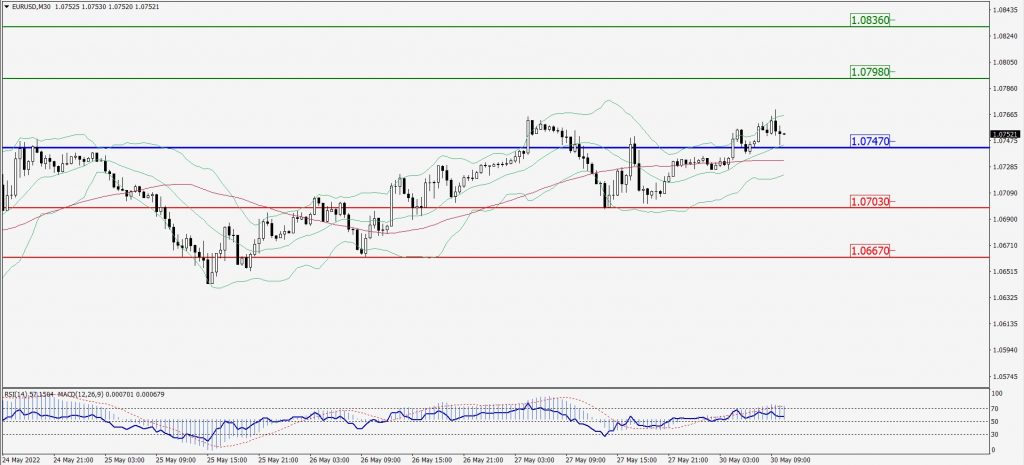
Green Lines Indicate Resistance Levels – Red Lines Indicate Support Levels
Light Blue is a Pivot Point – Black represents the price when the report was produced
GBP/USD Intraday: In a Consolidation Zone
Our pivot point is at 1.26480
Preferable Price Action: Sell positions below pivot with targets at 1.25790 & 1.25220 in extension.
Alternative Price Action: The price above pivot would call for further upside to 1.27120 & 1.27640.
Comment: RSI below 50 levels pair below 20MA.
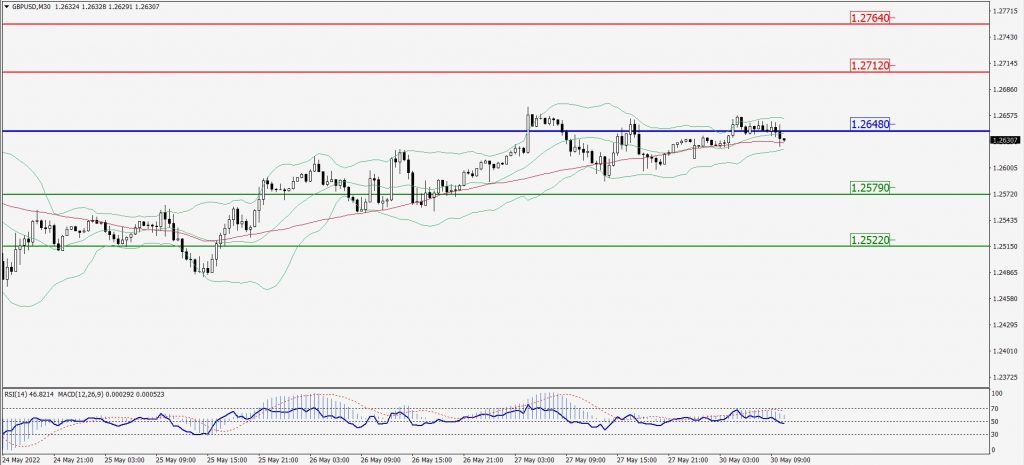
Green Lines Indicate Resistance Levels – Red Lines Indicate Support Levels
Light Blue is a Pivot Point – Black represents the price when the report was produced
USD/JPY Intraday: Support Level at 127.190
Our pivot point is at 127.190
Preferable Price Action: Buy position above pivot with the target at 127.730 and 128.070 in extension.
Alternative Price Action: The downside breakout of the pivot would call for 126.760 and 126.440.
Comment: MACD is positive territory and Pair above its 20MA & 55MA.
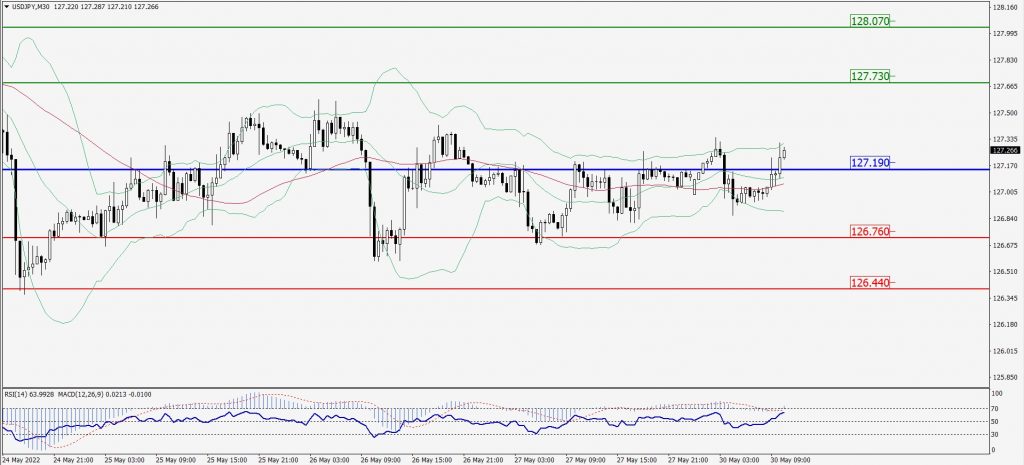
Green Lines Indicate Resistance Levels – Red Lines Indicate Support Levels
Light Blue is a Pivot Point – Black represents the price when the report was produced
AUD/USD Intraday: Major Trend on the Upside
Our pivot point is at 0.71640
Preferable Price Action: Buy Positions above pivot with targets at 0.72340 & 0.72840 in extension.
Alternative Price Action: Below pivot looks for a further downside with 0.70910 & 0.70360 as targets.
Comment: RSI above 50 levels and Pair above its 20MA & 55MA.
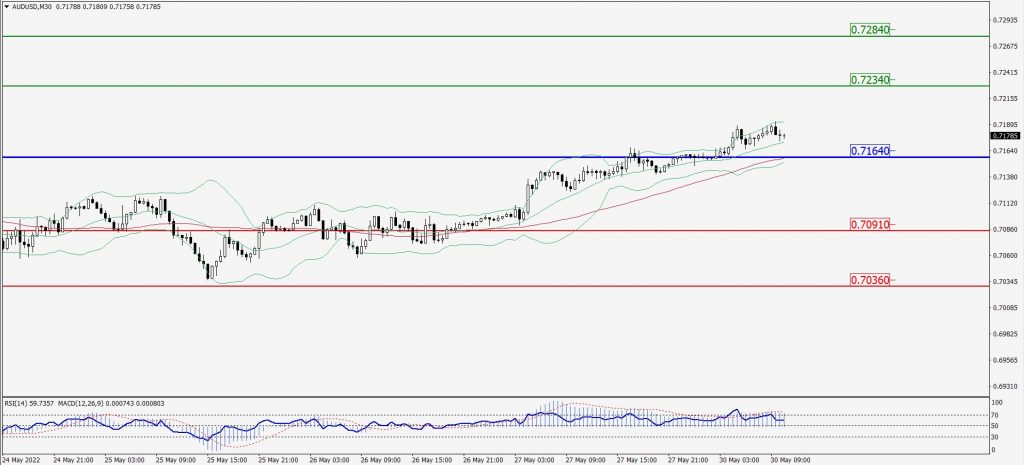
Green Lines Indicate Resistance Levels – Red Lines Indicate Support Levels
Light Blue is a Pivot Point – Black represents the price when the report was produced
CRUDEOIL Intraday: Major Trend on The Upside
Our pivot point is at 114.00
Preferable Price Action: Above pivots buy oil with 116.01 & 117.51 as targets.
Alternative Price Action: Sell crude below pivot with targets at 112.17 and 110.74 in extension.
Comment: MACD is in the positive territory and Pair above 55MA.
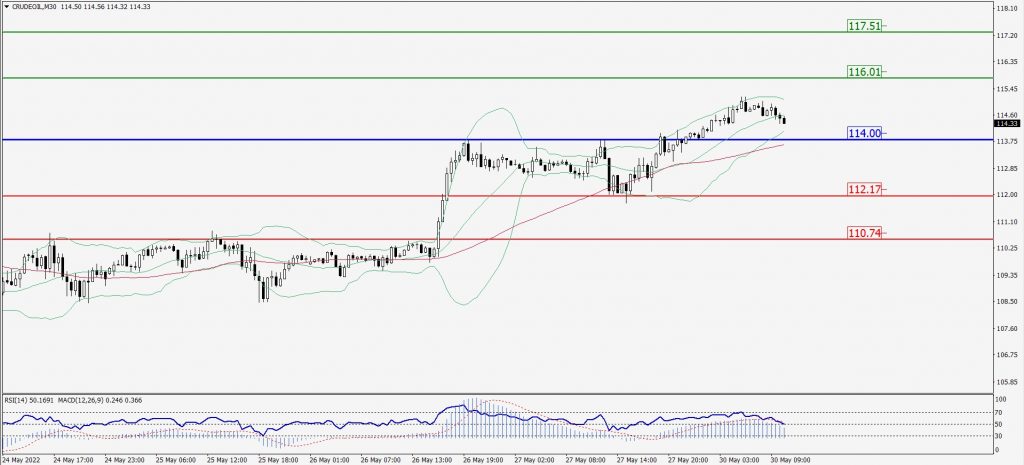
Green Lines Indicate Resistance Levels – Red Lines Indicate Support Levels
Light Blue is a Pivot Point – Black represents the price when the report was produced
XAU/USD Intraday: Trend on the upside
Our pivot point is 1858.00
Preferable Price Action: Further upside to 1875.30 and 1886.50
Alternative Price Action: If the price gives a downside breakout of a pivot, then the price extends to 1841.70 and 1830.90.
Comment: MACD is positive territory and pair above its 20MA & 55MA.
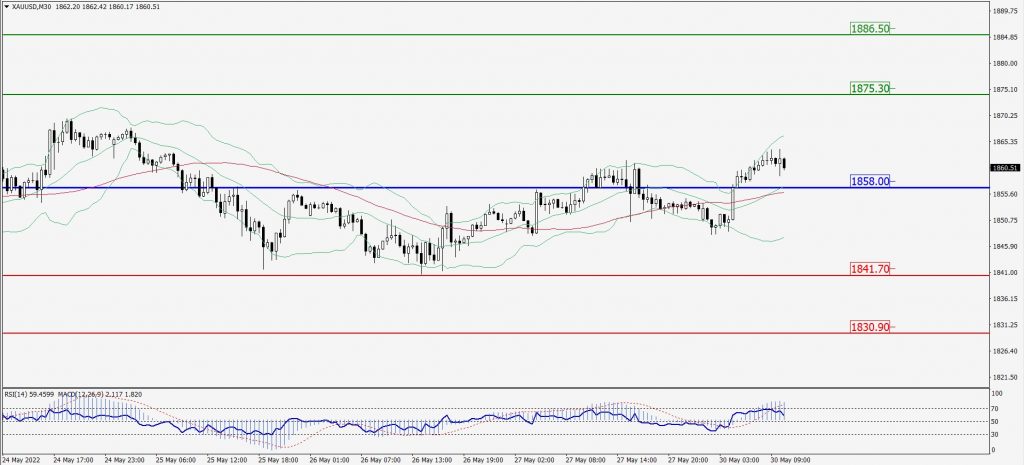
Green Lines Indicate Resistance Levels – Red Lines Indicate Support Levels
Light Blue is a Pivot Point – Black represents the price when the report was produced
Dow Jones Intraday: Major trend on the upside
Our pivot point is 33,201.00
Preferable Price Action: Take buy positions above pivot with targets at 34,028.00 & 34,629.00.
Alternative Price Action: Below 33,201.00 looks for further downside to 32,474.00 & 31,880.00.
Comment: RSI above 50 levels and Pair above its 20MA & 55MA.
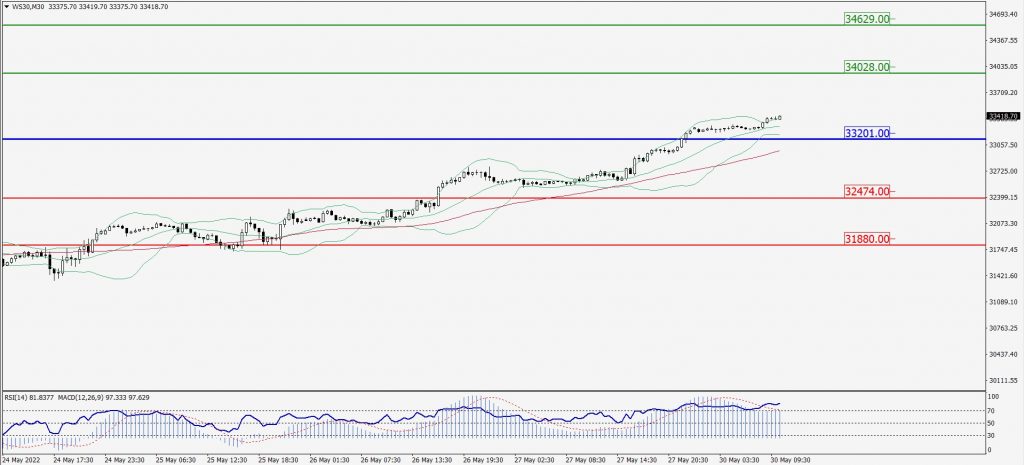
Green Lines Indicate Resistance Levels – Red Lines Indicate Support Levels
Light Blue is a Pivot Point – Black represents the price when the report was produced