Market Wrap: Stocks, Bonds, Commodities
The S&P 500 and the Nasdaq logged their seventh straight week of losses, their longest losing streak since the end of the dotcom bubble in 2001.
The S&P 500 gain (0.01%) ended at 3,901.36 points, while the Nasdaq Composite down 0.30% to 11,354.62. The Dow Jones Industrial was rose 0.03% to 31,261.90.
MSCI’s index of Asia-Pacific stocks outside Japan is drop 0.34% to 661.06 levels. Australian index higher 0.05% to 7,148.90. Japanese Nikkei Index ascend 0.98% to 27,001.52.
European stocks were positive on Monday, with the Stoxx Europe 50 Index gain 0.67% to 3,681.45, Germany’s DAX advance 1.06% to 14,128.63, and France’s CAC up 0.40% to 6,310.35, and U.K.’s FTSE 100 increase 0.84% to 7,450.19.
Benchmark 10-year U.S. Treasury fell as demand for safe assets ascend again, today 10-year bond yields a positive 2.8120.
Oil prices rose in early trade on Monday with the US fuel demand, tight supply and a slightly weaker US dollar supporting the market, as Shanghai prepares to reopen after a two-month lockdown fuelled worries about a sharp slowdown in growth.
Spot Brent crude oil rose 1.16% to $111.27 per barrel. US West Texas Intermediate crude is up 1.05% to $111.44 a barrel.
The yellow metal gold is advance 0.72% to 1,855.40 dollars per ounce.
Market Wrap: Forex
The dollar slipped on Monday as investors kept up selling pressure, cutting bets on further dollar gains from rising U.S. rates, while turning hopeful that loosening lockdowns in China can help global growth and exporters’ currencies.
Today, the U.S. dollar index measures the Greenback against a trade-weighted basket of six major currencies, which is a fell of 0.56% to 102.590.
The Euro US Dollar (EUR/USD) is a widely traded pair that is up 0.51% today. This left the pair trading around $1.06150.
The Japanese yen was positive against the U.S. dollar on Monday as the stock up. Today USD/JPY is lose 0.23% to 127.560 level.
Another commodity-related currency positive against the U.S dollar, AUD/USD ascend 1.07 to 0.71080, and NZD/USD higher 1.26% to 0.64690 level.
EUR/USD Intraday: Trend on The Upside
Our pivot point is at 1.05880
Preferable Price Action: Take buy positions above pivot level with targets at 1.06680 & 1.07180 in extension.
Alternative Price Action: Below pivot looks for a further downside to 1.05090 & 1.04550.
Comment: RSI above 50 levels and Pair above its 20MA & 55MA.
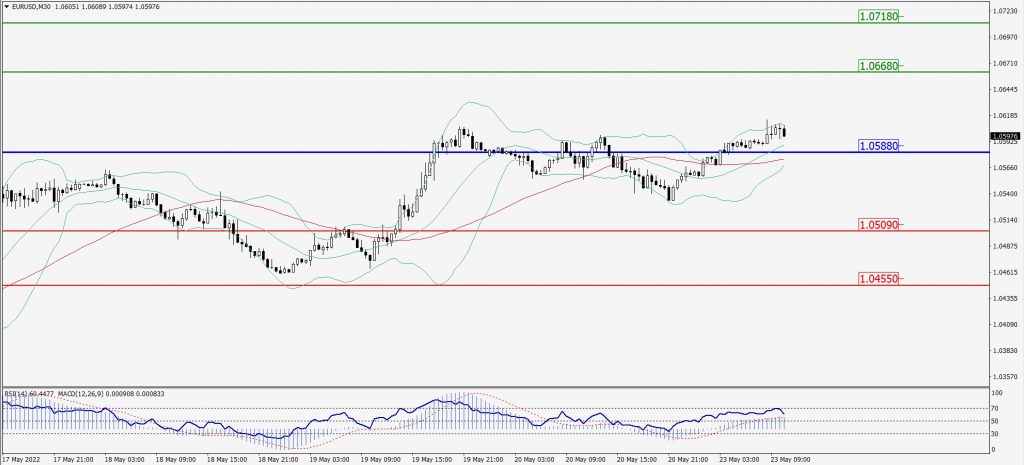
Green Lines Indicate Resistance Levels – Red Lines Indicate Support Levels
Light Blue is a Pivot Point – Black represents the price when the report was produced
GBP/USD Intraday: Trend on The Upside
Our pivot point is at 1.25330
Preferable Price Action: Buy positions above pivot with targets at 1.26440 & 1.27240 in extension.
Alternative Price Action: The price below pivot would call for further downside to 1.24240 & 1.23460.
Comment: RSI above 50 levels pair above its 20MA & 55MA.
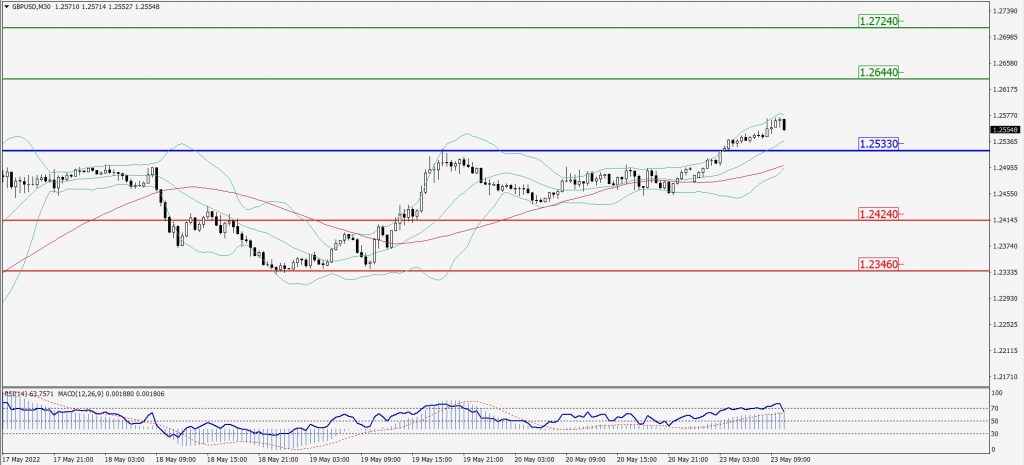
Green Lines Indicate Resistance Levels – Red Lines Indicate Support Levels
Light Blue is a Pivot Point – Black represents the price when the report was produced
USD/JPY Intraday: Major Resistance Level at 128.050
Our pivot point is at 128.050
Preferable Price Action: Sell position below pivot with the target at 126.830 and 125.830 in extension.
Alternative Price Action: The upside breakout of the pivot would call for 129.150 and 130.020.
Comment: MACD is flat territory and Pair below 55MA.
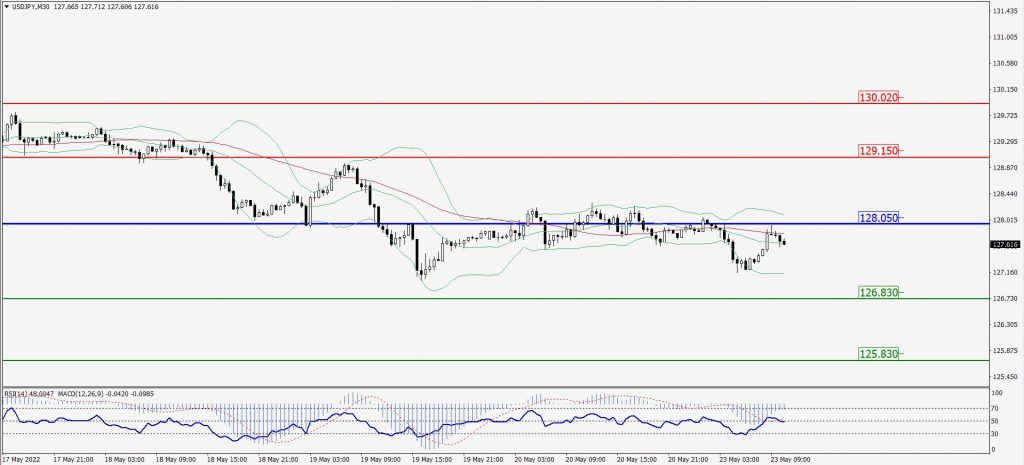
Green Lines Indicate Resistance Levels – Red Lines Indicate Support Levels
Light Blue is a Pivot Point – Black represents the price when the report was produced
AUD/USD Intraday: Trend on The Upside
Our pivot point is at 0.70770
Preferable Price Action: Buy Positions above pivot with targets at 0.71850 & 0.72590 in extension.
Alternative Price Action: Below pivot looks for a further downside with 0.69770 & 0.69090 as targets.
Comment: RSI above 50 levels and Pair above its 20MA & 55MA.
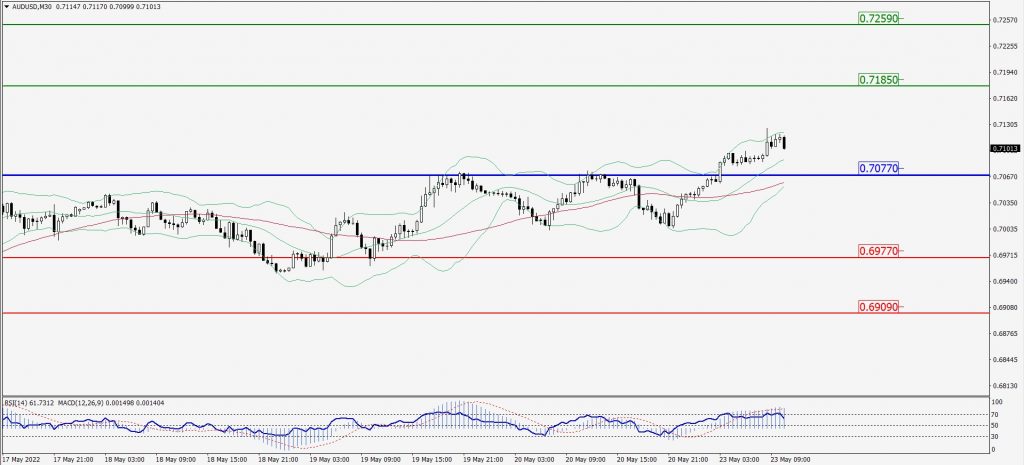
Green Lines Indicate Resistance Levels – Red Lines Indicate Support Levels
Light Blue is a Pivot Point – Black represents the price when the report was produced
CRUDEOIL Intraday: In a Consolidation Zone
Our pivot point is at 109.761
Preferable Price Action: Above pivots buy oil with 113.11 & 115.32 as targets.
Alternative Price Action: Sell crude below pivot with targets at 106.36 and 104.02 in extension.
Comment: MACD is in the positive territory and Pair above its 20MA & 55MA.
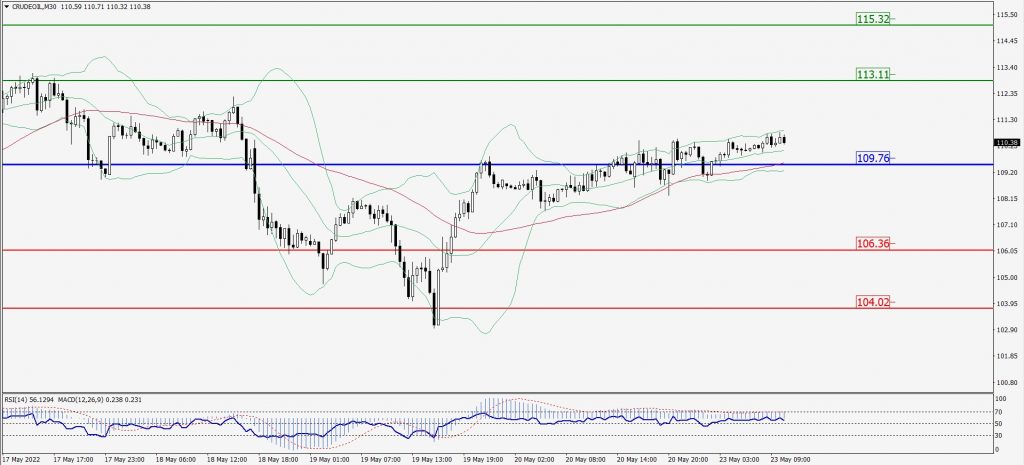
Green Lines Indicate Resistance Levels – Red Lines Indicate Support Levels
Light Blue is a Pivot Point – Black represents the price when the report was produced
XAU/USD Intraday: Major Trend on The Upside
Our pivot point is 1850.80
Preferable Price Action: Further upside to 1881.30 and 1905.30.
Alternative Price Action: If the price gives a downside breakout of a pivot, then the price extends to 1822.00 and 1799.80.
Comment: MACD is positive territory and pair above its 20MA & 55MA.
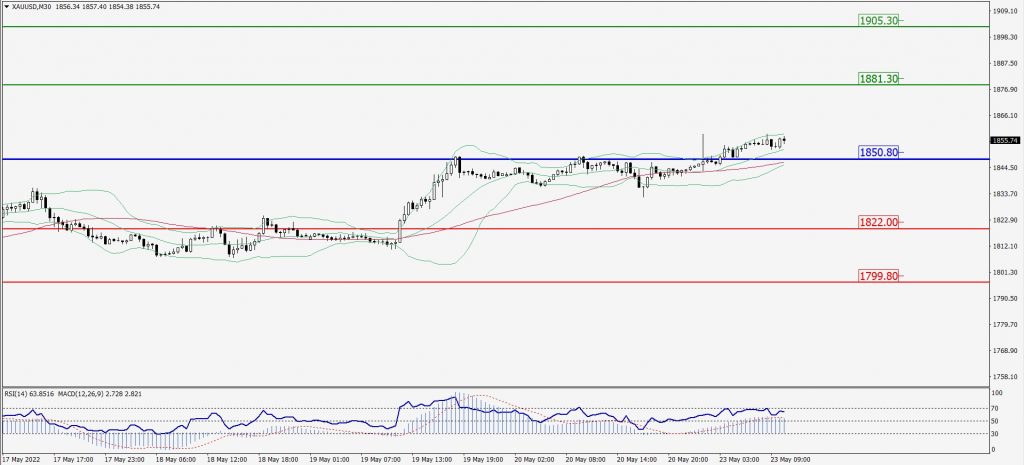
Green Lines Indicate Resistance Levels – Red Lines Indicate Support Levels
Light Blue is a Pivot Point – Black represents the price when the report was produced
Dow Jones Intraday: In a Consolidation Zone
Our pivot point is 31,403.00
Preferable Price Action: Take Buy positions above pivot with targets at 31,897.00 & 32,299.00.
Alternative Price Action: Below 31,403.00 looks for further downside to 31,004.00 & 30,573.00.
Comment: RSI above 50 levels and Pair above 55MA.
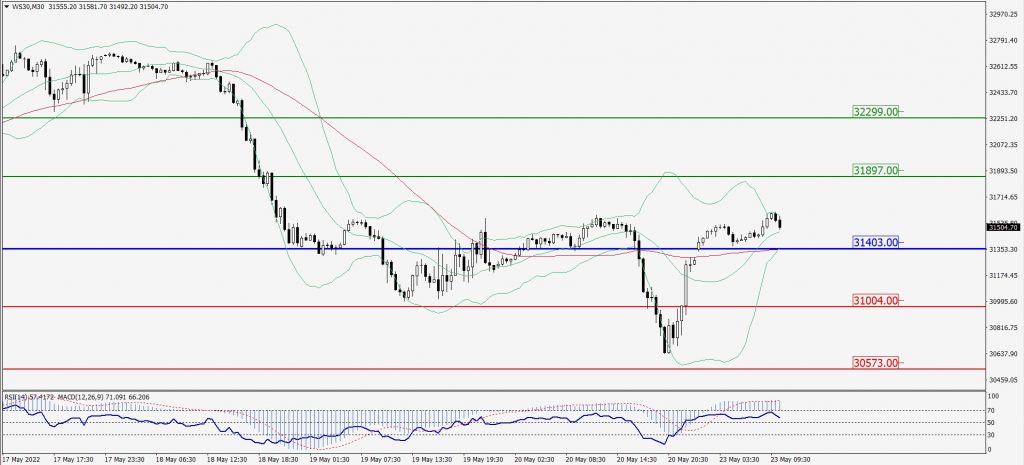
Green Lines Indicate Resistance Levels – Red Lines Indicate Support Levels
Light Blue is a Pivot Point – Black represents the price when the report was produced