Market Wrap: Stocks, Bonds, Commodities
More sharp declines in Big Tech stocks sent the Nasdaq composite down 4 percent Tuesday, the worst drop for the tech-heavy index since September 2020. The S&P 500 fell 2 percent. The Dow Jones Industrial Average fell 627 points, or 1.8 percent, to 33,427 and the Nasdaq fell 3 percent.
The S&P 500 lose (2.81%) ended at 4,175.20 points, while the Nasdaq Composite down 3.95% to 12,490.74. The Dow Jones Industrial was fell 2.38% to 33,240.18.
MSCI’s index of Asia-Pacific stocks outside Japan is drop 0.93% to 660.90 levels. Australian index lower 0.78% to 7,261.20. Japanese Nikkei Index slipped 1.17% to 26,386.63.
European stocks were positive on Wednesday, with the Stoxx Europe 50 Index gain 0.31% to 3,732.15, Germany’s DAX ascend 0.37% to 13,809.80, and France’s CAC up 0.34% to 6,434.39, and U.K.’s FTSE 100 increase 0.26% to 7,403.71.
Benchmark 10-year U.S. Treasury fell as demand for safe assets ascend again, today 10-year bond yields flat 2.7720.
Oil prices settled higher on Tuesday, rebounding in volatile trading as the market weighed China’s plans to support its economy against a possible coronavirus lockdown in its capital Beijing.
Spot Brent crude oil rose 0.41% to $105.48 per barrel. US West Texas Intermediate crude is up 0.29% to $101.97 a barrel.
The yellow metal gold is decline 0.49% to 1,896.05 dollars per ounce.
Market Wrap: Forex
The U.S. dollar posted further gains in early European trade Wednesday, trading at two-year highs on safe-haven flows as traders digested slowing global growth, raised geopolitical tensions, and the prospect of more tightening by the Federal Reserve.
Today, the U.S. dollar index measures the Greenback against a trade-weighted basket of six major currencies, which is a rose of 0.25% to 102.580.
The Euro US Dollar (EUR/USD) is a widely traded pair that is down 0.22% today. This left the pair trading around $1.06140.
The Japanese yen was positive against the U.S. dollar on Wednesday as the stock up. Today USD/JPY is rose 0.47% to 127.810 level.
Another commodity-related currency positive against the U.S dollar, AUD/USD ascend 0.47 to 0.71540, and NZD/USD higher 0.21% to 0.65750 level.
EUR/USD Intraday: Major Support Level at 1.06560
Our pivot point is at 1.06560
Preferable Price Action: Take Sell positions below pivot level with targets at 1.05250 & 1.04330 in extension.
Alternative Price Action: Above pivot looks for a further upside to 1.07710 & 1.08590.
Comment: RSI below 50 levels and Pair below its 20MA & 55MA.
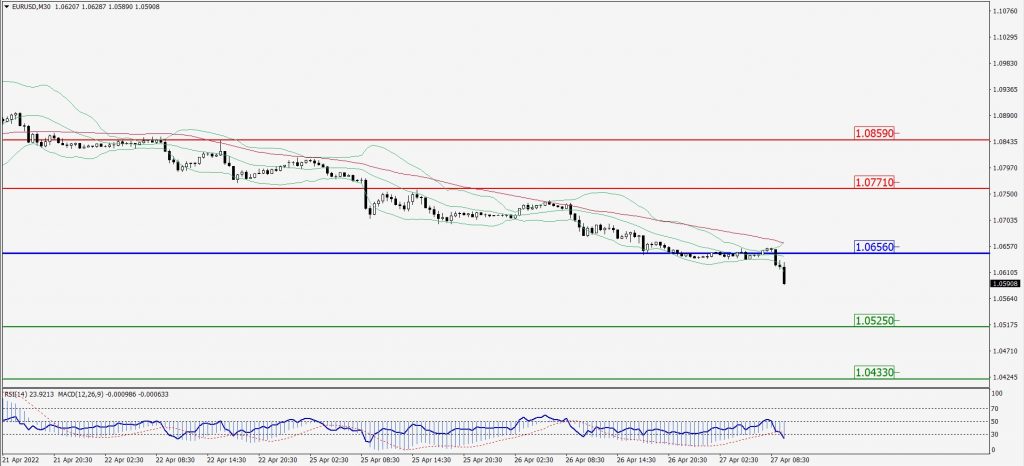
Green Lines Indicate Resistance Levels – Red Lines Indicate Support Levels
Light Blue is a Pivot Point – Black represents the price when the report was produced
GBP/USD Intraday: Trend on The Downside
Our pivot point is at 1.26440
Preferable Price Action: Sell positions below pivot with targets at 1.23820 & 1.21920 in extension.
Alternative Price Action: The price above pivot would call for further upside to 1.28960 & 1.31050.
Comment: RSI below 50 levels and Pair below its 20MA & 55MA.
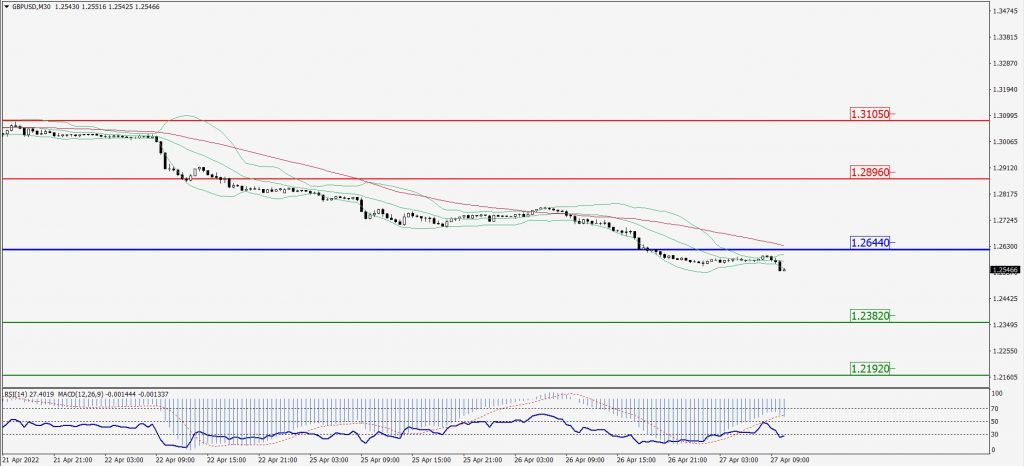
Green Lines Indicate Resistance Levels – Red Lines Indicate Support Levels
Light Blue is a Pivot Point – Black represents the price when the report was produced
USD/JPY Intraday: In a Consolidation Zone
Our pivot point is at 127.620
Preferable Price Action: Buy position above pivot with the target at 128.890 and 129.860 in extension.
Alternative Price Action: The downside breakout of the pivot would call for 126.490 and 125.650.
Comment: MACD in positive territory and Pair above its 20MA & 55MA.
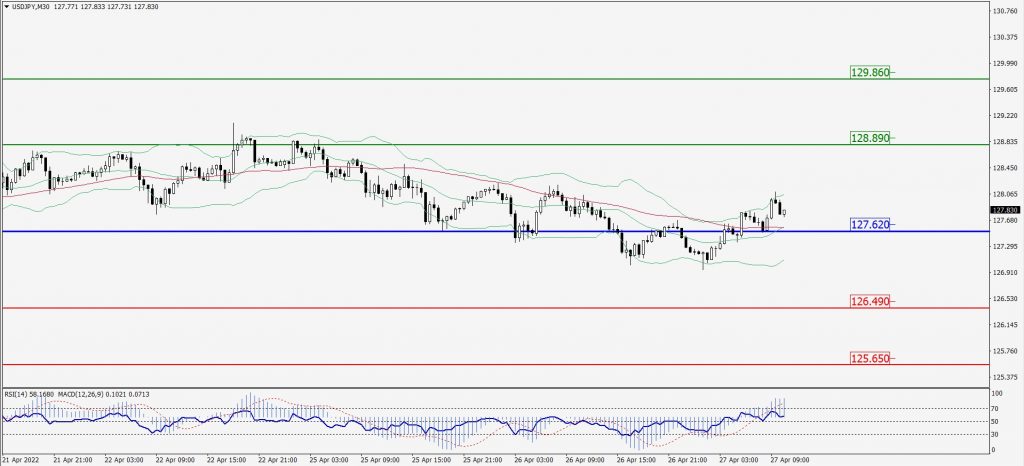
Green Lines Indicate Resistance Levels – Red Lines Indicate Support Levels
Light Blue is a Pivot Point – Black represents the price when the report was produced
AUD/USD Intraday: In a Consolidation Zone
Our pivot point is at 0.72100
Preferable Price Action: Sell Positions below pivot with targets at 0.70430 & 0.69000 in extension.
Alternative Price Action: Above pivot looks for a further upside with 0.73780 & 0.75170 as targets.
Comment: RSI below 50 levels and Pair below 55MA.
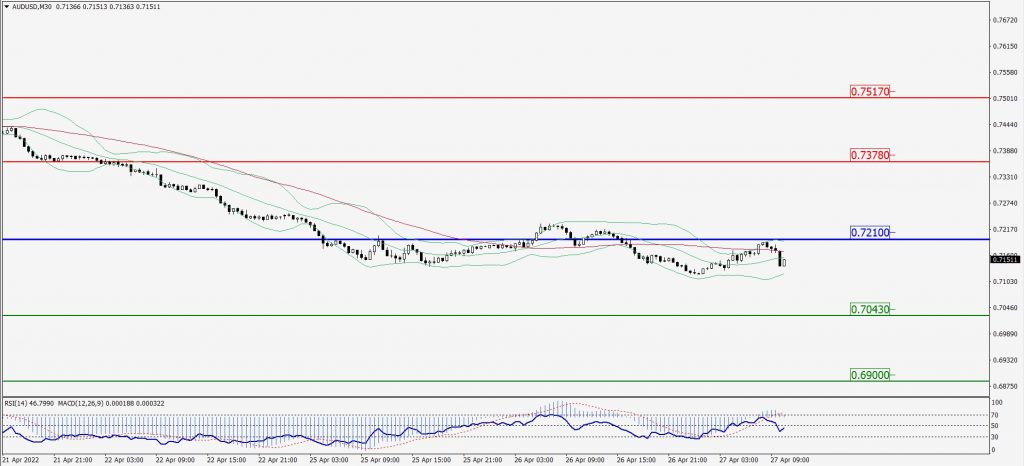
Green Lines Indicate Resistance Levels – Red Lines Indicate Support Levels
Light Blue is a Pivot Point – Black represents the price when the report was produced
CRUDEOIL Intraday: Trend on The Upside
Our pivot point is at 101.17
Preferable Price Action: Above pivots buy oil with 105.45 & 109.15 as targets.
Alternative Price Action: Sell crude below pivot with targets at 97.31 and 93.83 in extension.
Comment: MACD is in the positive territory and Pair above 55MA.
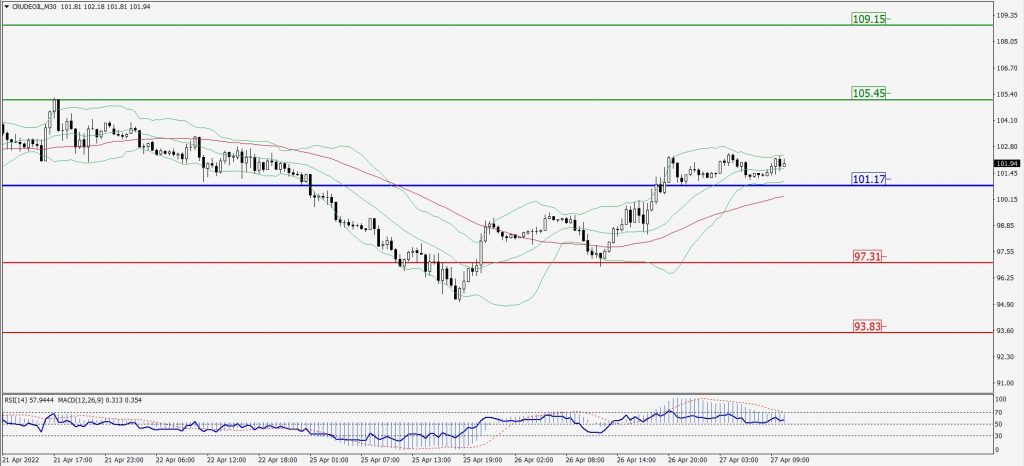
Green Lines Indicate Resistance Levels – Red Lines Indicate Support Levels
Light Blue is a Pivot Point – Black represents the price when the report was produced
XAU/USD Intraday: Major Resistance Level at 1910.20
Our pivot point is 1910.20
Preferable Price Action: Further downside to 1880.60 and 1860.00.
Alternative Price Action: If the price gives an upside breakout of a pivot, then the price extends to 1937.30 and 1958.20.
Comment: MACD is flat territory.
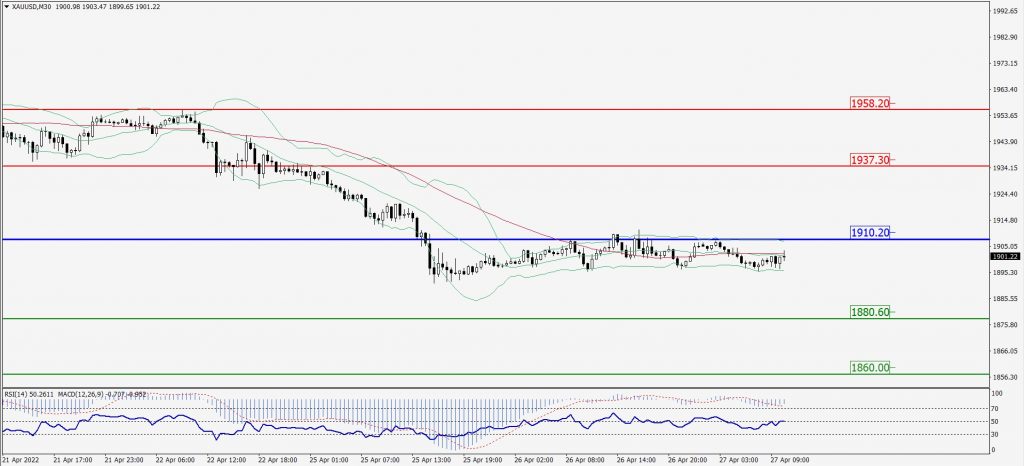
Green Lines Indicate Resistance Levels – Red Lines Indicate Support Levels
Light Blue is a Pivot Point – Black represents the price when the report was produced
Dow Jones Intraday: In a Consolidation Zone
Our pivot point is 33,893.00
Preferable Price Action: Take sell positions below pivot with targets at 32,692.00 & 31,830.00.
Alternative Price Action: Above 33,893.00 looks for further upside to 34,989.00 & 35,851.00.
Comment: RSI at 50 levels and pair below 55MA.
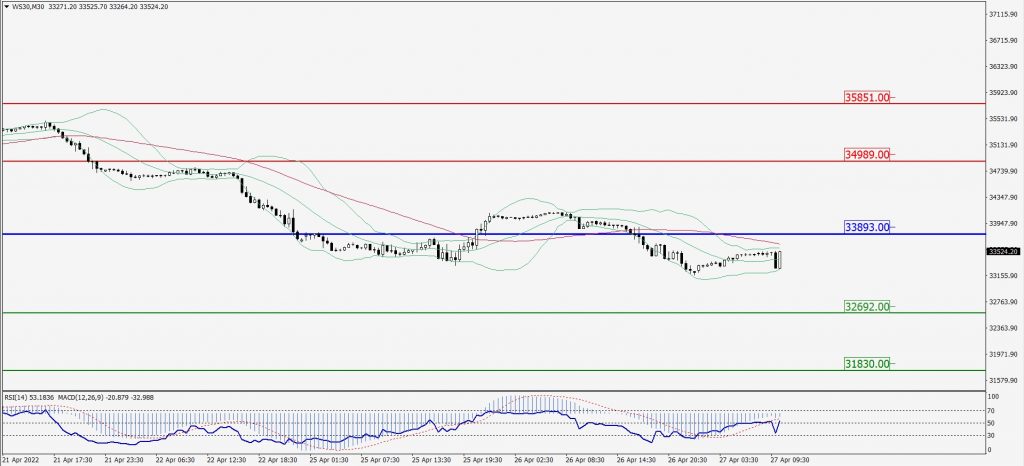
Green Lines Indicate Resistance Levels – Red Lines Indicate Support Levels
Light Blue is a Pivot Point – Black represents the price when the report was produced