Market Wrap: Stocks, Bonds, Commodities
Wall Street stocks finished lower while bond yields and the dollar rose on Thursday as investors worried about the potential for aggressive US policy tightening as other central banks around the world moved to reduce support.
The S&P 500 lose (1.21%) ended at 4,392.59 points, while the Nasdaq Composite down 2.14% to 13,351.08. The Dow Jones Industrial was fell 0.33% to 34,451.23.
MSCI’s index of Asia-Pacific stocks outside Japan is drop 0.76% to 698.78 levels. Australian index higher 0.59% to 7,523.40. Japanese Nikkei Index surge 1.08% to 26,799.71.
European stocks were positive on Monday, with the Stoxx Europe 50 Index gain 0.54% to 3,848.68 Germany’s DAX ascend 0.62% to 14,163.85, and France’s CAC up 0.72% to 6,589.35, and U.K.’s FTSE 100 increase 0.47% to 7,616.38.
Benchmark 10-year U.S. Treasury fell as demand for safe assets ascend again, today 10-year bond yields a positive 2.860.
Oil prices rose on Monday as concerns grew about tighter global supply, with the deepening crisis in Ukraine raising the prospect of heavier sanctions by the West on top exporter Russia.
Spot Brent crude oil fell 0.83% to $110.78 per barrel. US West Texas Intermediate crude is down 0.80% to $105.62 a barrel.
The yellow metal gold is advance 0.95% to 1,993.70 dollars per ounce.
Market Wrap: Forex
The yen won a brief reprieve after hitting fresh two-decade lows from Japanese policymaker comments on Monday, even as holidays confined the U.S. dollar to narrow ranges against most other currencies.
Today, the U.S. dollar index measures the Greenback against a trade-weighted basket of six major currencies, which is an increase of 0.38% to 100.710.
The Euro US Dollar (EUR/USD) is a widely traded pair that is negative today. This left the pair trading around $1.07920.
The Japanese yen was positive against the U.S. dollar on Monday as the stock up. Today USD/JPY is rose 0.24% to 126.660 level.
Another commodity-related currency negative against the U.S dollar, AUD/USD down 0.41% to 0.73670, and NZD/USD lower 0.50% to 0.67340 level.
EUR/USD Intraday: Trend on The Downside
Our pivot point is at 1.08170
Preferable Price Action: Take Sell positions below pivot level with targets at 1.07750 & 1.07410 in extension.
Alternative Price Action: Above pivot looks for a further upside to 1.08510 & 1.08780.
Comment: RSI below 50 levels and Pair below its 20MA & 50MA.
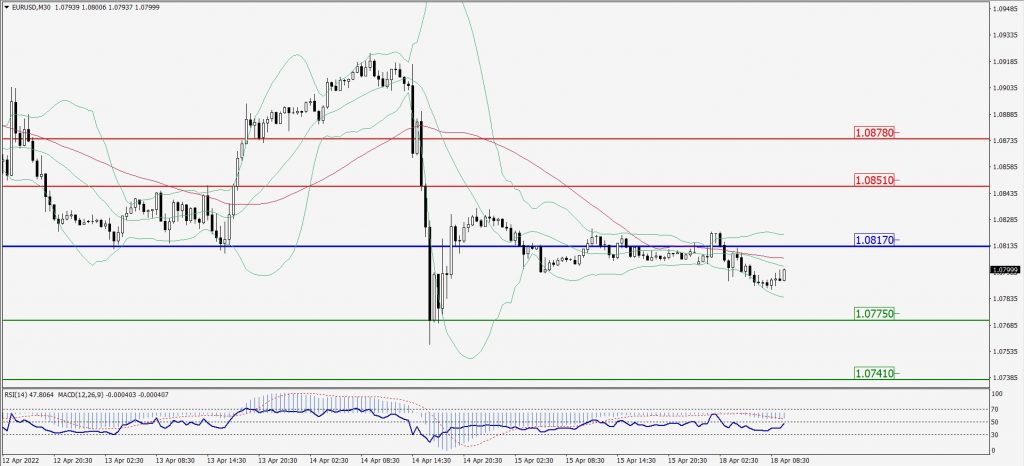
Green Lines Indicate Resistance Levels – Red Lines Indicates Support Levels
Light Blue is a Pivot Point – Black represents the price when the report was produced
GBP/USD Intraday: Trend on The Downside
Our pivot point is at 1.30460
Preferable Price Action: Sell positions below pivot with targets at 1.29920 & 1.29520 in extension.
Alternative Price Action: The price above pivot would call for further upside to 1.30980 & 1.31350.
Comment: RSI below 50 levels and Pair below its 20MA & 55MA.
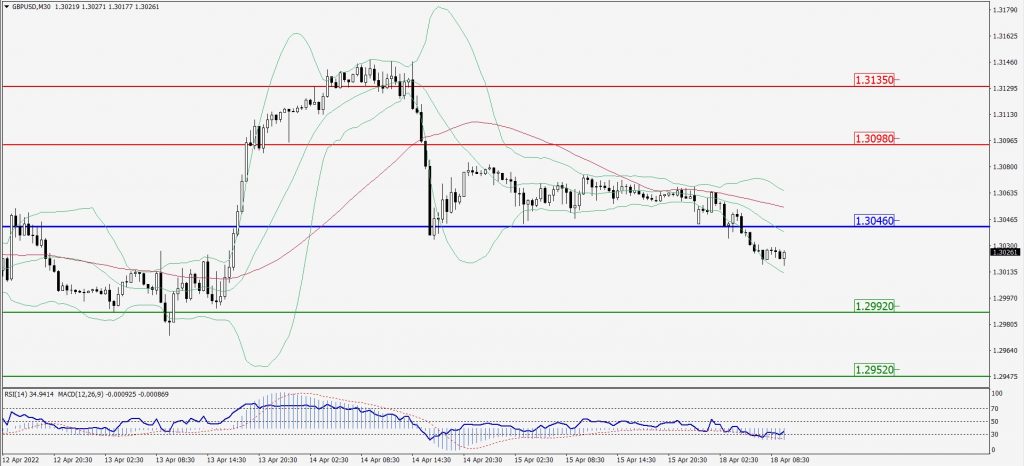
Green Lines Indicate Resistance Levels – Red Lines Indicates Support Levels
Light Blue is a Pivot Point – Black represents the price when the report was produced
USD/JPY Intraday: Major Trend on The Upside
Our pivot point is at 126.330
Preferable Price Action: Buy position above pivot with the target at 127.130 and 127.570 in extension.
Alternative Price Action: The downside breakout of the pivot would call for 125.700 and 125.300.
Comment: MACD in positive territory and Pair above 55MA.
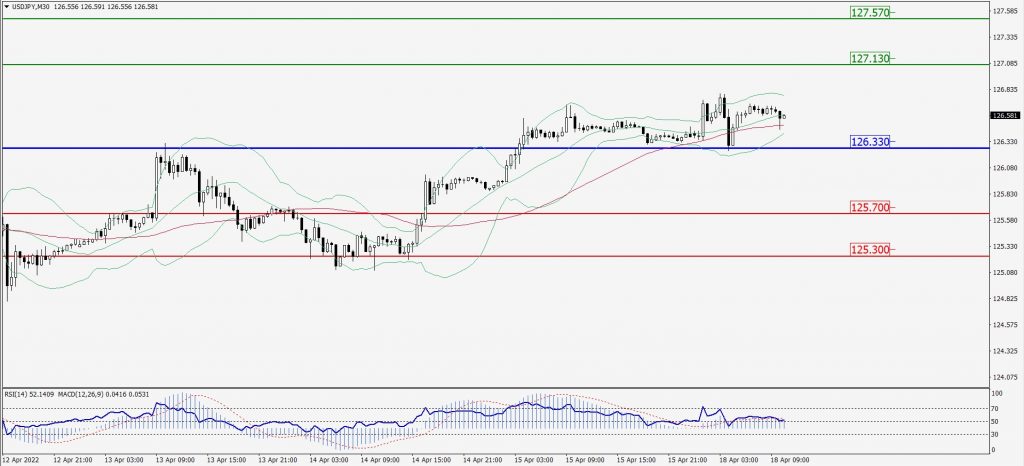
Green Lines Indicate Resistance Levels – Red Lines Indicates Support Levels
Light Blue is a Pivot Point – Black represents the price when the report was produced
AUD/USD Intraday: In a Consolidation Zone
Our pivot point is at 0.73870
Preferable Price Action: Sell Positions below pivot with targets at 0.73210 & 0.72720 in extension.
Alternative Price Action: Above pivot looks for a further upside with 0.74470 & 0.74900 as targets.
Comment: RSI below 50 levels and Pair below its 20MA & 55MA.
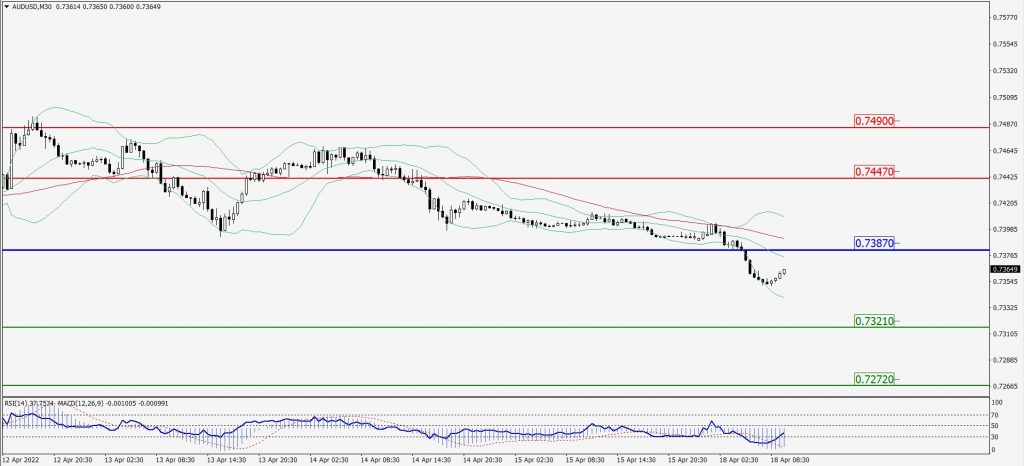
Green Lines Indicate Resistance Levels – Red Lines Indicates Support Levels
Light Blue is a Pivot Point – Black represents the price when the report was produced
CRUDEOIL Intraday: May Trend Reverse from 107.67
Our pivot point is at 107.67
Preferable Price Action: Below pivots sell oil with 103.67 & 100.83 as targets.
Alternative Price Action: Buy crude above pivot with targets at 111.22 and 114.14 in extension.
Comment: MACD is in the negative territory and Pair below 20MA.
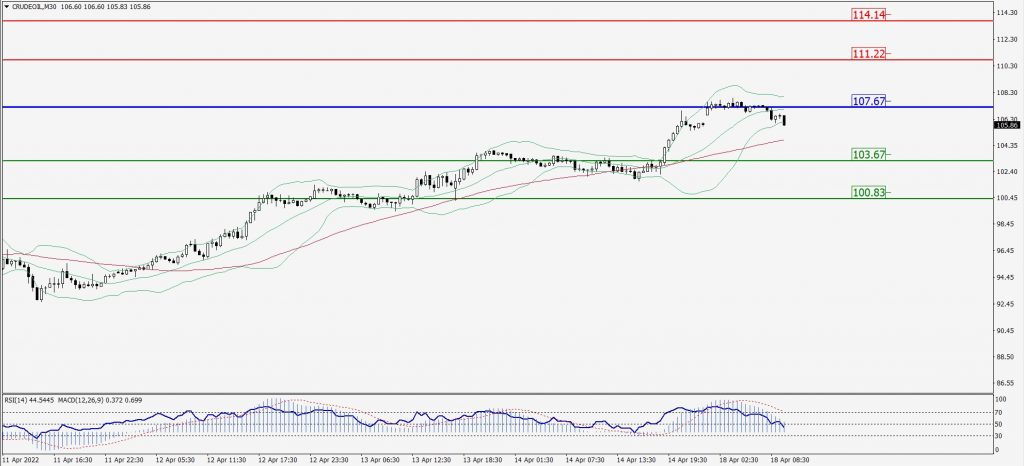
Green Lines Indicate Resistance Levels – Red Lines Indicates Support Levels
Light Blue is a Pivot Point – Black represents the price when the report was produced
XAU/USD Intraday: Support Level at 1985.70
Our pivot point is 1985.70
Preferable Price Action: Further upside to 2005.20 and 2021.20.
Alternative Price Action: If the price gives a downside breakout of a pivot, then the price extends to 1968.10 and 1952.60.
Comment: MACD is a positive territory and Pair above its 20MA & 55MA.
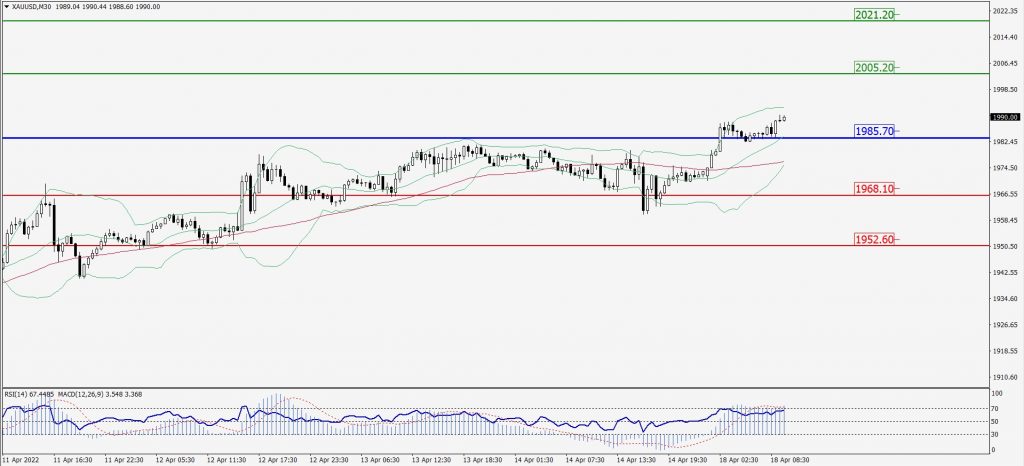
Green Lines Indicate Resistance Levels – Red Lines Indicates Support Levels
Light Blue is a Pivot Point – Black represents the price when the report was produced
Dow Jones Intraday: In a Consolidation Zone
Our pivot point is 34,466.00
Preferable Price Action: Take Sell positions below pivot with targets at 34,252.00 & 34,094.00.
Alternative Price Action: Above 34,466.00 looks for further upside to 34,632.00 & 34,771.00.
Comment: RSI below 50 levels and pair below 55MA.
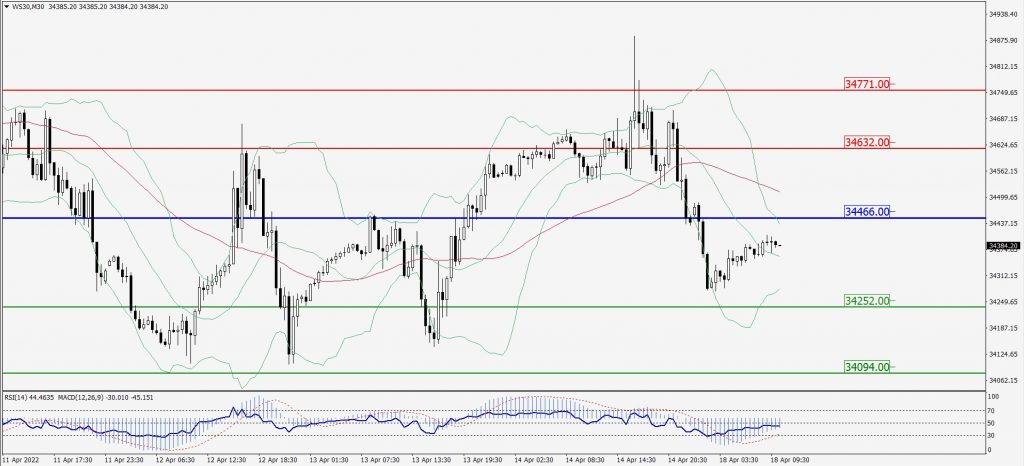
Green Lines Indicate Resistance Levels – Red Lines Indicates Support Levels
Light Blue is a Pivot Point – Black represents the price when the report was produced