Market Wrap: Stocks, Bonds, Commodities
The S&P 500 ended higher on Friday, with Pfizer and Tesla fueling a late-session rally while investors eyed the war in Ukraine and a potentially more aggressive Federal Reserve. Tesla Inc rose 1.2 percent and Microsoft Corp added 0.6 percent, helping lift the S&P 500 and provide the Nasdaq a modest gain.
The S&P 500 gain(0.43%) ended at 4,500.21 points, while the Nasdaq Composite up 0.06% to 13,897.30. The Dow Jones Industrial was rose 0.25% to 34,583.57.
MSCI’s index of Asia-Pacific stocks outside Japan is drop 0.02% to 713.53 levels. Australian index higher 0.47% to 7,478.00. Japanese Nikkei Index surge 0.36% to 26,985.80.
European stocks were Positive on Friday, with the Stoxx Europe 50 Index gain 1.79% to 3,869.95 Germany’s DAX ascend 1.69% to 14,314.45, and France’s CAC up 1.81% to 6,578.81, and U.K.’s FTSE 100 increase 1.13% to 7,640.26.
Benchmark 10-year U.S. Treasury fell as demand for safe assets ascend again, today 10-year bond yields a positive 2.655.
Oil settled lower on April 7, adding to weekly losses on the uncertainty that the eurozone will be able to effectively sanction Russian energy exports and after consuming nations announced a huge release of oil from emergency reserves.
Spot Brent crude oil gain 0.64% to $101.20 per barrel. US West Texas Intermediate crude up 0.81% to $96.83 a barrel.
The yellow metal gold is decline 0.28% to 1,932.30 dollars per ounce.
Market Wrap: Forex
The U.S. dollar edged higher in early European trade Friday, trading at a two-year high and underpinned by the likelihood of sharp rises in interest rates by the Federal Reserve.
Today, the U.S. dollar index measures the Greenback against a trade-weighted basket of six major currencies, which is an increase of 0.12% to 99.870.
The Euro US Dollar (EUR/USD) is a widely traded pair that is negative today. This left the pair trading around $1.08640.
The Japanese yen was positive against the U.S. dollar on Friday as the stock up. Today USD/JPY is rose 0.08% to 124.030 level.
Another commodity-related currency negative against the U.S dollar, AUD/USD down 0.24% to 0.74600, and NZD/USD lower 0.42% to 0.68600 level.
EUR/USD Intraday: Trend on The Downside
Our pivot point is at 1.08820
Preferable Price Action: Take Short positions below pivot level with targets at 1.08240 & 1.07840 in extension.
Alternative Price Action: Above pivot looks for a further upside to 1.09260 & 1.09670.
Comment: RSI below 50 levels and Pair below its 20MA & 55MA.
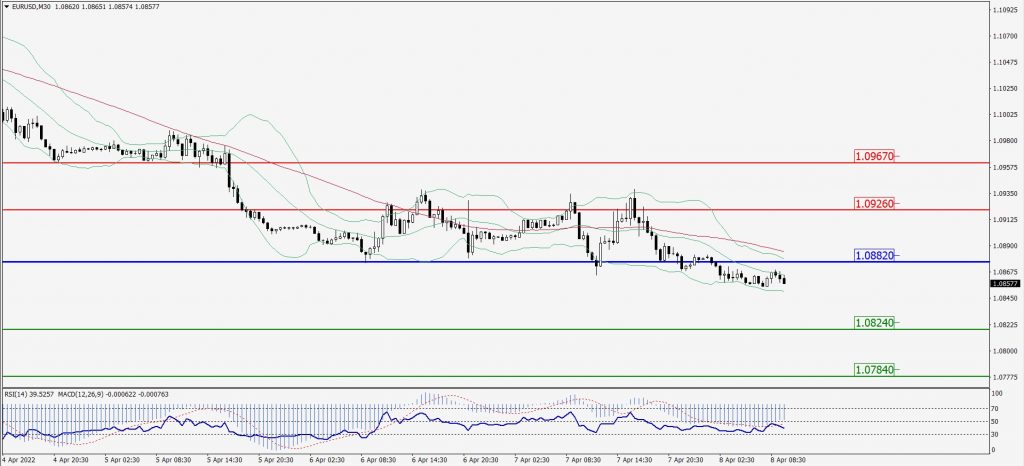
Green Lines Indicate Resistance Levels – Red Lines Indicates Support Levels
Light Blue is a Pivot Point – Black represents the price when the report was produced
GBP/USD Intraday: Major Support Levet at 1.30650
Our pivot point is at 1.30650
Preferable Price Action: Sell positions below pivot with targets at 1.30090 & 1.29620 in extension.
Alternative Price Action: The price above pivot would call for further upside to 1.31230 & 1.31740.
Comment: RSI below 50 levels and Pair below its 20MA & 55MA.
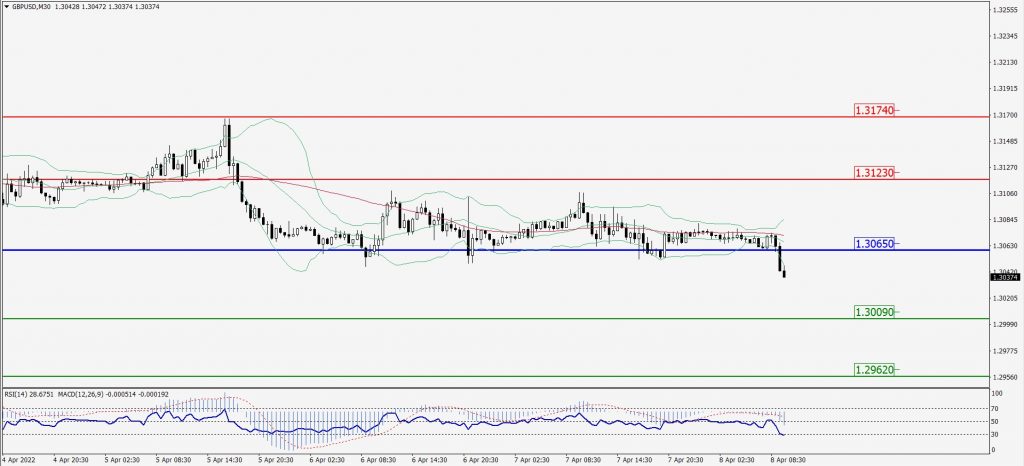
Green Lines Indicate Resistance Levels – Red Lines Indicates Support Levels
Light Blue is a Pivot Point – Black represents the price when the report was produced
USD/JPY Intraday: Trend on The Upside
Our pivot point is at 123.870
Preferable Price Action: Buy position above pivot with the target at 124.650 and 125.400 in extension.
Alternative Price Action: The downside breakout of the pivot would call for 123.040 and 122.300.
Comment: MACD in positive territory and Pair above its 20MA & 55MA.
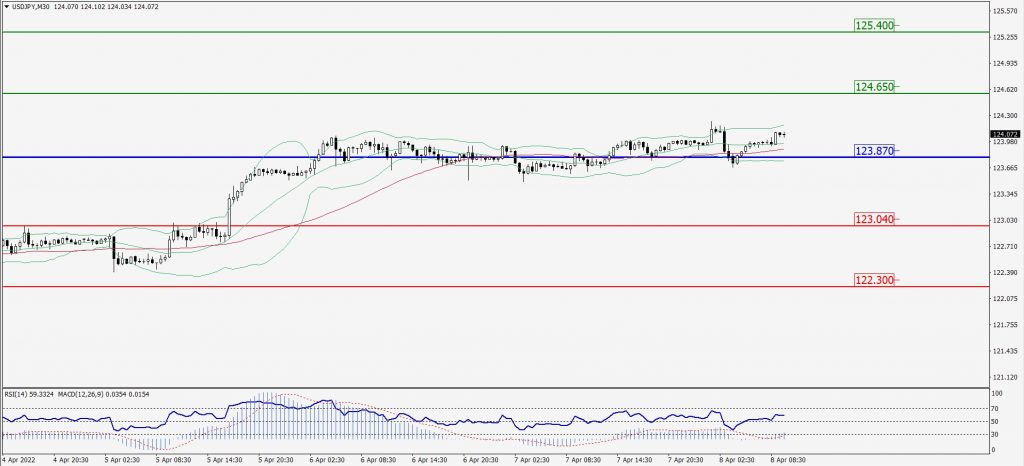
Green Lines Indicate Resistance Levels – Red Lines Indicates Support Levels
Light Blue is a Pivot Point – Black represents the price when the report was produced
AUD/USD Intraday: Trend on The Downside
Our pivot point is at 0.75130
Preferable Price Action: Sell Positions below pivot with targets at 0.73900 & 0.73050 in extension.
Alternative Price Action: Above pivot looks for a further upside with 0.76340 & 0.77310 as targets.
Comment: RSI below 50 levels and Pair below its 20 MA & 55MA.
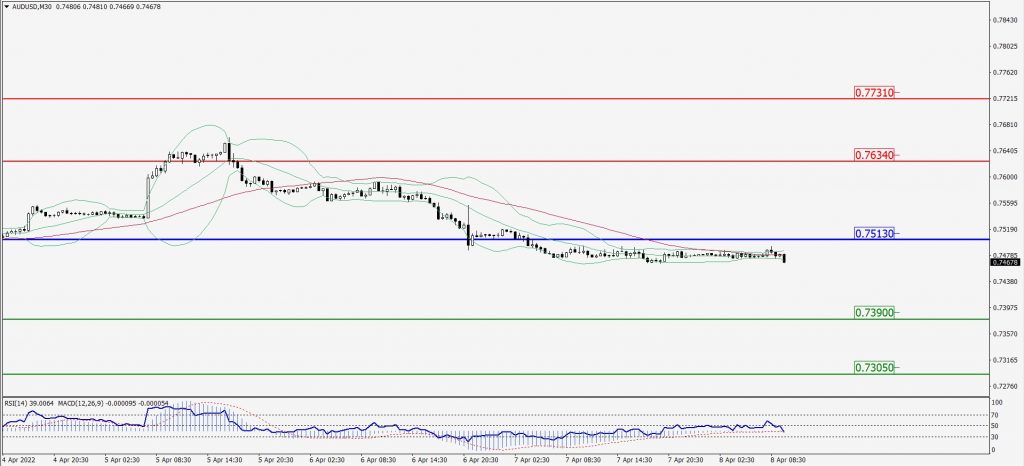
Green Lines Indicate Resistance Levels – Red Lines Indicates Support Levels
Light Blue is a Pivot Point – Black represents the price when the report was produced
CRUDEOIL Intraday: In a Consolidation Zone
Our pivot point is at 95.27
Preferable Price Action: Above pivots Buy oil with 98.71 & 101.29 as targets.
Alternative Price Action: Sell crude below pivot with targets at 92.26 and 89.95 in extension.
Comment: MACD is in the Flat territory and Pair above 20MA.
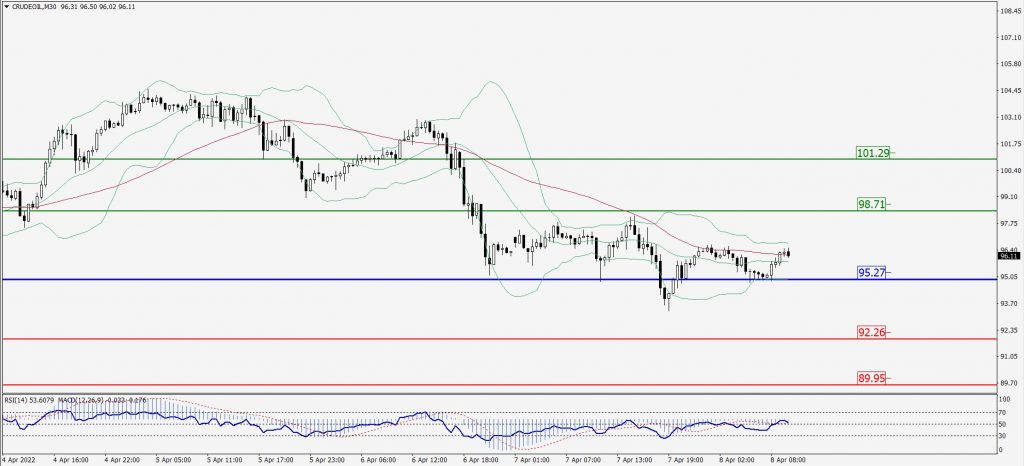
Green Lines Indicate Resistance Levels – Red Lines Indicates Support Levels
Light Blue is a Pivot Point – Black represents the price when the report was produced
XAU/USD Intraday: In a Consolidation Zone
Our pivot point is 1929.40
Preferable Price Action: Further upside to 1937.00 and 1942.60.
Alternative Price Action: If the price gives a downside breakout of a pivot, then the price extends to 1923.00 and 1917.70.
Comment: MACD is a flat territory and Pair above 55MA.
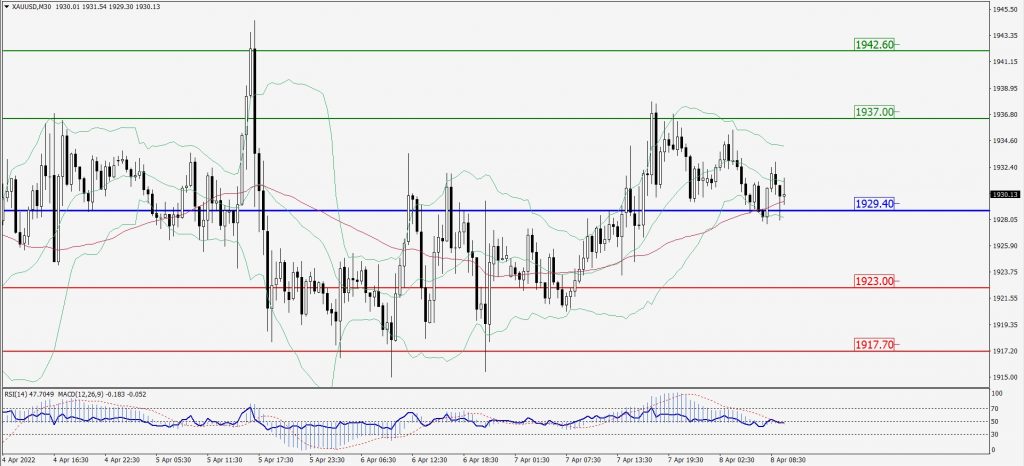
Green Lines Indicate Resistance Levels – Red Lines Indicates Support Levels
Light Blue is a Pivot Point – Black represents the price when the report was produced
Dow Jones Intraday: Trend on The Upside
Our pivot point is 34,566.00
Preferable Price Action: Take Buy positions above pivot with targets at 34,857.00 & 35,026.00.
Alternative Price Action: Below 34,566.00 looks for further downside to 34,305.00 & 34,142.00.
Comment: RSI above 50 levels and pair above its 20MA & 55MA.
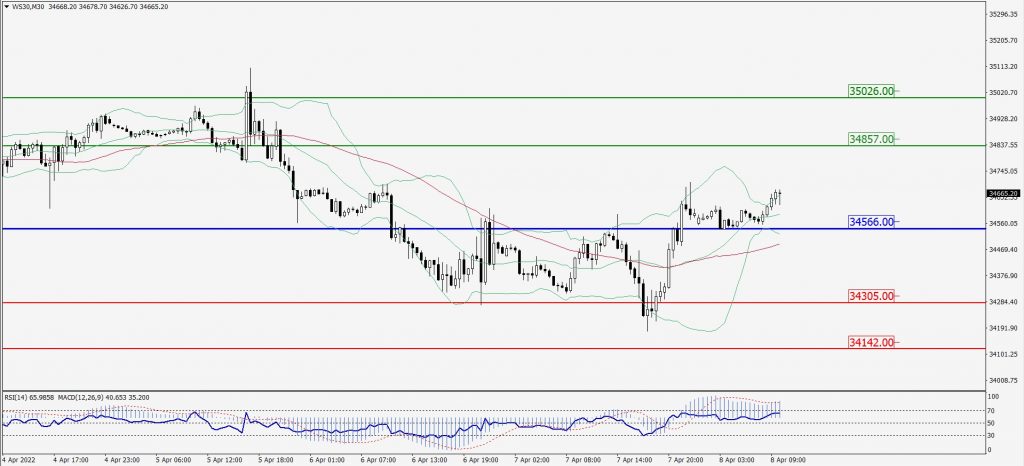
Green Lines Indicate Resistance Levels – Red Lines Indicates Support Levels
Light Blue is a Pivot Point – Black represents the price when the report was produced