Market Wrap: Stocks, Bonds, Commodities
The S&P 500 rose for a third day on Monday, as a sharp climb in shares of Tesla overshadowed weakness in energy and bank stocks, while Russia and Ukraine were poised to hold their first face-to-face peace talks in more than two weeks.
The S&P 500 gain (1.23%) ended at 4,631.60 points, while the Nasdaq Composite up 1.84% to 14,619.64. The Dow Jones Industrial was rose 0.97% to 35,294.19.
MSCI’s index of Asia-Pacific stocks outside Japan is ascend 1.47% to 731.37 levels. Australian index higher 0.67% to 7,514.50. Japanese Nikkei Index slipped 0.80% to 28,027.25.
European stocks were Positive on Wednesday, with the Stoxx Europe 50 Index lose 0.94% to 3,964.45 Germany’s DAX drop 1.27% to 14,627.67, and France’s CAC down 0.99% to 6,723.66, and U.K.’s FTSE 100 increase 0.04% to 7,538.70.
Benchmark 10-year U.S. Treasury fell as demand for safe assets ascend again, today 10-year bond yields a negative 2.380.
Oil prices climbed on Wednesday, erasing losses from the previous session, on hopes of progress in peace talks between Russia and Ukraine and providing a fresh reminder supply remains tight as data showed US crude stocks fell sharply last week.
Spot Brent crude oil gain 1.37% to $109.10 per barrel. US West Texas Intermediate crude up 1.58% to $105.92 a barrel.
The yellow metal gold is advance 0.50% to 1,921.65 dollars per ounce.
Market Wrap: Forex
The dollar fell and the euro gained on Wednesday as markets took a positive view on peace talks in Ukraine, while the Japanese yen recovered from seven-year lows as traders speculated that officials were uncomfortable with its recent weakness.
Today, the U.S. dollar index measures the Greenback against a trade-weighted basket of six major currencies, which is a decrease of 0.40% to 98.040.
The Euro US Dollar (EUR/USD) is a widely traded pair that is positive today. This left the pair trading around $1.11270.
The Japanese yen was positive against the U.S. dollar on Wednesday as the stock up. Today USD/JPY is fell 0.92% to 121.720 level.
Another commodity-related currency positive against the U.S dollar, AUD/USD up 0.16% to 0.75180, and NZD/USD higher 0.43% to 0.6930 level.
EUR/USD Intraday: Trend on The Upside
Our pivot point is at 1.11000
Preferable Price Action: Take Long positions above pivot level with targets at 1.11530 & 1.11930 in extension.
Alternative Price Action: Below pivot looks for a further downside to 1.10550 & 1.10100.
Comment: RSI above 50 levels and Pair above its 20MA & 55MA.
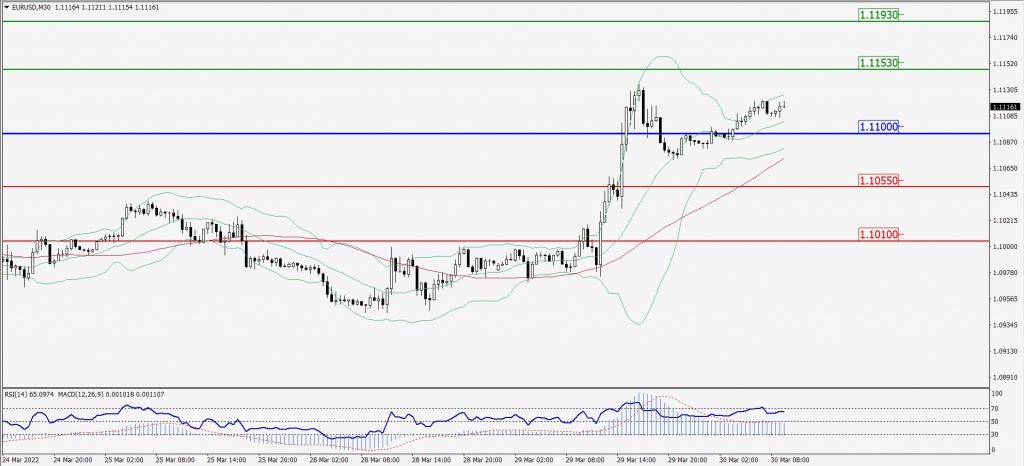
Green Lines Indicate Resistance Levels – Red Lines Indicates Support Levels
Light Blue is a Pivot Point – Black represents the price when the report was produced
GBP/USD Intraday: May Trend Reverse from 1.31160
Our pivot point is at 1.31160
Preferable Price Action: Buy positions above pivot with targets at 1.31570 & 1.31930 in extension.
Alternative Price Action: The price below pivot would call for further downside to 1.30760 & 1.30430.
Comment: RSI above 50 levels and Pair above its 20MA & 55MA.
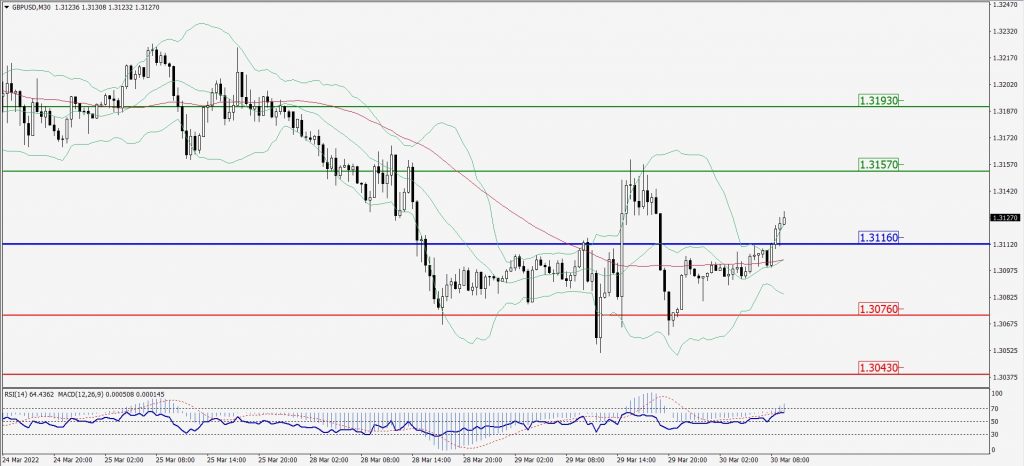
Green Lines Indicate Resistance Levels – Red Lines Indicates Support Levels
Light Blue is a Pivot Point – Black represents the price when the report was produced
USD/JPY Intraday: Trend on The Downside
Our pivot point is at 122.330
Preferable Price Action: Sell position below pivot with the target at 121.150 and 120.210 in extension.
Alternative Price Action: The upside breakout of the pivot would call for 123.520 and 124.510.
Comment: MACD in negative territory and Pair below its 20MA & 55MA.
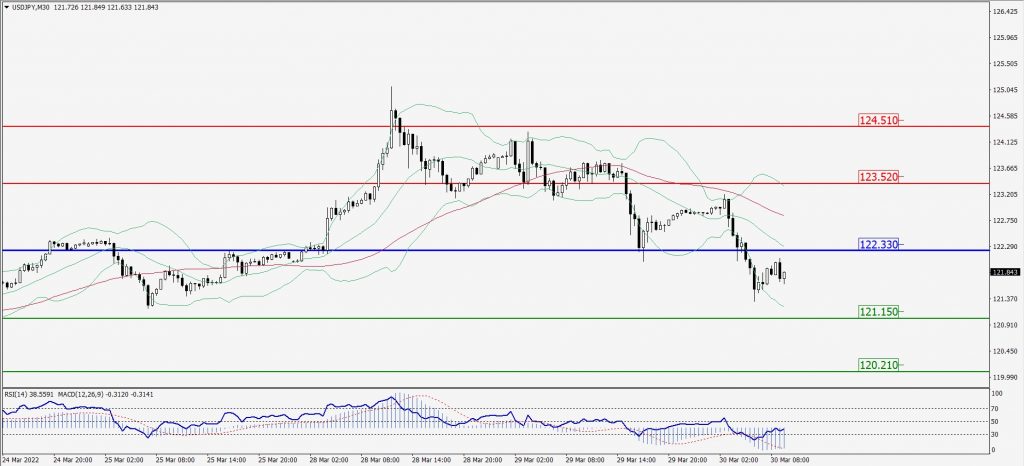
Green Lines Indicate Resistance Levels – Red Lines Indicates Support Levels
Light Blue is a Pivot Point – Black represents the price when the report was produced
AUD/USD Intraday: Major Support Level at 0.75220
Our pivot point is at 0.75220
Preferable Price Action: Buy Positions above pivot with targets at 0.75550 & 0.75760 in extension.
Alternative Price Action: Below pivot looks for a further downside with 0.74920 & 0.74680 as targets.
Comment: RSI above 50 levels and Pair above its 20MA & 55MA.
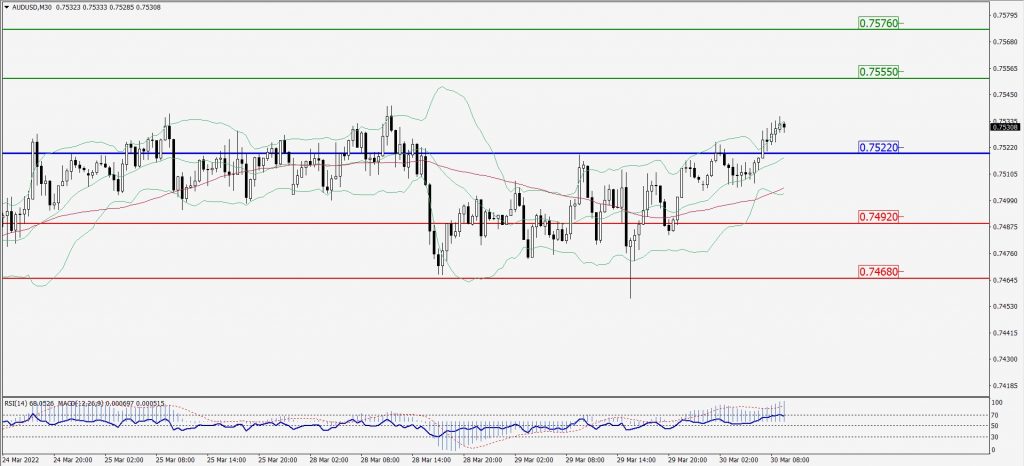
Green Lines Indicate Resistance Levels – Red Lines Indicates Support Levels
Light Blue is a Pivot Point – Black represents the price when the report was produced
CRUDEOIL Intraday: In a Consolidation Zone
Our pivot point is at 104.25
Preferable Price Action: Above pivots Buy Oil with 108.33 & 111.97 as targets.
Alternative Price Action: Sell crude below pivot with targets at 100.84 and 97.67 in extension.
Comment: MACD is in the positive territory and Pair above its 20MA & 55MA.
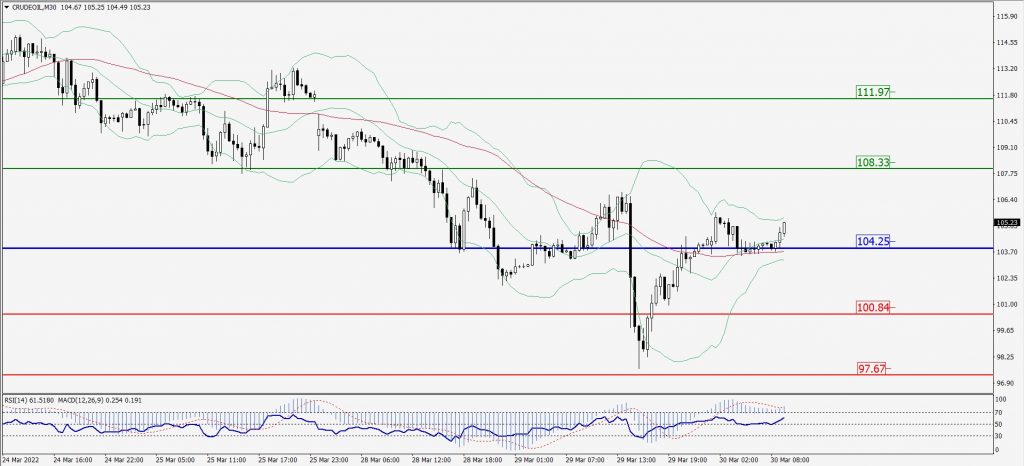
Green Lines Indicate Resistance Levels – Red Lines Indicates Support Levels
Light Blue is a Pivot Point – Black represents the price when the report was produced
XAU/USD Intraday: In a Consolidation Zone
Our pivot point is 1918.10
Preferable Price Action: Further upside to 1939.70 and 1953.70.
Alternative Price Action: If the price gives a downside breakout of a pivot, then the price extends to 1901.00 and 1888.00.
Comment: MACD is a positive territory and Pair above its 20MA & 55MA.
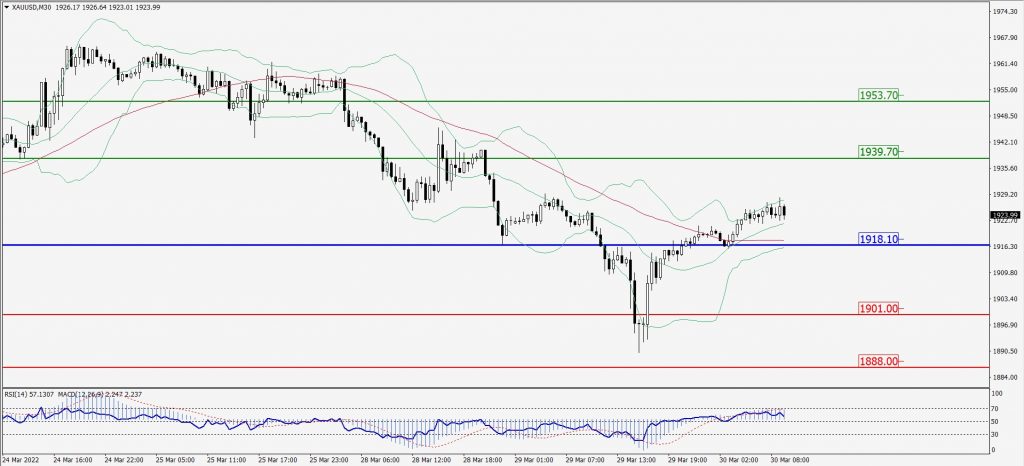
Green Lines Indicate Resistance Levels – Red Lines Indicates Support Levels
Light Blue is a Pivot Point – Black represents the price when the report was produced
Dow Jones Intraday: Trend on the Upside
Our pivot point is 35,168.00
Preferable Price Action: Take long positions above pivot with targets at 35,510.00 & 35,734.00.
Alternative Price Action: Below 35,168.00 looks for further downside to 34,862.00 & 34,626.00.
Comment: RSI above 50 levels and Pair above 55MA.
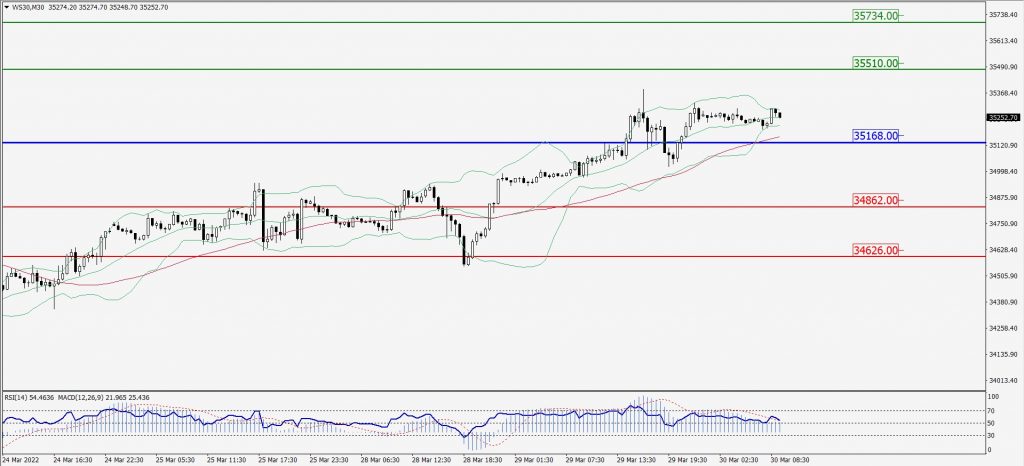
Green Lines Indicate Resistance Levels – Red Lines Indicates Support Levels
Light Blue is a Pivot Point – Black represents the price when the report was produced