Market Wrap: Stocks, Bonds, Commodities
The S&P 500 rose for a third day on Monday, as a sharp climb in shares of Tesla overshadowed weakness in energy and bank stocks, while Russia and Ukraine were poised to hold their first face-to-face peace talks in more than two weeks.
The S&P 500 gain (0.71%) ended at 4,575.52 points, while the Nasdaq Composite up 1.31% to 14,354.90. The Dow Jones Industrial was rose 0.27% to 34,955.89.
MSCI’s index of Asia-Pacific stocks outside Japan is ascend 0.66% to 719.06 levels. Australian index higher 0.70% to 7,464.30. Japanese Nikkei Index surge 1.10% to 28,252.42.
European stocks were Positive on Tuesday, with the Stoxx Europe 50 Index gain 1.49% to 3,944.45 Germany’s DAX ascend 1.16% to 14,583.36, and France’s CAC up 1.62% to 6,696.66, and U.K.’s FTSE 100 increase 0.90% to 7,539.30.
Benchmark 10-year U.S. Treasury fell as demand for safe assets ascend again, today 10-year bond yields a positive 2.496.
U.S. crude futures slid in early trade on Tuesday, extending losses from the previous session on the prospect of a sharp drop in fuel demand as Shanghai shut down to curb a surge in COVID cases and as Ukraine and Russia headed for peace talks.
Spot Brent crude oil gain 0.81% to $110.40 per barrel. US West Texas Intermediate crude up 0.72% to $106.67 a barrel.
The yellow metal gold is decline 1.02% to 1,919.95 dollars per ounce.
Market Wrap: Forex
The U.S. dollar edged lower Tuesday while the Japanese yen recovered a little from heavy selling as the Bank of Japan continued its dovish monetary policy stance.
Today, the U.S. dollar index measures the Greenback against a trade-weighted basket of six major currencies, which is a decrease of 0.05% to 99.000.
The Euro US Dollar (EUR/USD) is a widely traded pair that is positive today. This left the pair trading around $1.09990.
The Japanese yen was positive against the U.S. dollar on Tuesday as the stock up. Today USD/JPY is fell 0.37% to 123.450 level.
Another commodity-related currency mixed against the U.S dollar, AUD/USD up 0.17% to 0.74990, and NZD/USD lower 0.06% to 0.68900 level.
EUR/USD Intraday: Major Support Level at 1.09850
Our pivot point is at 1.09850
Preferable Price Action: Take Long positions above pivot level with targets at 1.10130 & 1.10360 in extension.
Alternative Price Action: Below pivot looks for a further downside to 1.09560 & 1.09320.
Comment: RSI above 50 levels and Pair above its 20MA & 55MA.
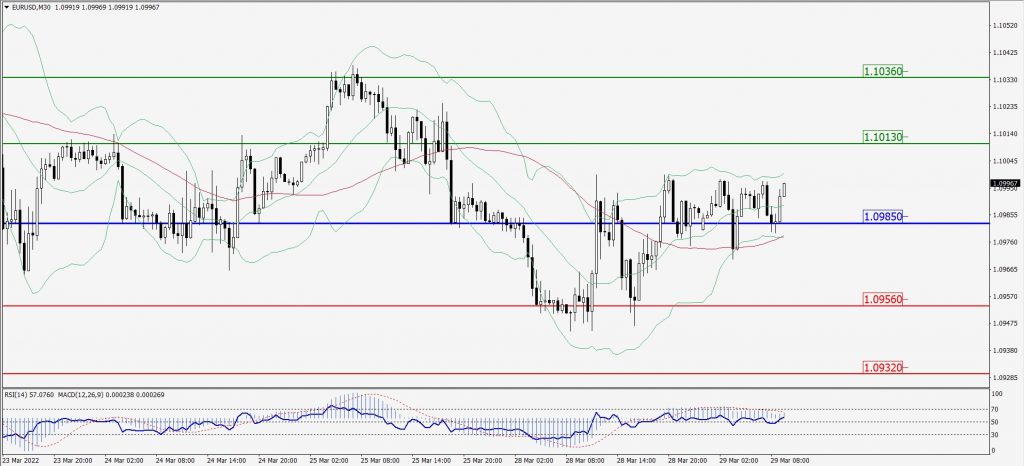
Green Lines Indicate Resistance Levels – Red Lines Indicates Support Levels
Light Blue is a Pivot Point – Black represents the price when the report was produced
GBP/USD Intraday: Trend on the Downside
Our pivot point is at 1.31250
Preferable Price Action: Sell positions below pivot with targets at 1.30750 & 1.30350 in extension.
Alternative Price Action: The price above pivot would call for further upside to 1.31760 & 1.32150.
Comment: RSI above 50 levels and Pair below 55MA.
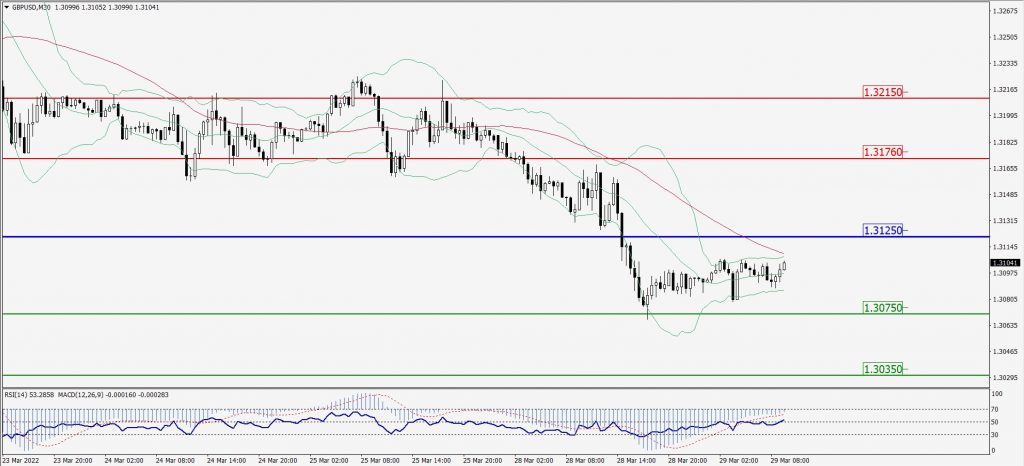
Green Lines Indicate Resistance Levels – Red Lines Indicates Support Levels
Light Blue is a Pivot Point – Black represents the price when the report was produced
USD/JPY Intraday: Trend May Reverse from 123.800
Our pivot point is at 123.800
Preferable Price Action: Sell position below pivot with the target at 122.800 and 121.900 in extension.
Alternative Price Action: The upside breakout of the pivot would call for 124.680 and 125.340.
Comment: MACD in negative territory and Pair below its 20MA & 55MA.
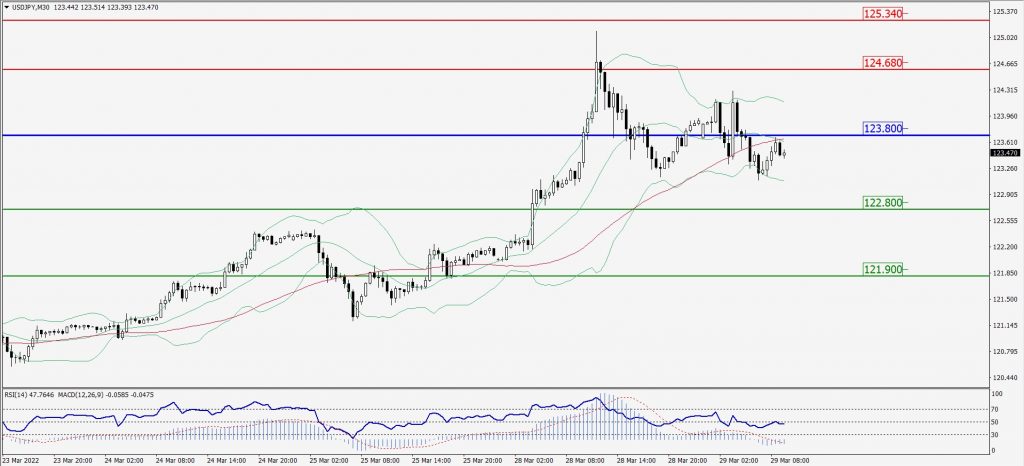
Green Lines Indicate Resistance Levels – Red Lines Indicates Support Levels
Light Blue is a Pivot Point – Black represents the price when the report was produced
AUD/USD Intraday: Major Support Level at 0.75010
Our pivot point is at 0.75010
Preferable Price Action: Buy Positions above pivot with targets at 0.75210 & 0.75390 in extension.
Alternative Price Action: Below pivot looks for a further downside with 0.74820 & 0.74650 as targets.
Comment: RSI above 50 levels and Pair above its 20MA & 55MA.
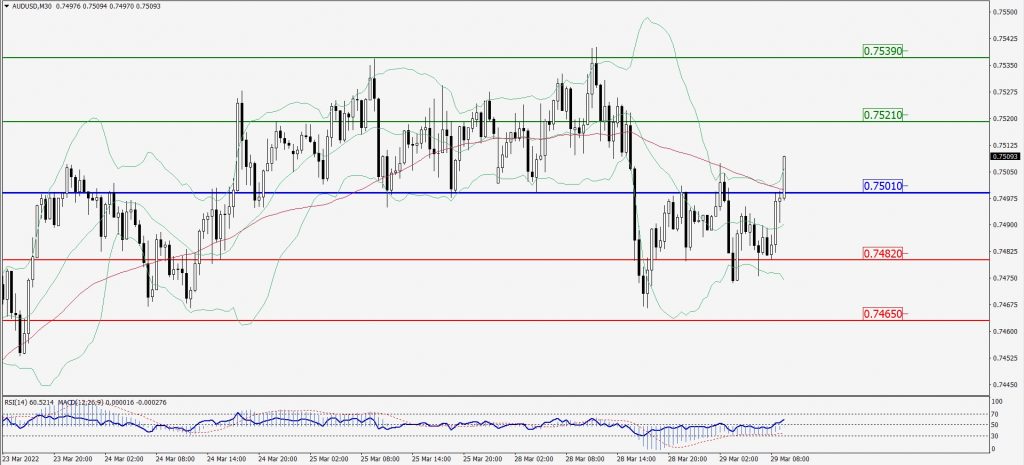
Green Lines Indicate Resistance Levels – Red Lines Indicates Support Levels
Light Blue is a Pivot Point – Black represents the price when the report was produced
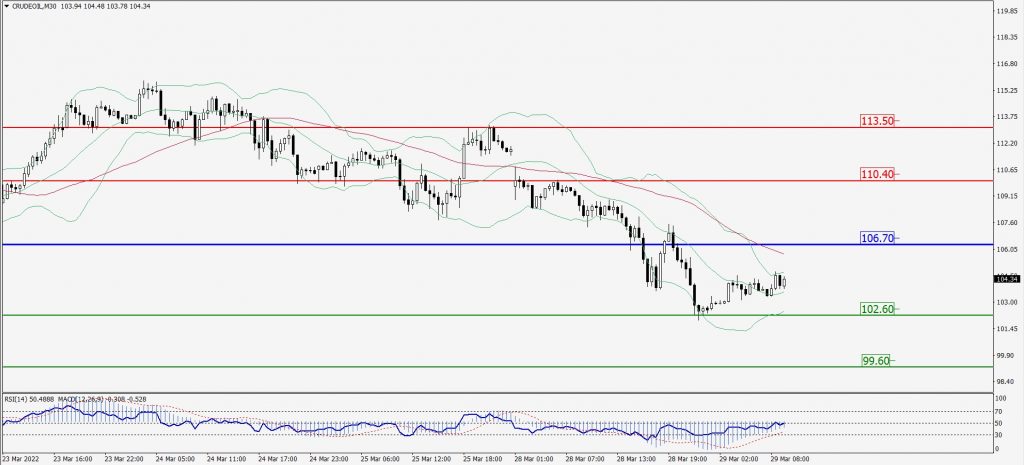
CRUDEOIL Intraday: Trend on the Downside
Our pivot point is at 106.70
Preferable Price Action: Below pivots Sell Oil with 102.60 & 99.60 as targets.
Alternative Price Action: Buy crude above pivot with targets at 110.40 and 113.50 in extension.
Comment: MACD is in the negative territory and Pair below 55MA.
Green Lines Indicate Resistance Levels – Red Lines Indicates Support Levels
Light Blue is a Pivot Point – Black represents the price when the report was produced
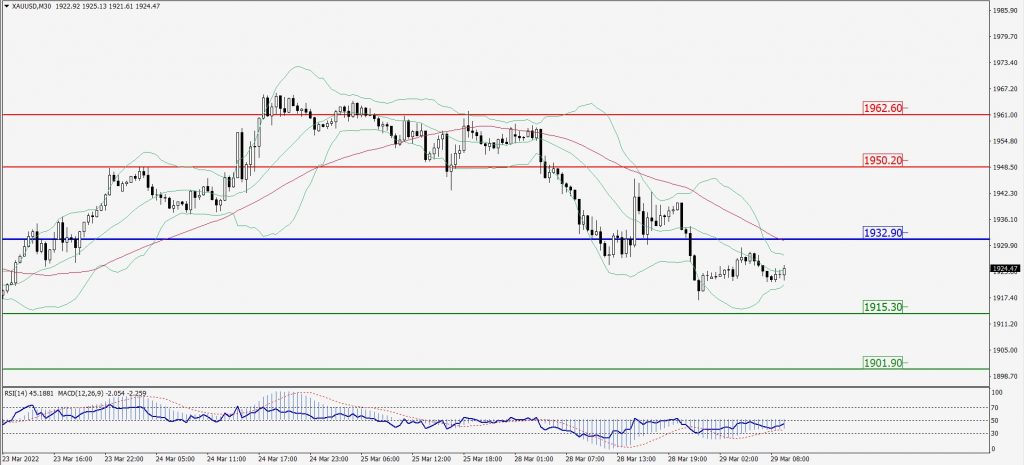
XAU/USD Intraday: Major Trend on the Downside
Our pivot point is 1932.90
Preferable Price Action: Further downside to 1915.30 and 1901.90.
Alternative Price Action: If the price gives an upside breakout of a pivot, then the price extends to 1950.20 and 1962.60.
Comment: MACD is a negative territory and Pair below 55MA.
Green Lines Indicate Resistance Levels – Red Lines Indicates Support Levels
Light Blue is a Pivot Point – Black represents the price when the report was produced
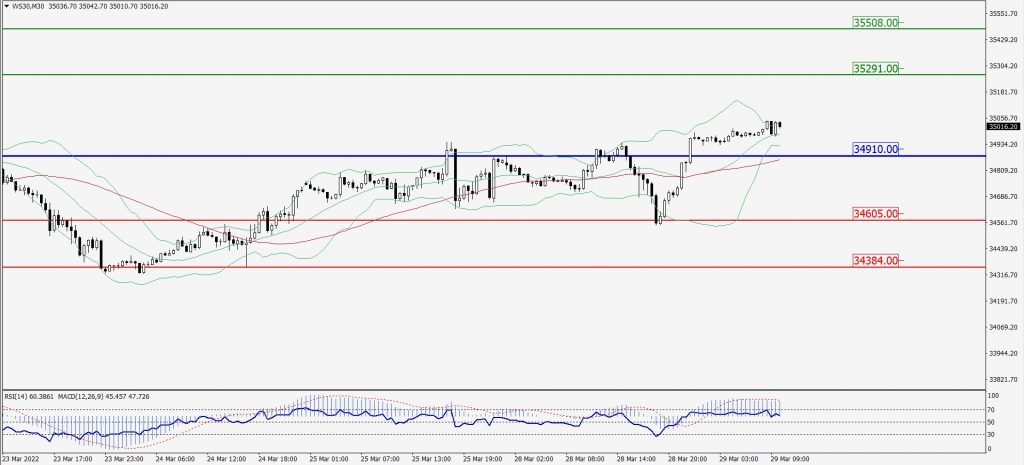
Dow Jones Intraday: Trend on the Upside
Our pivot point is 34,910.00
Preferable Price Action: Take long positions above pivot with targets at 35,291.00 & 35,508.00.
Alternative Price Action: Below 34,910.00 looks for further downside to 34,605.00 & 34,384.00.
Comment: RSI above 50 levels and Pair above its 20MA & 55MA.
Green Lines Indicate Resistance Levels – Red Lines Indicates Support Levels
Light Blue is a Pivot Point – Black represents the price when the report was produced