Market Wrap: Stocks, Bonds, Commodities
US stocks declined broadly while oil prices and Treasury yields pushed higher on Monday as investors refocused on risks from conflict in Ukraine and the US Federal Reserve’s actions on inflation.
The S&P 500 lose (0.04%) ended at 4,461.18 points, while the Nasdaq Composite down 0.40% to 13,838.46. The Dow Jones Industrial was fell 0.58% to 34,552.99.
MSCI’s index of Asia-Pacific stocks outside Japan is gain 1.11% to 719.15 levels. Australian index higher 0.86% to 7,341.10. Japanese Nikkei Index surge 1.48% to 27,224.11.
European stocks were Negative on Tuesday, with the Stoxx Europe 50 Index higher 0.41% to 3,898.75 Germany’s DAX ascend 0.53% to 14,397.04, and France’s CAC up 0.27% to 6,600.15, and U.K.’s FTSE 100 increase 0.25% to 7,455.60.
Benchmark 10-year U.S. Treasury fell as demand for safe assets dropped again, today 10-year bond yields a positive 2.322.
Oil surged for a fourth day, heading for the best run in a month, on signs the European Union may be edging closer to a ban on Russian crude imports to punish Moscow for its invasion of Ukraine.
Spot Brent crude oil gain 1.56% to $117.53 per barrel. US West Texas Intermediate crude up 1.64% to $111.77 a barrel.
The yellow metal gold is advance 0.27% to 1,934.90 dollars per ounce.
Market Wrap: Forex
The dollar was buttressed by new bets on U.S. rate hikes on Tuesday, while investors unloaded yen and sent it spearing below the psychological 120 level as the Bank of Japan looks increasingly isolated in its dovish policy stance.
Today, the U.S. dollar index measures the Greenback against a trade-weighted basket of six major currencies, which is increase 0.33% to 98.823.
The Euro US Dollar (EUR/USD) is a widely traded pair that is negative today. This left the pair trading around $1.10993.
The Japanese yen was positive against the U.S. dollar on Tuesday as the stock up. Today USD/JPY is rose 0.82% to 120.460 level.
Another commodity-related currency negative against the U.S dollar, AUD/USD down 0.18% to 0.73870, and NZD/USD lower 0.09% to 0.68770 level.
EUR/USD Intraday: Trend on the Downside
Our pivot point is at 1.10010
Preferable Price Action: Take Short positions below pivot level with targets at 1.09540 & 1.09090 in extension.
Alternative Price Action: Above pivot looks for a further upside to 1.10520 & 1.11020.
Comment: RSI below 50 levels and Pair below its 20MA & 55MA.
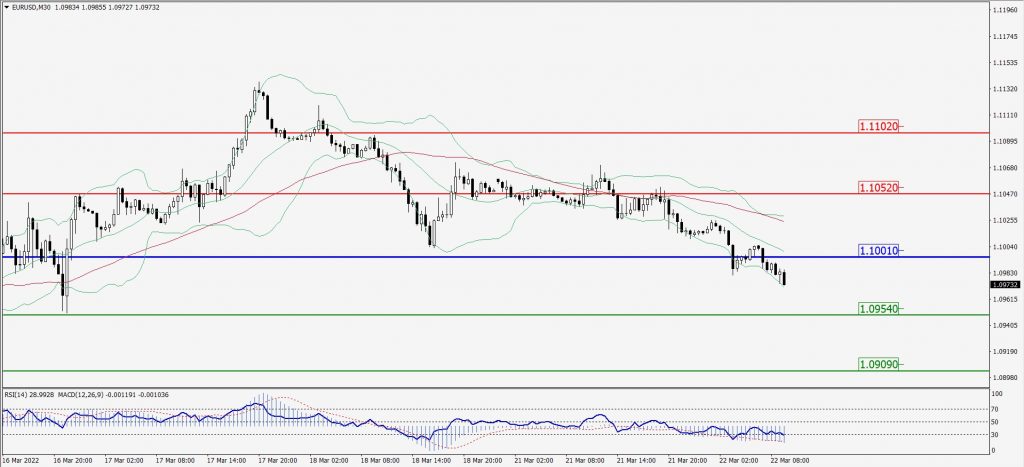
Green Lines Indicate Resistance Levels – Red Lines Indicates Support Levels
Light Blue is a Pivot Point – Black represents the price when the report was produced
GBP/USD Intraday: Trend on the Downside
Our pivot point is at 1.31500
Preferable Price Action: Sell positions below pivot with targets at 1.30970 & 1.30440 in extension.
Alternative Price Action: The price above pivot would call for further upside to 1.32050 & 1.32460.
Comment: RSI below 50 levels and Pair below its 20MA & 55MA.
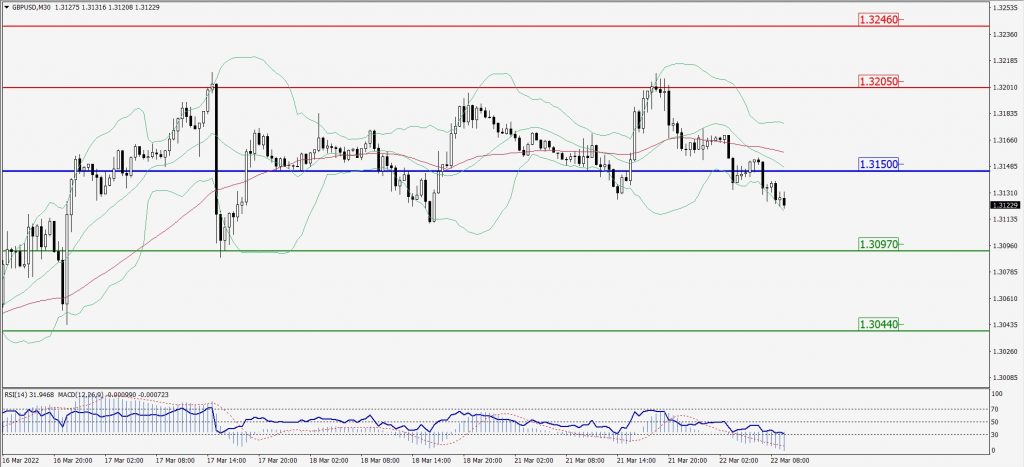
Green Lines Indicate Resistance Levels – Red Lines Indicates Support Levels
Light Blue is a Pivot Point – Black represents the price when the report was produced
USD/JPY Intraday: Major Trend on the Upside
Our pivot point is at 120.270
Preferable Price Action: Buy position Above pivot with the target at 120.900 and 121.430 in extension.
Alternative Price Action: The Downside breakout of the pivot would call for 119.640 and 119.100.
Comment: MACD in Positive territory and Pair Above its 20MA & 55MA.
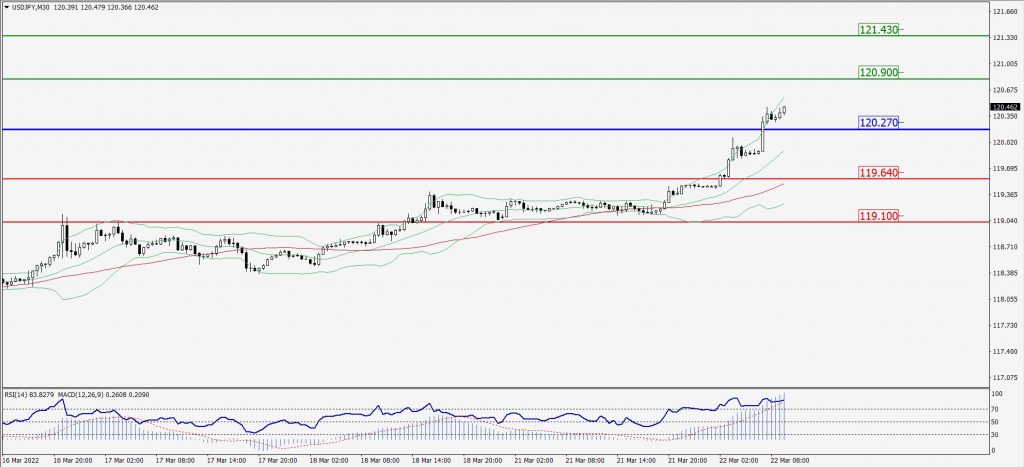
Green Lines Indicate Resistance Levels – Red Lines Indicates Support Levels
Light Blue is a Pivot Point – Black represents the price when the report was produced
AUD/USD Intraday: Resistance Level at 0.74140
Our pivot point is at 0.74140
Preferable Price Action: Sell Positions below pivot with targets at 0.73500 & 0.72980 in extension.
Alternative Price Action: Above pivot looks for a further upside with 0.74730 & 0.75140 as targets.
Comment: RSI below 50 levels and Pair below its 20MA & 55MA.
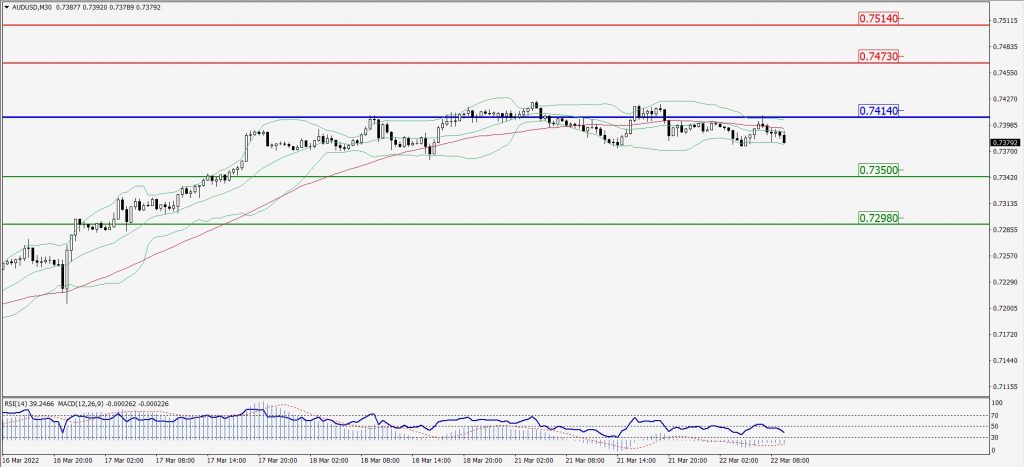
Green Lines Indicate Resistance Levels – Red Lines Indicates Support Levels
Light Blue is a Pivot Point – Black represents the price when the report was produced
CRUDEOIL Intraday: Major Trend on the Upside
Our pivot point is at 109.81
Preferable Price Action: Above pivots Buy Oil with 115.53 & 119.29 as targets.
Alternative Price Action: Sell crude Below pivot with targets at 104.68 and 100.14 in extension.
Comment: MACD is in the positive territory and Pair Above its 20MA & 55MA.
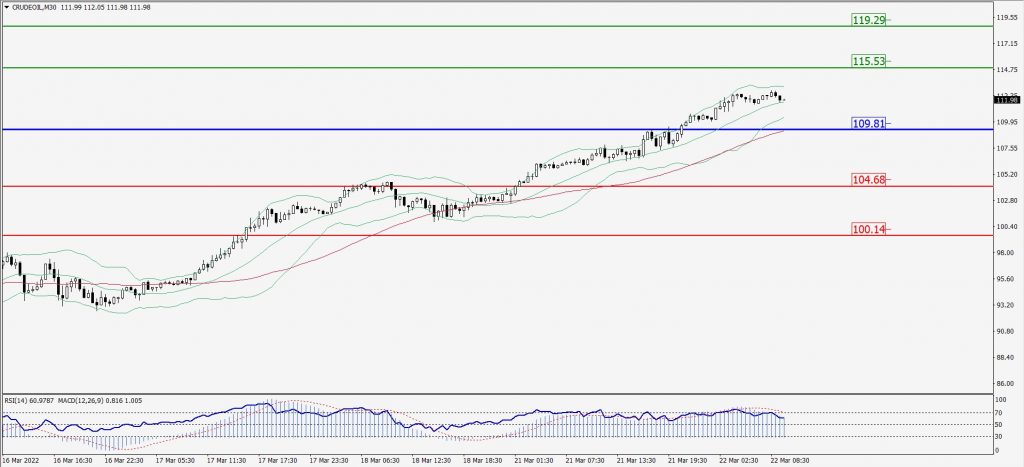
Green Lines Indicate Resistance Levels – Red Lines Indicates Support Levels
Light Blue is a Pivot Point – Black represents the price when the report was produced
XAU/USD Intraday: Major Support Level at 1930.10
Our pivot point is 1930.10
Preferable Price Action: Further upside to 1944.30 and 1954.70.
Alternative Price Action: If the price gives a downside breakout of a pivot, then the price extends to 1915.80 and 1903.40.
Comment: MACD is a positive territory and Pair above 55MA.
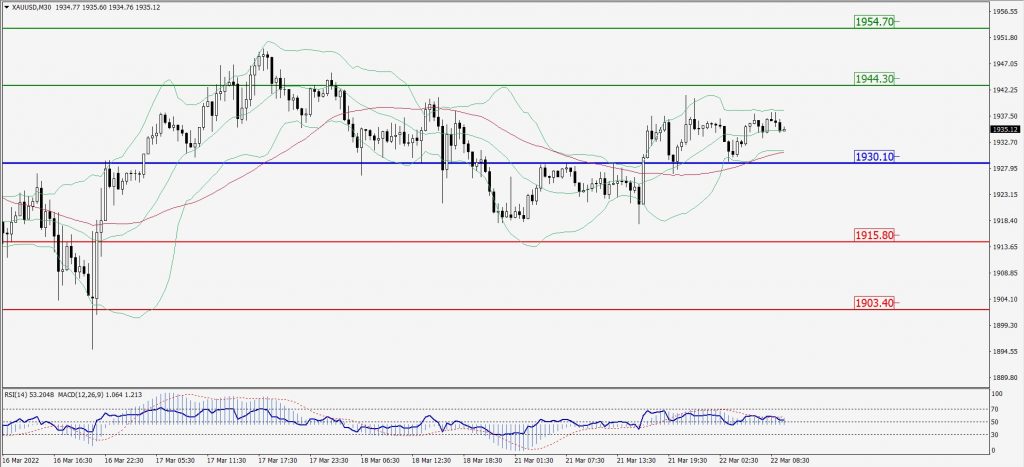
Green Lines Indicate Resistance Levels – Red Lines Indicates Support Levels
Light Blue is a Pivot Point – Black represents the price when the report was produced
Dow Jones Intraday: In a Consolidation Zone
Our pivot point is 34,766.00
Preferable Price Action: Take Short positions below pivot with targets at 34,323.00 & 34,053.00.
Alternative Price Action: Above 34,766.00 looks for further upside to 35,110.00 & 35,347.00.
Comment: Price below 55MA and RSI at 50 levels.
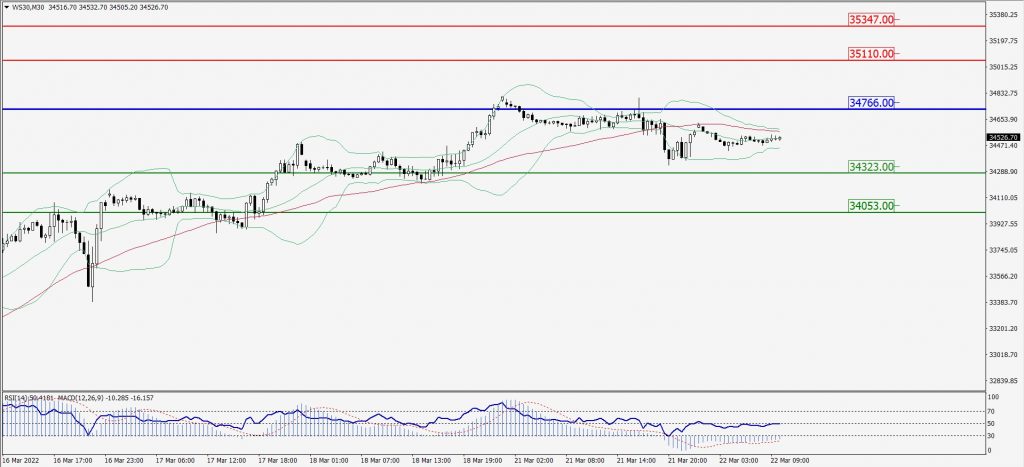
Green Lines Indicate Resistance Levels – Red Lines Indicates Support Levels
Light Blue is a Pivot Point – Black represents the price when the report was produced