Market Wrap: Stocks, Bonds, Commodities
Wall Street’s three major indexes closed higher on Friday, with the biggest boost from recently battered technology stocks, after talks between U.S. President Joe Biden and Chinese President Xi Jinping over the Ukraine crisis ended without big surprises.
The S&P 500 gain (1.17%) ended at 4,463.09 points, while the Nasdaq Composite accepted 2.05% to 13,893.84. The Dow Jones Industrial was rose 0.80% to 34,754.93.
MSCI’s index of Asia-Pacific stocks outside Japan is lost 0.87% to 712.42 levels. Australian index lower 0.22% to 7,278.40. Japanese Nikkei Index close today.
European stocks were Negative on Monday, with the Stoxx Europe 50 Index flat 0.01% to 3,901.55 Germany’s DAX dropped 0.07% to 14,402.46, and France’s CAC up 0.09% to 6,626.39, and U.K.’s FTSE 100 increase 0.39% to 7,437.77.
Benchmark 10-year U.S. Treasury fell as demand for safe assets dropped again, today 10-year bond yields a positive 2.187.
Oil prices jumped $2 on Monday as Ukrainian forces dug in against heavy Russian attacks, while major oil producers reported they are struggling to produce their allotted quotas under a supply agreement.
Spot Brent crude oil gained 4.11% to $112.26 per barrel. US West Texas Intermediate crude up 4.22% to $107.42 a barrel.
The yellow metal gold is descended 0.23% to 1,924.90 dollars per ounce.
Market Wrap: Forex
The U.S. dollar edged higher Monday, trading in a tight range ahead of comments from Federal Reserve chair Jerome Powell later in the session, just a few days after the U.S. central bank started its tightening cycle.
Today, the U.S. dollar index measures the Greenback against a trade-weighted basket of six major currencies, which is flat 0.01% to 98.233.
The Euro US Dollar (EUR/USD) is a widely traded pair that is positive today. This left the pair trading around $1.10540.
The Japanese yen was positive against the U.S. dollar on Monday as the stock up. Today USD/JPY is rose 0.03% to 119.200 level.
Another commodity-related currency negative against the U.S dollar, AUD/USD down 0.20% to 0.73980, and NZD/USD lower 0.05% to 0.68980 level.
EUR/USD Intraday: Trend on the Downside
Our pivot point is at 1.10580
Preferable Price Action: Take Short positions below pivot level with targets at 1.10190 & 1.09790 in extension.
Alternative Price Action: Above pivot looks for a further upside to 1.10970 & 1.11320.
Comment: RSI below 50 levels and Pair below its 20MA & 55MA.
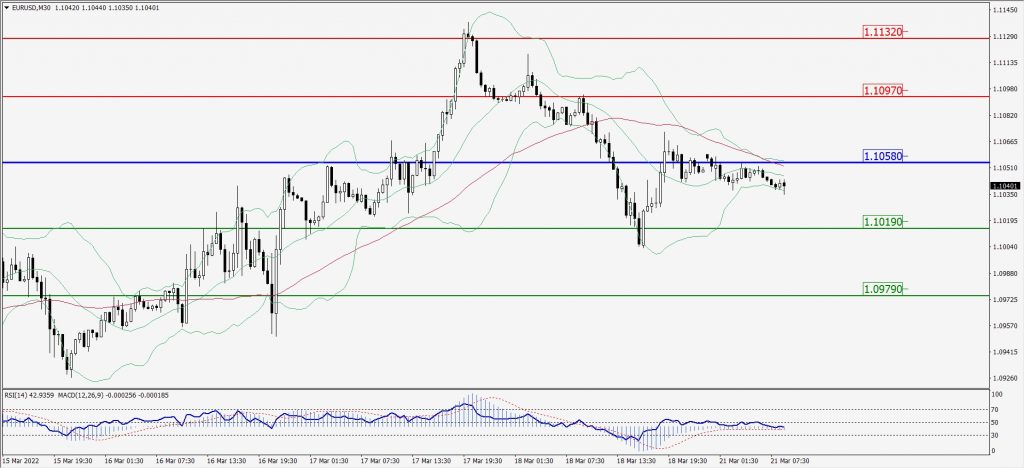
Green Lines Indicate Resistance Levels – Red Lines Indicates Support Levels
Light Blue is a Pivot Point – Black represents the price when the report was produced
GBP/USD Intraday: In a Consolidation Zone
Our pivot point is at 1.31750
Preferable Price Action: Sell positions below pivot with targets at 1.31370 & 1.30970 in extension.
Alternative Price Action: The price above pivot would call for further upside to 1.32060 & 1.32470.
Comment: RSI at 50 levels and Pair below 20MA.
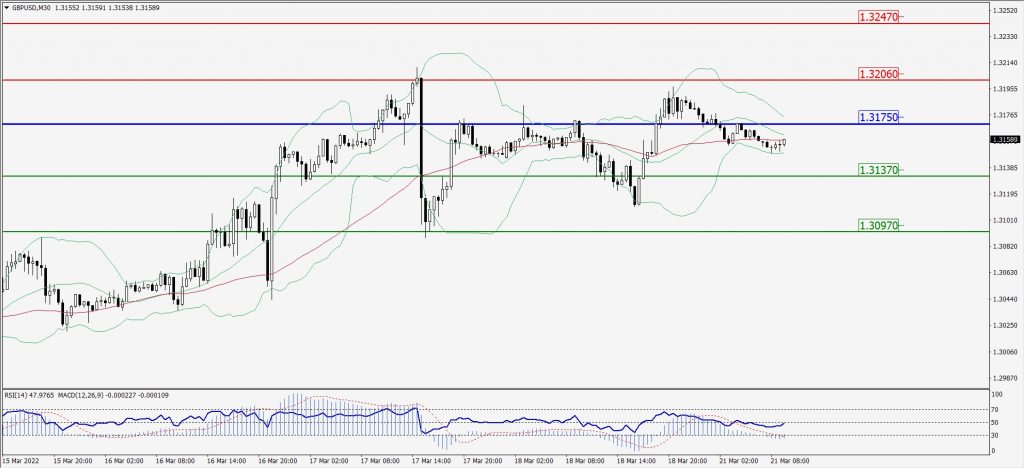
Green Lines Indicate Resistance Levels – Red Lines Indicates Support Levels
Light Blue is a Pivot Point – Black represents the price when the report was produced
USD/JPY Intraday: Trend on the Upside
Our pivot point is at 119.140
Preferable Price Action: Buy position Above pivot with the target at 119.470 and 119.730 in extension.
Alternative Price Action: The Downside breakout of the pivot would call for 118.850 and 118.550.
Comment: MACD in Positive territory and Pair Above its 20MA & 55MA.
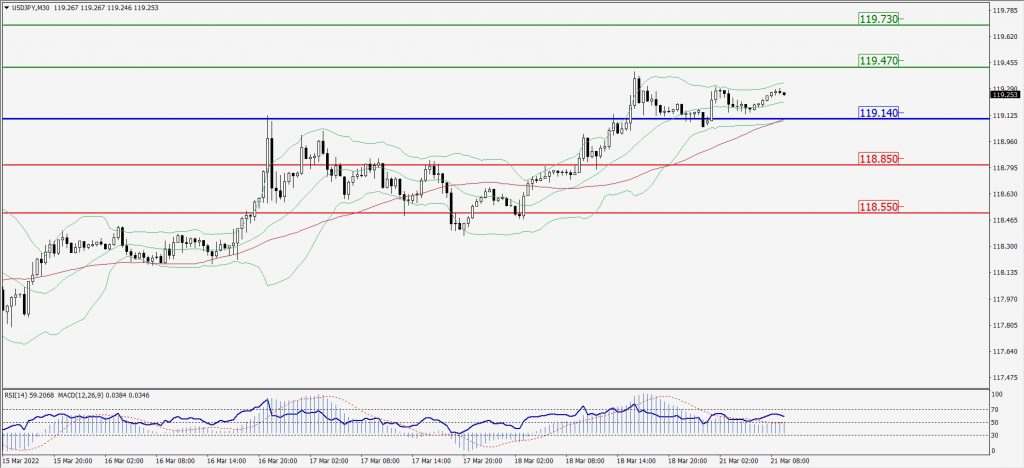
Green Lines Indicate Resistance Levels – Red Lines Indicates Support Levels
Light Blue is a Pivot Point – Black represents the price when the report was produced
AUD/USD Intraday: Trend on the Downside
Our pivot point is at 0.74260
Preferable Price Action: Sell Positions below pivot with targets at 0.73740 & 0.73270 in extension.
Alternative Price Action: Above pivot looks for a further upside with 0.74650 & 0.75060 as targets.
Comment: RSI below 50 levels and Pair below 20MA.
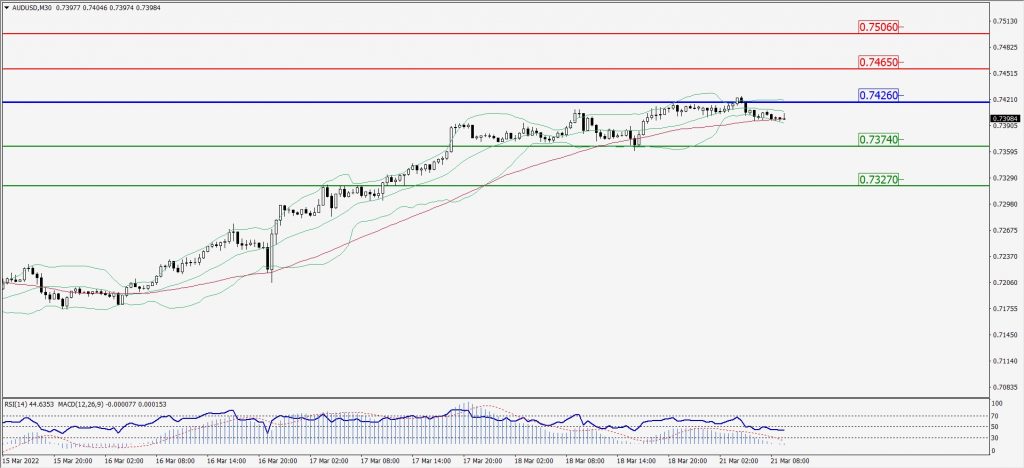
Green Lines Indicate Resistance Levels – Red Lines Indicates Support Levels
Light Blue is a Pivot Point – Black represents the price when the report was produced
CRUDEOIL Intraday: Major trend on the Upside
Our pivot point is at 104.90
Preferable Price Action: Above pivots Buy Oil with 108.61 & 111.20 as targets.
Alternative Price Action: Sell crude Below pivot with targets at 101.87 and 98.92 in extension.
Comment: MACD is in the positive territory and Pair Above its 20MA & 55MA.
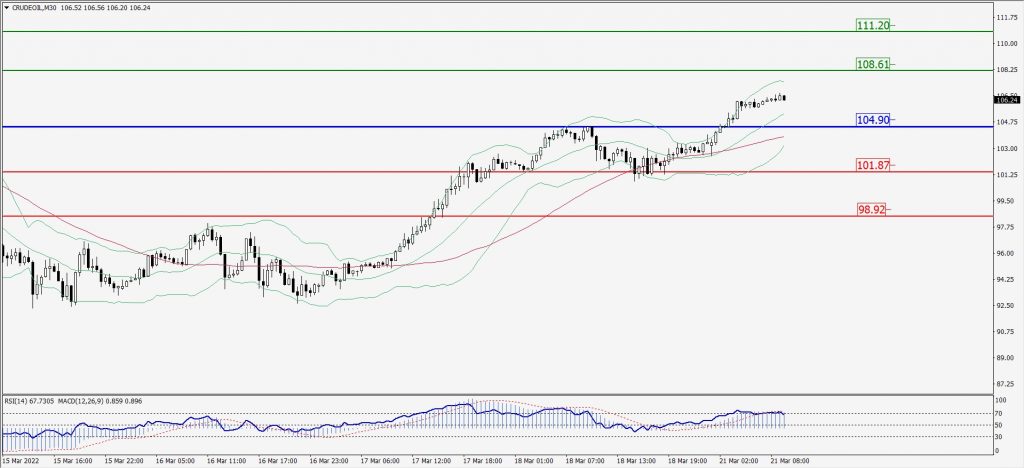
Green Lines Indicate Resistance Levels – Red Lines Indicates Support Levels
Light Blue is a Pivot Point – Black represents the price when the report was produced
XAU/USD Intraday: Resistance Level at 1930.00
Our pivot point is 1930.00
Preferable Price Action: Further Downside to 1917.40 and 1909.00.
Alternative Price Action: If the price gives an Upside breakout of a pivot, then the price extends to 1941.50 and 1950.80.
Comment: MACD is a negative territory and Pair Below 55MA.
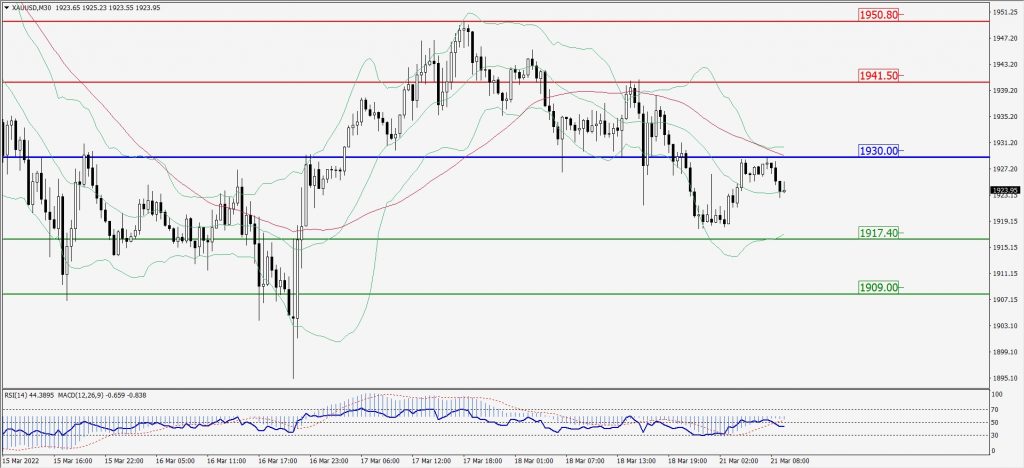
Green Lines Indicate Resistance Levels – Red Lines Indicates Support Levels
Light Blue is a Pivot Point – Black represents the price when the report was produced
Dow Jones Intraday: Trend on the Upside
Our pivot point is 34,417.00
Preferable Price Action: Take Long positions above pivot with targets at 35,082.00 & 35,549.00.
Alternative Price Action: below 34,417.00 looks for further downside to 33,799.00 & 33,228.00.
Comment: Price Above 55MA and RSI above 50 levels.
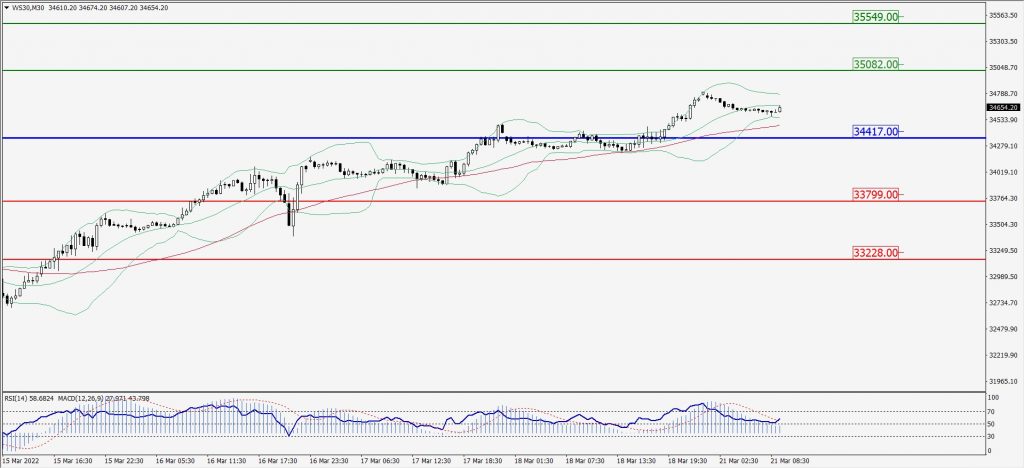
Green Lines Indicate Resistance Levels – Red Lines Indicates Support Levels
Light Blue is a Pivot Point – Black represents the price when the report was produced