Market Wrap: Stocks, Bonds, Commodities
World shares slid on Friday, pressured by uncertainty about the conflict in Ukraine and expectations the Federal Reserve will hike US interest rates next week. The Nasdaq and the S&P 500 fell, weighed down by tech and growth stocks.
The S&P 500 lose (1.30%) ended at 4,204.31 points, while the Nasdaq Composite decline 2.18% to 12,843.81. The Dow Jones Industrial was down 0.69% to 32,944.19.
MSCI’s index of Asia-Pacific stocks outside Japan is fell 2.36% to 675.31 levels. Australian index higher 1.21% to 7,149.40. Japanese Nikkei Index surge 0.58% to 25,307.85.
European stocks were Positive on Monday, with the Stoxx Europe 50 Index up 1.12% to 3,728.15 Germany’s DAX collect 2.04% to 13,905.76, and France’s CAC surge 0.68% to 6,302.87, and U.K.’s FTSE 100 gain 0.08% to 7,161.32.
Benchmark 10-year U.S. Treasury rose as demand for safe assets gain again, today 10-year bond yields a positive 2.032.
Oil prices fell on Sunday at the start of the session, extending last week’s decline, as a US official said Russia was showing signs it might be willing to have substantive negotiations over Ukraine.
Spot Brent crude oil fell 2.92% to $109.38 per barrel. US West Texas Intermediate crude down 3.32% to $105.70 a barrel.
The yellow metal gold is descended 0.24% to 1,980.20 dollars per ounce.
Market Wrap: Forex
The dollar hit a five-year high against the yen on Monday, as traders braced for the U.S. Federal Reserve to begin hiking rates, while reckoning the Bank of Japan remains dovish.
Today, the U.S. dollar index measures the Grayback against a trade-weighted basket of six major currencies, which is flat to 99.195.
The Euro US Dollar (EUR/USD) is a widely traded pair that is positive today. This left the pair trading around $1.09390.
The Japanese yen was positive against the U.S. dollar on Monday as the stock up. Today USD/JPY is rose 0.44% to 117.800 level.
Another commodity-related currency negative against the U.S dollar, AUD/USD down 0.68% to 0.72400, and NZD/USD fell 0.41% to 0.67790 level.
EUR/USD Intraday: Trend on the Downside
Our pivot point is at 1.09620
Preferable Price Action: Take Short positions below pivot level with targets at 1.08950 & 1.08290 in extension.
Alternative Price Action: Above pivot looks for a further upside to 1.10260 & 1.10920.
Comment: RSI below 50 levels and Pair below 55MA.
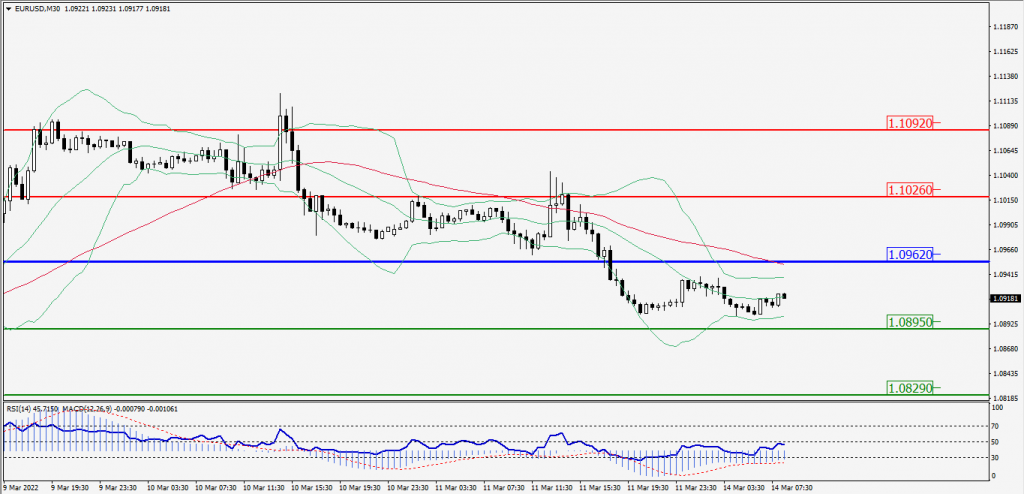
Green Lines Indicate Resistance Levels – Red Lines Indicates Support Levels
Light Blue is a Pivot Point – Black represents the price when the report was produced
GBP/USD Intraday: Trend on the Downside
Our pivot point is at 1.30690
Preferable Price Action: Sell positions below pivot with targets at 1.29890 & 1.29090 in extension.
Alternative Price Action: The price above pivot would call for further upside to 1.31470 & 1.32270.
Comment: RSI below 50 levels and Pair below its 20MA & 55MA.
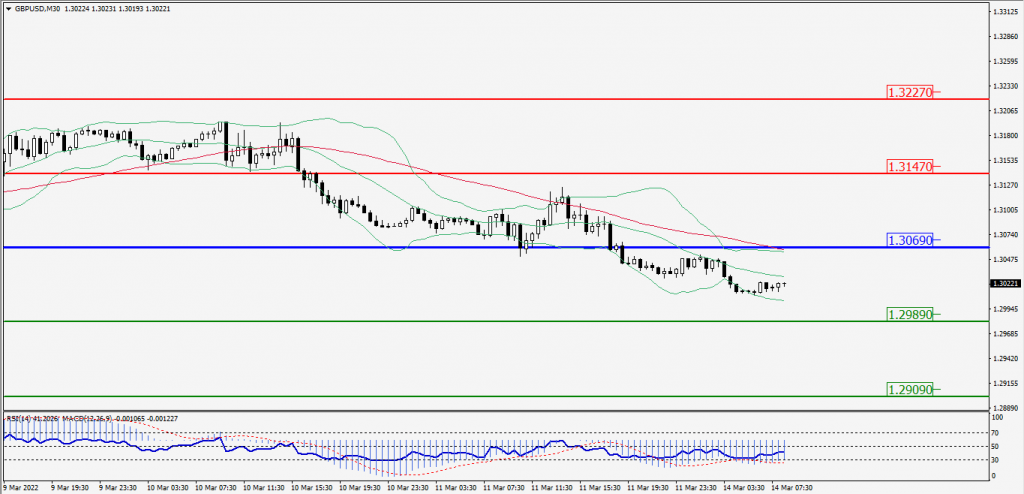
Green Lines Indicate Resistance Levels – Red Lines Indicates Support Levels
Light Blue is a Pivot Point – Black represents the price when the report was produced
USD/JPY Intraday: Trend on the Major Upside
Our pivot point is at 117.540
Preferable Price Action: Buy position Above pivot with the target at 118.260 and 118.860 in extension.
Alternative Price Action: The Downside breakout of the pivot would call for 116.810 and 116.210.
Comment: MACD in Positive territory and Pair Above its 20MA & 55MA.
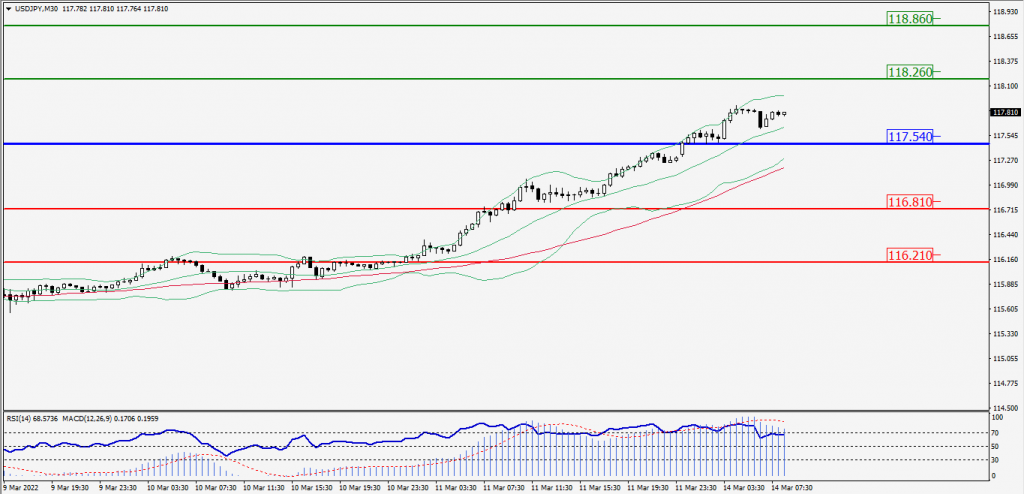
Green Lines Indicate Resistance Levels – Red Lines Indicates Support Levels
Light Blue is a Pivot Point – Black represents the price when the report was produced
AUD/USD Intraday: Trend on the Downside
Our pivot point is at 0.73030
Preferable Price Action: Sell Positions Below pivot with targets at 0.72140 & 0.71370 in extension.
Alternative Price Action: Above pivot looks for a further Upside with 0.73920 & 0.74680 as targets.
Comment: RSI below 50 levels and Pair Below its 20MA & 55MA.
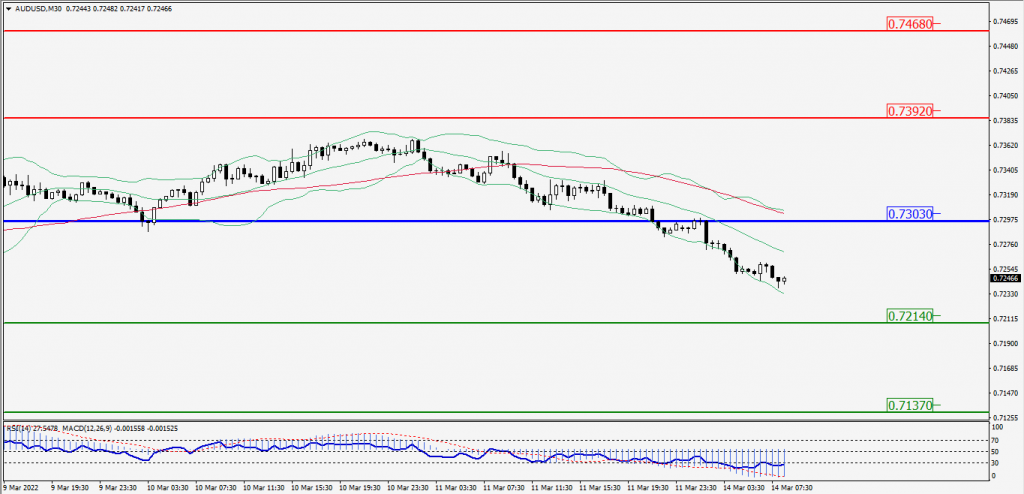
Green Lines Indicate Resistance Levels – Red Lines Indicates Support Levels
Light Blue is a Pivot Point – Black represents the price when the report was produced
CRUDEOIL Intraday: Trend on the Downside
Our pivot point is at 108.10
Preferable Price Action: Below pivots Sell Oil with 101.80 & 95.65 as targets.
Alternative Price Action: Buy crude above pivot with targets at 113.95 and 120.15 in extension.
Comment: MACD is in the negative territory and Pair Below its 20MA & 55MA.
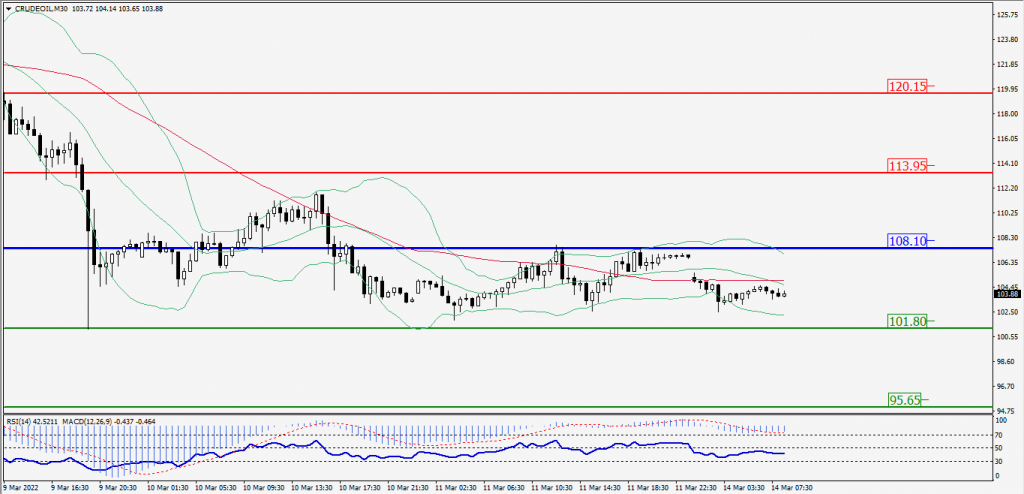
Green Lines Indicate Resistance Levels – Red Lines Indicates Support Levels
Light Blue is a Pivot Point – Black represents the price when the report was produced
XAU/USD Intraday: Trend on the Downside
Our pivot point is 1985.10
Preferable Price Action: Further Downside to 1969.80 and 1955.50.
Alternative Price Action: If the price gives an Upside breakout of a pivot, then the price extends to 1999.70 and 2014.20.
Comment: MACD is a negative territory and Pair Below its 20MA & 55MA.
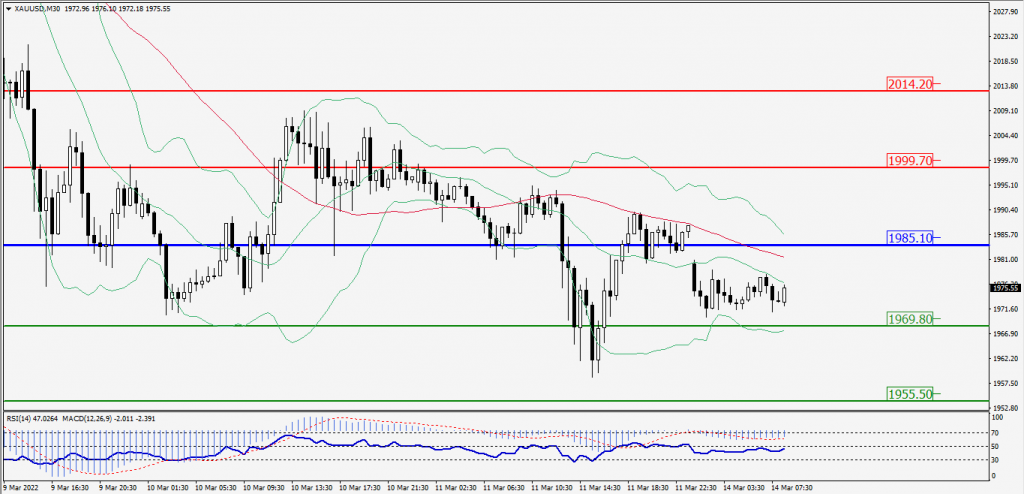
Green Lines Indicate Resistance Levels – Red Lines Indicates Support Levels
Light Blue is a Pivot Point – Black represents the price when the report was produced
Dow Jones Intraday: In a Consolidation Zone
Our pivot point is 33,109.00
Preferable Price Action: Take Long positions Above pivot with targets at 33,363.00 & 33,578.00.
Alternative Price Action: Below 33,109.00 looks for further downside to 32,853.00 & 32,627.00.
Comment: Price above 20MA and RSI above 50 levels.
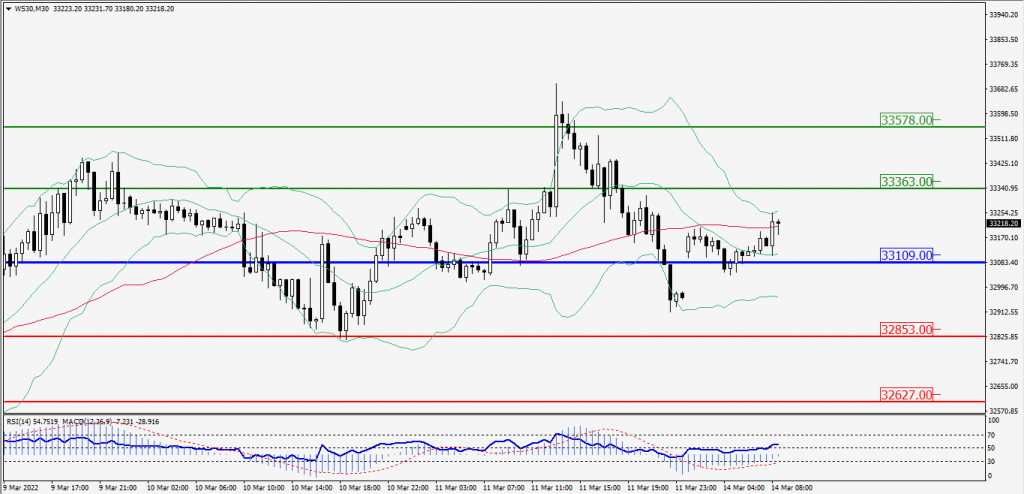
Green Lines Indicate Resistance Levels – Red Lines Indicates Support Levels
Light Blue is a Pivot Point – Black represents the price when the report was produced