Market Wrap: Stocks, Bonds, Commodities
Wall Street ended lower on Friday as the war in Ukraine overshadowed an acceleration in US jobs growth last month that pointed to strength in the economy.
The S&P 500 Lost (0.79%) ended at 4,328.87 points, while the Nasdaq Composite fell 1.66% to 13,313.44. The Dow Jones Industrial was down 0.53% to 33,614.80.
MSCI’s index of Asia-Pacific stocks outside Japan is dropped 3.17% to 701.09 levels. Australian index lost 1.02% to 7,038.60. Japanese Nikkei Index down 2.94% to 25,221.41.
European stocks were Negative on Friday, with the Stoxx Europe 50 Index down 2.88% to 3,453.55 Germany’s DAX fell 3.45% to 12,642.46, and France’s CAC pulled down 2.72% to 5,896.95, and U.K.’s FTSE 100 dropped 0.68% to 6,939.60.
Benchmark 10-year U.S. Treasury fell as demand for safe assets lost again, today 10-year bond yields a negative 1.709.
Oil prices soared to their highest since 2008 due to delays in the potential return of Iranian crude to global markets and as the United States and European allies consider banning imports of Russian oil.
Spot Brent crude oil rose 8.45% to $128.09 per barrel. US West Texas Intermediate crude up 7.90% to $124.82 a barrel.
The yellow metal gold is ascended to 1.44% to 1,995.10 dollars per ounce.
Market Wrap: Forex
The dollar was up on Monday morning in Asia, with the euro falling to a fresh 22-month low against the dollar and hitting multi-year lows on the yen, Swiss franc, and the pound.
Today, the U.S. dollar index measures the Greenback against a trade-weighted basket of six major currencies, which is rose today 0.17% to 98.835.
The Euro US Dollar (EUR/USD) is a widely traded pair that is negative today. This left the pair trading around $1.08860.
The Japanese yen was positive against the U.S. dollar on Friday as the stock up. Today USD/JPY is rose 0.22% to 115.030 level.
Another commodity-related currency positive against the U.S dollar, AUD/USD gained 0.64% to 0.74170, and NZD/USD rose 0.59% to 0.69010 level.
EUR/USD Intraday: Major Trend on the Downside
Our pivot point is at 1.09590
Preferable Price Action: Take Short positions Below pivot level with targets at 1.08260 & 1.07170 in extension.
Alternative Price Action: Above pivot looks for a further Upside to 1.10910 & 1.12020.
Comment: RSI below 50 levels and Pair Below 55MA.
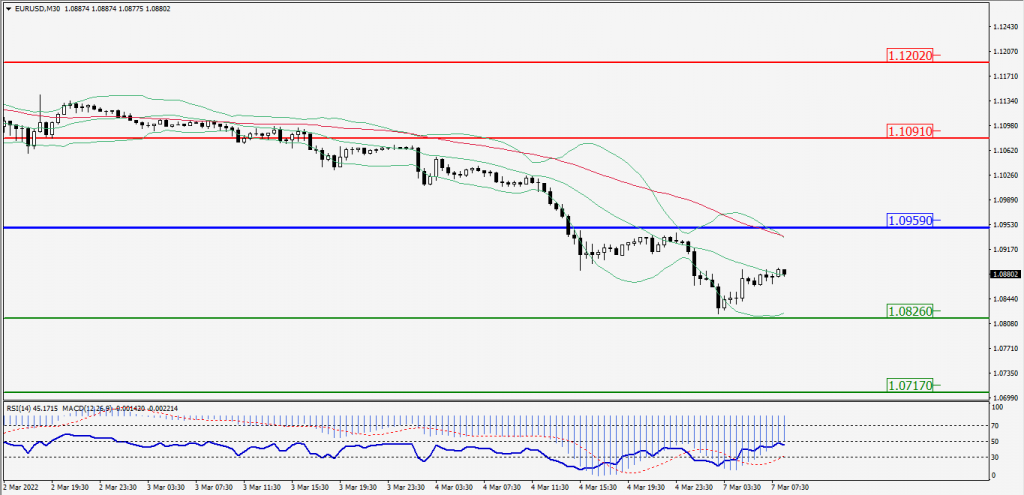
Green Lines Indicate Resistance Levels – Red Lines Indicates Support Levels
Light Blue is a Pivot Point – Black represents the price when the report was produced
GBP/USD Intraday: Resistance Level at 1.32470
Our pivot point is at 1.32470
Preferable Price Action: Sell positions Below pivot with targets at 1.31860 & 1.31370 in extension.
Alternative Price Action: The price Above pivot would call for further Upside to 1.33090 & 1.33570.
Comment: RSI Below 50 levels and Pair Below 55MA.
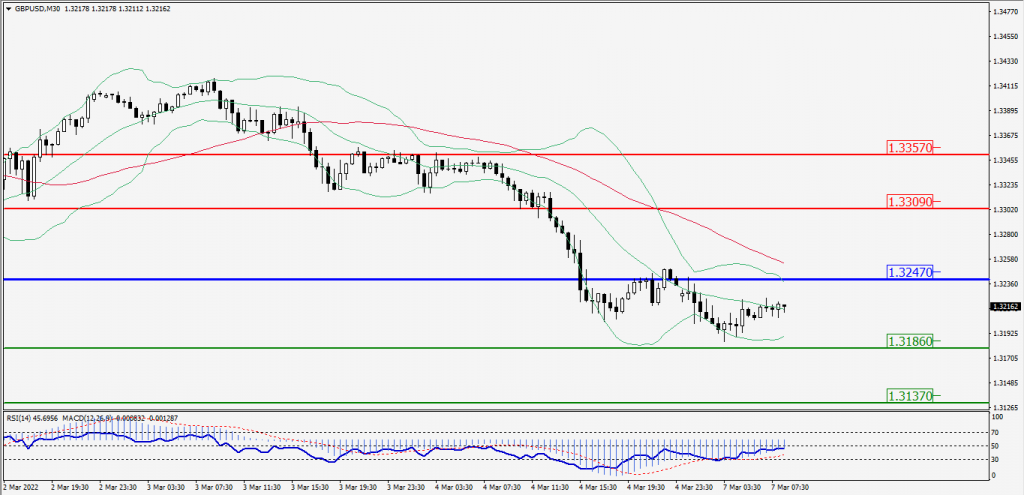
Green Lines Indicate Resistance Levels – Red Lines Indicates Support Levels
Light Blue is a Pivot Point – Black represents the price when the report was produced
USD/JPY Intraday: Resistance Level at 115.280
Our pivot point is at 115.280
Preferable Price Action: Sell position Below pivot with the target at 114.770 and 114.330 in extension.
Alternative Price Action: The Upside breakout of the pivot would call for 115.770 and 116.190.
Comment: MACD in neutral territory and Pair Below 55MA.
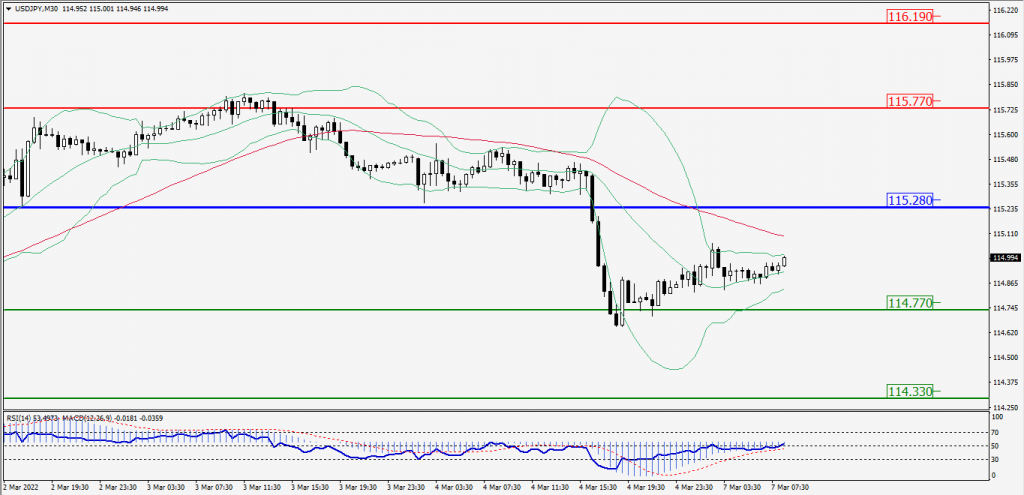
Green Lines Indicate Resistance Levels – Red Lines Indicates Support Levels
Light Blue is a Pivot Point – Black represents the price when the report was produced
AUD/USD Intraday: Trend on the Major Upside
Our pivot point is at 0.73970
Preferable Price Action: Buy Positions Above pivot with targets at 0.74390 & 0.74710 in extension.
Alternative Price Action: Below pivot looks for a further Downside with 0.73540 & 0.73210 as targets.
Comment: Pair Above its 20MA & 55MA and RSI above 50 levels.
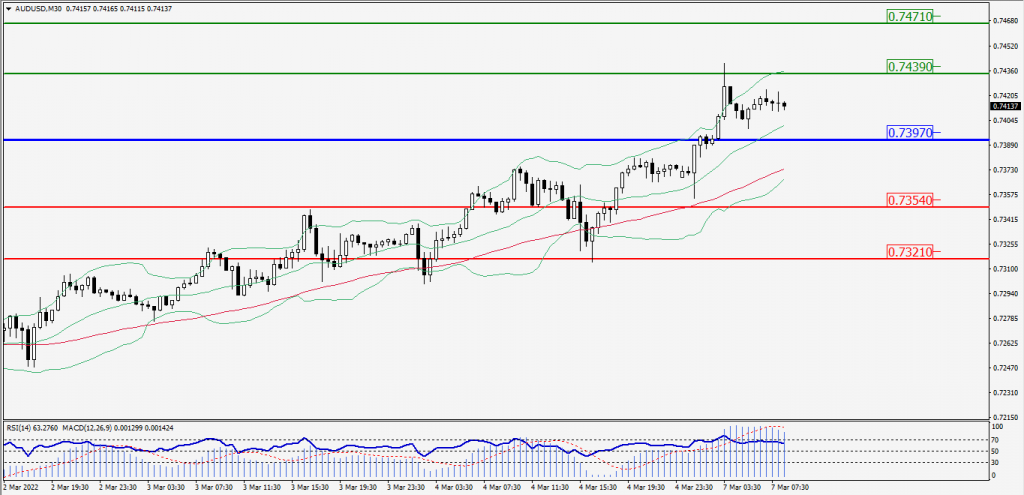
Green Lines Indicate Resistance Levels – Red Lines Indicates Support Levels
Light Blue is a Pivot Point – Black represents the price when the report was produced
CRUDEOIL Intraday: Trend on the Upside
Our pivot point is at 121.30
Preferable Price Action: Above pivots Buy Oil with 125.65 & 129.90 as targets.
Alternative Price Action: Sell crude Below pivot with targets at 116.85 and 112.70 in extension.
Comment: MACD is in the Positive territory and Pair Above its 20MA & 55MA.
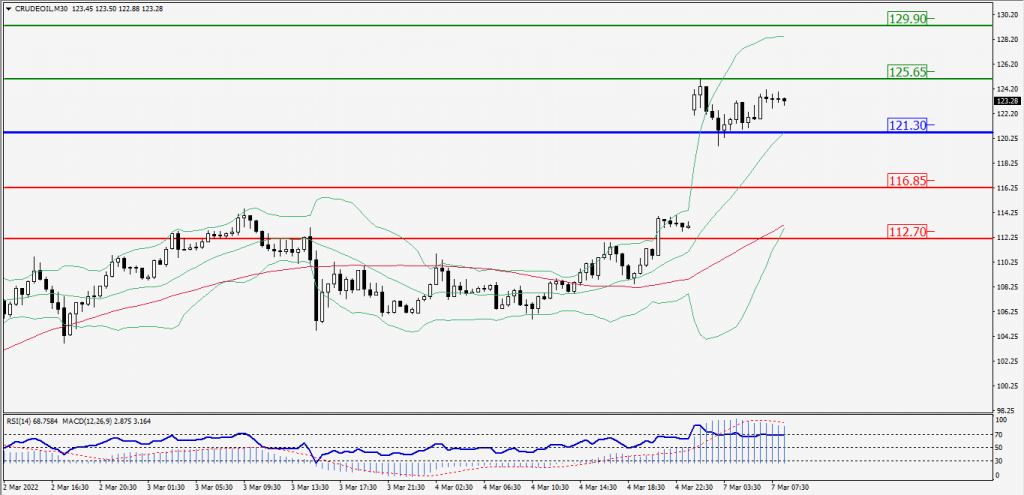
Green Lines Indicate Resistance Levels – Red Lines Indicates Support Levels
Light Blue is a Pivot Point – Black represents the price when the report was produced
XAU/USD Intraday: Trend on the Upside
Our pivot point is 1978.10
Preferable Price Action: Further Upside to 1992.80 and 2007.20.
Alternative Price Action: If the price gives a Downside breakout of a pivot, then the price extends to 1963.50 and 1948.50.
Comment: MACD is a Positive territory and Pair Above 55MA.
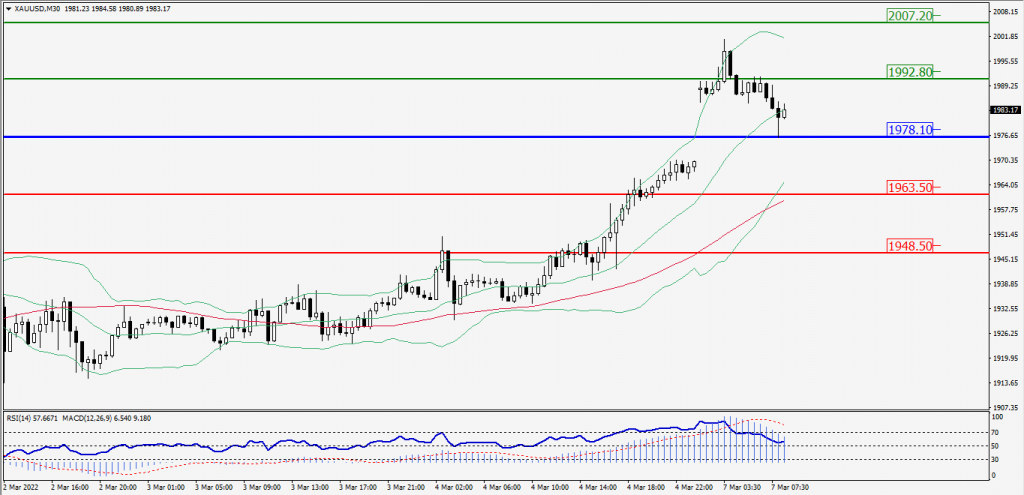
Green Lines Indicate Resistance Levels – Red Lines Indicates Support Levels
Light Blue is a Pivot Point – Black represents the price when the report was produced
Dow Jones Intraday: Resistance Level at 33,581.00
Our pivot point is 33,581.00
Preferable Price Action: Take Short positions Below pivot with targets at 33,085.00 & 32,679.00.
Alternative Price Action: Above 33,581.00 looks for further upside to 34,092.00 & 34,503.00.
Comment: Price Below its 20MA & 55MA and RSI negative 50 levels.
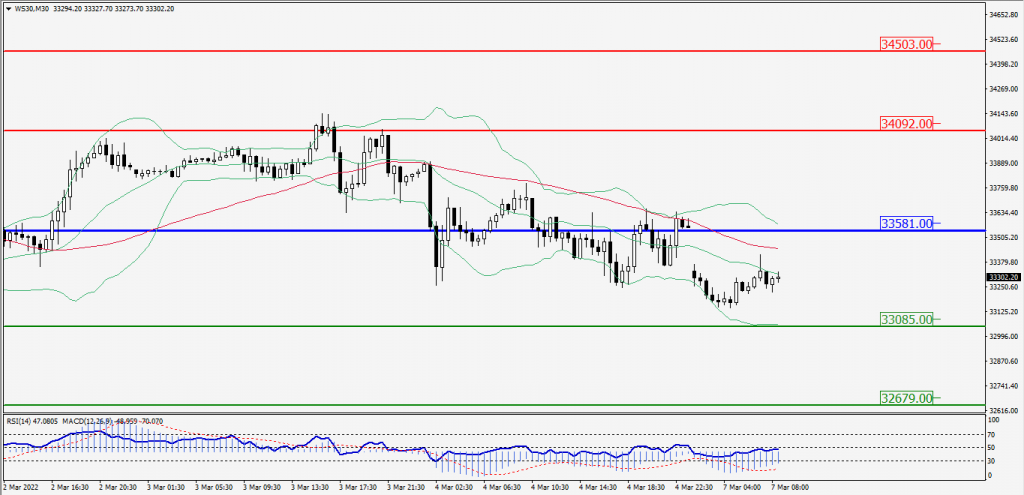
Green Lines Indicate Resistance Levels – Red Lines Indicates Support Levels
Light Blue is a Pivot Point – Black represents the price when the report was produced