Market Wrap: Stocks, Bonds, Commodities
Wall Street ended sharply higher on Wednesday after Federal Reserve Chair Jerome Powell signaled the central bank would likely raise interest rates less than some investors had feared.
The S&P 500 Gain (1.86%) ended at 4,386.54 points, while the Nasdaq Composite rose 1.62% to 13,752.02. The Dow Jones Industrial was collected 1.79% to 33,891.35.
MSCI’s index of Asia-Pacific stocks outside Japan is gained 0.21% to 742.49 levels. Australian index Surged 0.49% to 7,151.40. Japanese Nikkei Index up 0.70% to 26,577.27.
European stocks were Positive on Thursday, with the Stoxx Europe 50 Index rose 0.29% to 3,833.45 Germany’s DAX climbed 0.15% to 14,021.20, and France’s CAC pulled up 0.37% to 6,522.18, and U.K.’s FTSE 100 gained 0.31% to 7,452.55.
Benchmark 10-year U.S. Treasury fell as demand for safe assets lost again, today 10-year bond yields a negative 1.859.
Oil prices extended their rally on Thursday, with Brent rising above $116 a barrel, as trade disruption and shipping issues from Russian sanctions over the Ukraine crisis sparked supply worries while U.S. crude stocks fell to multi-year lows.
Spot Brent crude oil rose 5.07% to $118.65 per barrel. US West Texas Intermediate crude up 4.50% to $115.58 a barrel.
The yellow metal gold is ascended to 0.70% to 1,935.70 dollars per ounce.
Market Wrap: Forex
The US Dollar Index (DXY), which gauges the greenback vs. a bundle of its main rival currencies, alternates gains with losses around 97.50 amidst unabated geopolitical concerns.
Today, the U.S. dollar index measures the Greenback against a trade-weighted basket of six major currencies, which is rose today 0.13% to 97.543.
The Euro US Dollar (EUR/USD) is a widely traded pair that is negative today. This left the pair trading around $1.10920.
The Japanese yen was positive against the U.S. dollar on Thursday as the stock up. Today USD/JPY is collected 0.21& to 115.750 level.
Another commodity-related currency mixed against the U.S dollar, AUD/USD gained 0.26% to 0.7315, and NZD/USD flat 0.67840 level.
EUR/USD Intraday: Resistance Level at 1.11390
Our pivot point is at 1.11390
Preferable Price Action: Take Short positions Below pivot level with targets at 1.10650 & 1.10020 in extension.
Alternative Price Action: Above pivot looks for a further Upside to 1.12130 & 1.12740.
Comment: RSI at 50 levels and Pair Below its 20MA & 55MA.
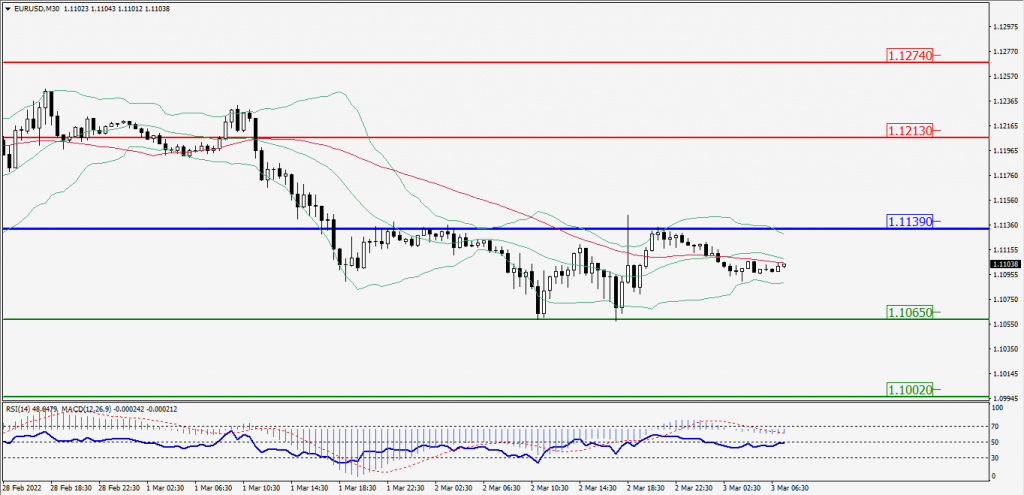
Green Lines Indicate Resistance Levels – Red Lines Indicates Support Levels
Light Blue is a Pivot Point – Black represents the price when the report was produced
GBP/USD Intraday: Support Level at 1.33880
Our pivot point is at 1.33880
Preferable Price Action: Buy positions Above pivot with targets at 1.34430 & 1.34890 in extension.
Alternative Price Action: The price Below pivot would call for further Downside to 1.33310 & 1.32850.
Comment: RSI Above 50 levels and Pair Above its 20MA & 55MA.
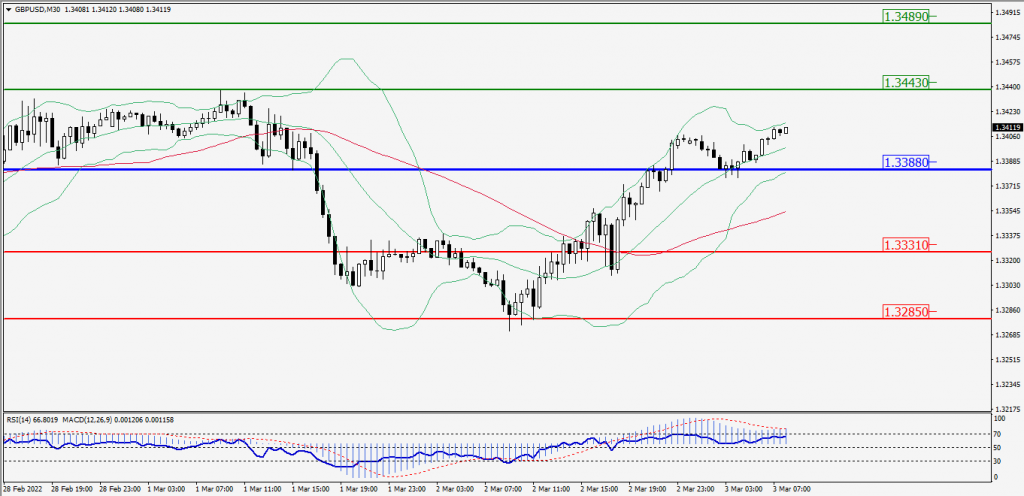
Green Lines Indicate Resistance Levels – Red Lines Indicates Support Levels
Light Blue is a Pivot Point – Black represents the price when the report was produced
USD/JPY Intraday: Trend on the Upside
Our pivot point is at 115.530
Preferable Price Action: Buy position Above pivot with the target at 115.880 and 116.170 in extension.
Alternative Price Action: The Downside breakout of the pivot would call for 115.170 and 114.890.
Comment: MACD in Positive territory and Pair Above its 20MA & 55MA.
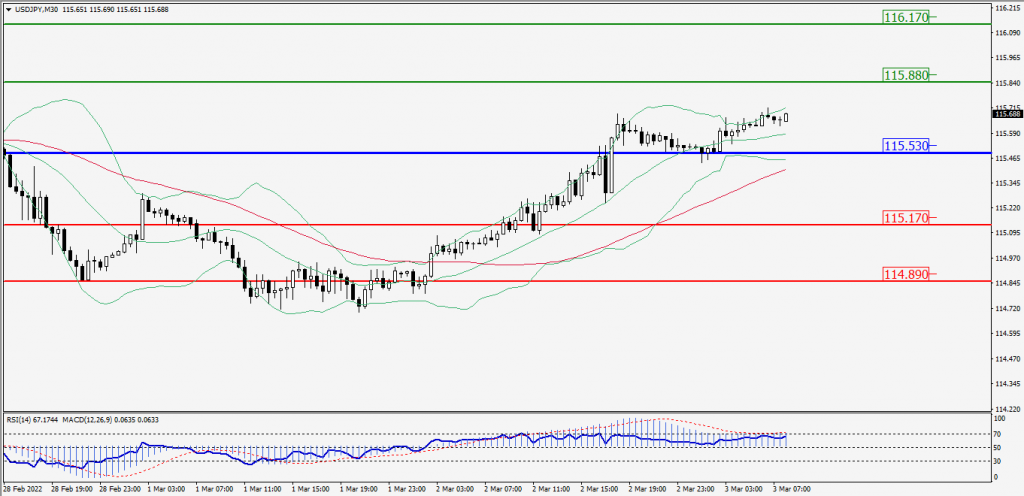
Green Lines Indicate Resistance Levels – Red Lines Indicates Support Levels
Light Blue is a Pivot Point – Black represents the price when the report was produced
AUD/USD Intraday: Trend on the Major Upside
Our pivot point is at 0.72820
Preferable Price Action: Buy Positions Above pivot with targets at 0.73340 & 0.73780 in extension.
Alternative Price Action: Below pivot looks for a further Downside with 0.72290 & 0.71860 as targets.
Comment: Pair Above its 20MA & 55MA and RSI above 50 levels.
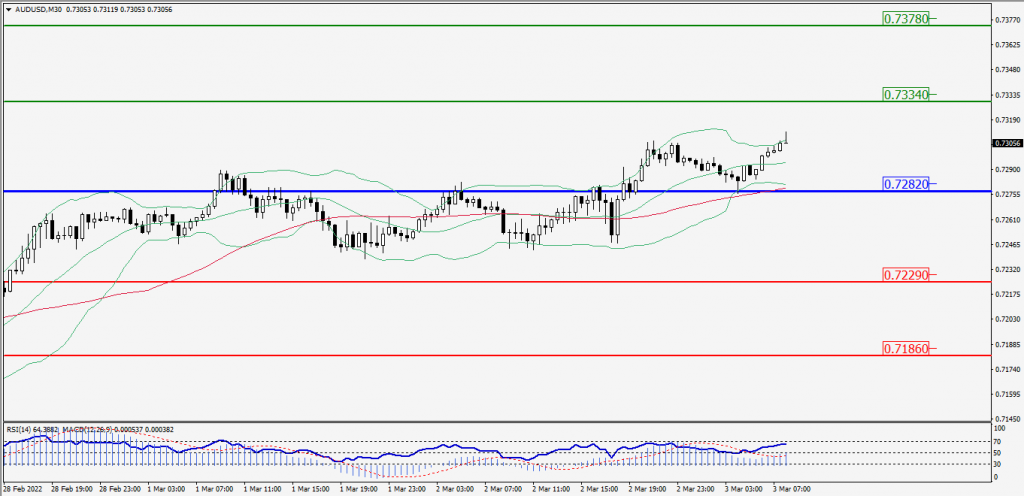
Green Lines Indicate Resistance Levels – Red Lines Indicates Support Levels
Light Blue is a Pivot Point – Black represents the price when the report was produced
CRUDEOIL Intraday: Trend on the Major Upside
Our pivot point is at 109.75
Preferable Price Action: Above pivots Buy Oil with 115.10 & 119.75 as targets.
Alternative Price Action: Sell crude Below pivot with targets at 104.35 and 99.70 in extension.
Comment: MACD is in the Positive territory and Pair Above its 20MA & 55MA.
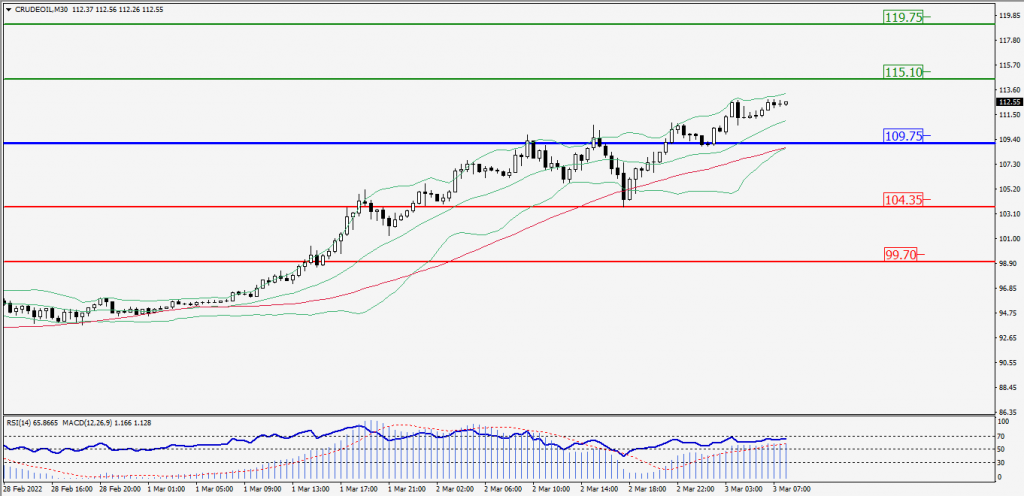
Green Lines Indicate Resistance Levels – Red Lines Indicates Support Levels
Light Blue is a Pivot Point – Black represents the price when the report was produced
XAU/USD Intraday: In a Consolidation Zone
Our pivot point is 1944.70
Preferable Price Action: Further Downside to 1912.50 and 1886.40.
Alternative Price Action: If the price gives an Upside breakout of a pivot, then the price extends to 1975.20 and 2001.50.
Comment: MACD is a Negative territory and Pair Below its 20MA & 55MA.
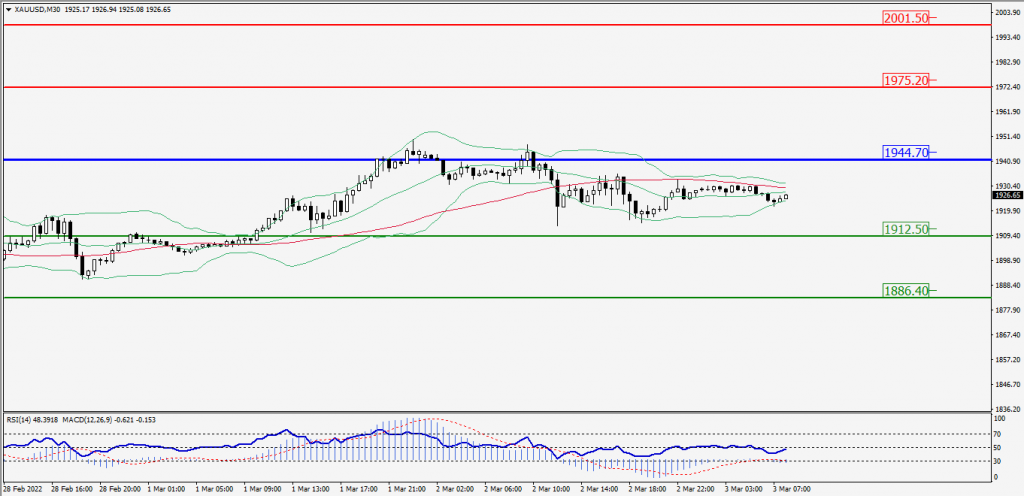
Green Lines Indicate Resistance Levels – Red Lines Indicates Support Levels
Light Blue is a Pivot Point – Black represents the price when the report was produced
Dow Jones Intraday: Trend on the Upside
Our pivot point is 33,650.00
Preferable Price Action: Take Long positions Above pivot with targets at 34,355.00 & 34,944.00.
Alternative Price Action: Below 33,650.00 looks for further downside to 32,923.00 & 32,313.00.
Comment: Price Above its 20MA & 55MA and RSI above 50 levels.
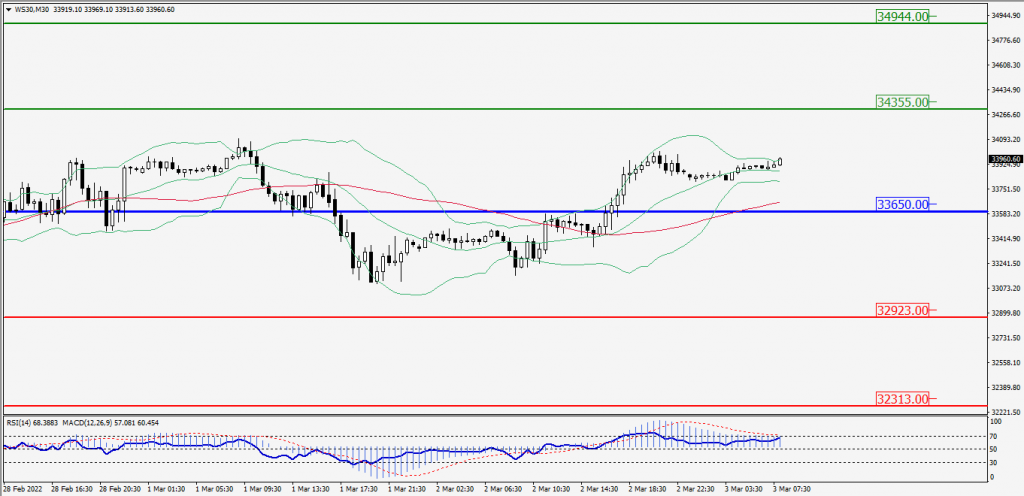
Green Lines Indicate Resistance Levels – Red Lines Indicates Support Levels
Light Blue is a Pivot Point – Black represents the price when the report was produced