Market Wrap: Stocks, Bonds, Commodities
Wall Street ended sharply lower on Tuesday, with financial stocks bearing much of the damage for a second straight day as the Russia-Ukraine crisis deepened and stirred anxiety among investors.
The S&P 500 Lost (1.55%) ended at 4,306.26 points, while the Nasdaq Composite dropped 1.59% to 13,532.49. The Dow Jones Industrial was down 1.76% to 33,294.95.
MSCI’s index of Asia-Pacific stocks outside Japan is gained 1.05% to 741.23 levels. Australian index Surged 0.28% to 7,116.70. Japanese Nikkei Index fell 1.68% to 26,393.03.
European stocks were mixed on Wednesday, with the Stoxx Europe 50 Index lost 0.39% to 3,751.25 Germany’s DAX loos 0.63% to 13,817.74, and France’s CAC pulled down 0.60% to 6,358.28, and U.K.’s FTSE 100 gain 0.69% to 7,380.62.
Benchmark 10-year U.S. Treasury fell as demand for safe assets gain again, today 10-year bond yields a positive 1.748.
Oil prices rose on Wednesday as sanctions on Russian banks following Moscow’s invasion of Ukraine hampered trade finance for crude shipments and some traders opted to avoid Russian supplies in an already tight market.
Spot Brent crude oil rose 5.84% to $111.10 per barrel. US West Texas Intermediate crude up 6.10% to $109.72 a barrel.
The yellow metal gold is descended to 0.30% to 1,938.05 dollars per ounce.
Market Wrap: Forex
The dollar was down on Wednesday morning in Asia, but the moves were small. Investors flocking to safe-haven assets as Russia’ invasion into Ukraine intensified.
Today, the U.S. dollar index measures the Greenback against a trade-weighted basket of six major currencies, which is rose today 0.21% to 96.610.
The Euro US Dollar (EUR/USD) is a widely traded pair that is negative today. This left the pair trading around $1.10930.
The Japanese yen was positive against the U.S. dollar on Wednesday as the stock up. Today USD/JPY is collected 0.29& to 115.220 level.
Another commodity-related currency positive against the U.S dollar, AUD/USD gain 0.06% to 0.72520, and NZD/USD up 0.07% to 0.67600 level.
EUR/USD Intraday: Trend on the Downside
Our pivot point is at 1.11290
Preferable Price Action: Take Short positions Below pivot level with targets at 1.10490 & 1.09860 in extension.
Alternative Price Action: Above pivot looks for a further Upside to 1.12020 & 1.12670.
Comment: RSI Below 50 levels and Pair Below its 20MA & 55MA.
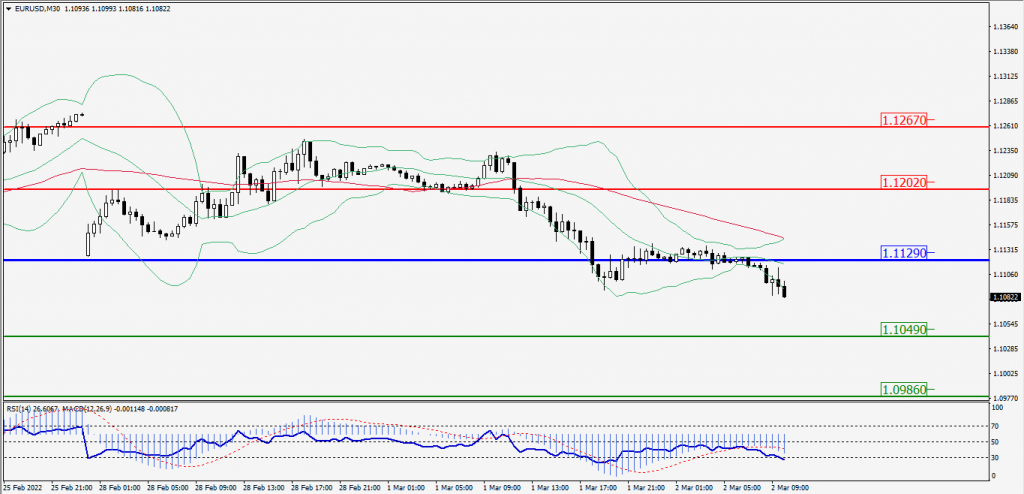
Green Lines Indicate Resistance Levels – Red Lines Indicates Support Levels
Light Blue is a Pivot Point – Black represents the price when the report was produced
GBP/USD Intraday: Trend on the Downside
Our pivot point is at 1.33470
Preferable Price Action: Sell positions Below pivot with targets at 1.32350 & 1.31370 in extension.
Alternative Price Action: The price Above pivot would call for further Upside to 1.34570 & 1.35530.
Comment: RSI Below 50 levels and Pair Below its 20MA & 55MA.
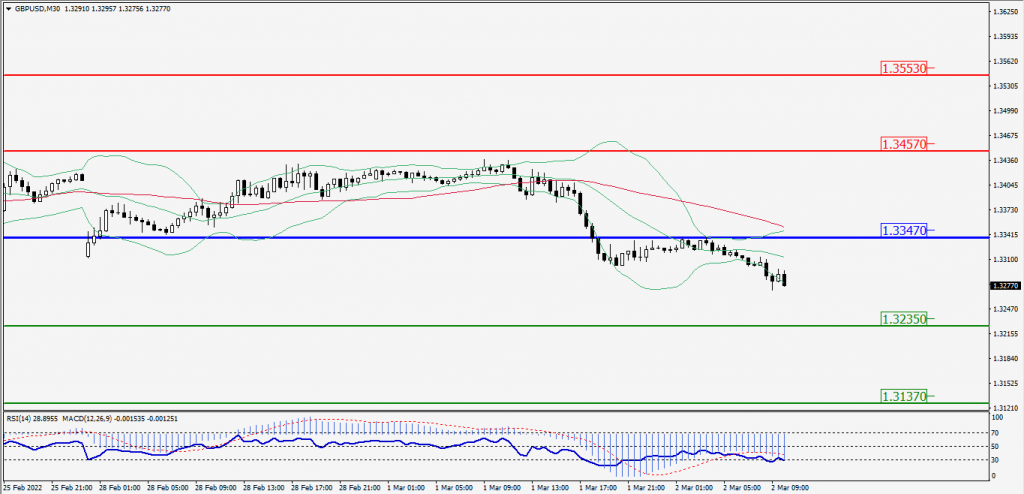
Green Lines Indicate Resistance Levels – Red Lines Indicates Support Levels
Light Blue is a Pivot Point – Black represents the price when the report was produced
USD/JPY Intraday: In a Consolidation Zone
Our pivot point is at 115.050
Preferable Price Action: Buy position Above pivot with the target at 115.550 and 115.960 in extension.
Alternative Price Action: The Downside breakout of the pivot would call for 114.560 and 114.070.
Comment: MACD in Positive territory and Pair Above its 20MA & 55MA.
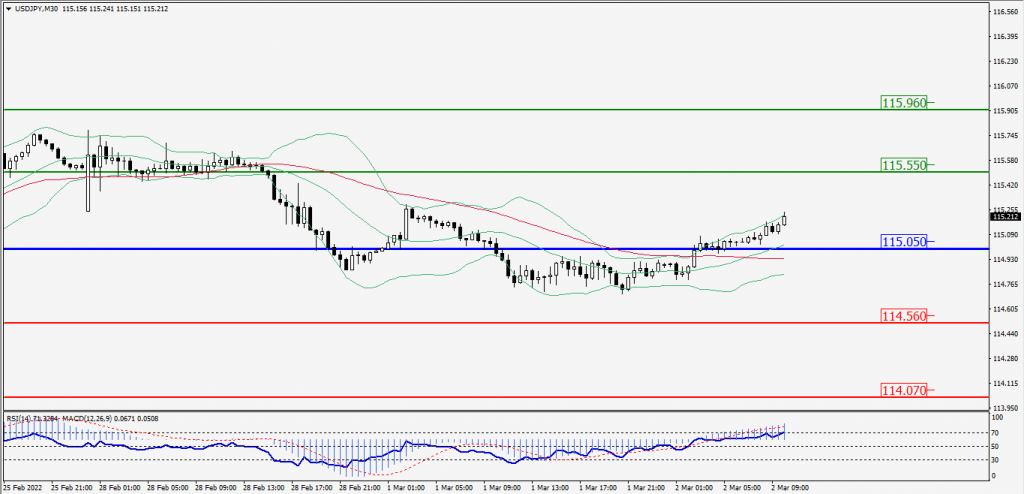
Green Lines Indicate Resistance Levels – Red Lines Indicates Support Levels
Light Blue is a Pivot Point – Black represents the price when the report was produced
AUD/USD Intraday: In a Consolidation Zone
Our pivot point is at 0.72340
Preferable Price Action: Buy Positions Above pivot with targets at 0.72910 & 0.73390 in extension.
Alternative Price Action: Below pivot looks for a further Downside with 0.71760 & 0.71280 as targets.
Comment: Pair Below its 20MA & 55MA and RSI below 50 levels.
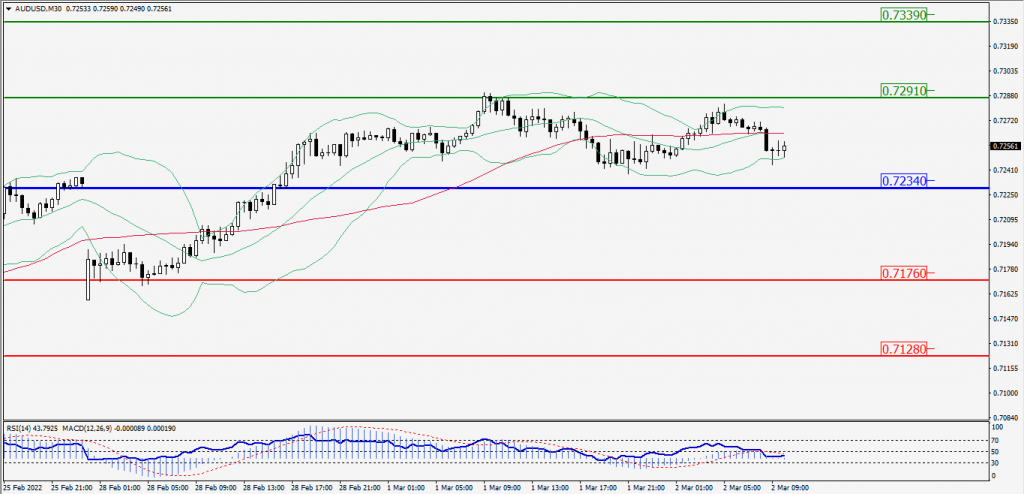
Green Lines Indicate Resistance Levels – Red Lines Indicates Support Levels
Light Blue is a Pivot Point – Black represents the price when the report was produced
CRUDEOIL Intraday: Trend on the Major Upside
Our pivot point is at 105.95
Preferable Price Action: Above pivots Buy Oil with 110.90 & 114.55 as targets.
Alternative Price Action: Sell crude Below pivot with targets at 101.15 and 97.25 in extension.
Comment: MACD is in the Positive territory and Pair Above its 20MA & 55MA.
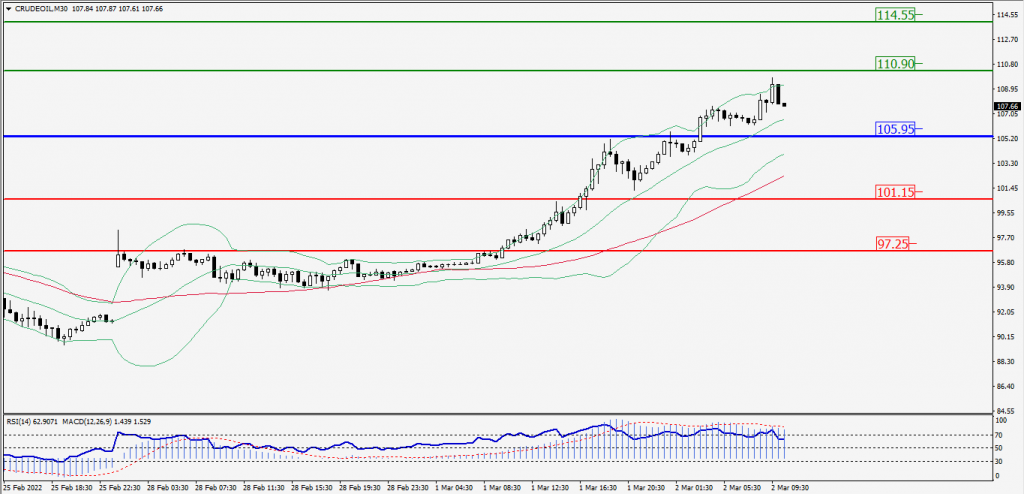
Green Lines Indicate Resistance Levels – Red Lines Indicates Support Levels
Light Blue is a Pivot Point – Black represents the price when the report was produced
XAU/USD Intraday: Trend on the Upside
Our pivot point is 1925.10
Preferable Price Action: Further Upside to 1959.10 and 1988.60.
Alternative Price Action: If the price gives a Downside breakout of a pivot, then the price extends to 1890.10 and 1860.80.
Comment: MACD is a Positive territory and Pair Above its 20MA & 55MA.
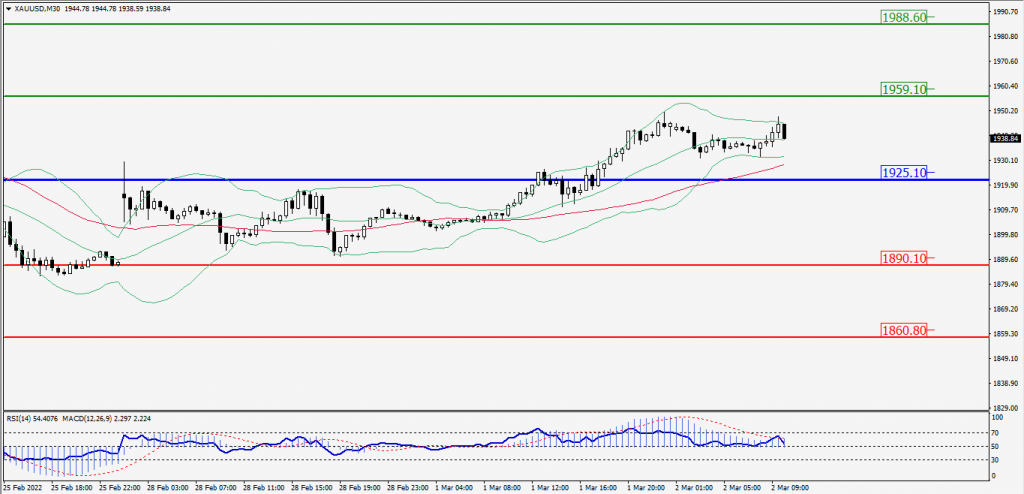
Green Lines Indicate Resistance Levels – Red Lines Indicates Support Levels
Light Blue is a Pivot Point – Black represents the price when the report was produced
Dow Jones Intraday: In a Consolidation Zone
Our pivot point is 33,917.00
Preferable Price Action: Take Short positions Below pivot with targets at 33,051.00 & 32,331.00.
Alternative Price Action: Above 33,917.00 looks for further Upside to 34,757.00 & 34,451.00.
Comment: Price Below 55MA and RSI at 50 levels.
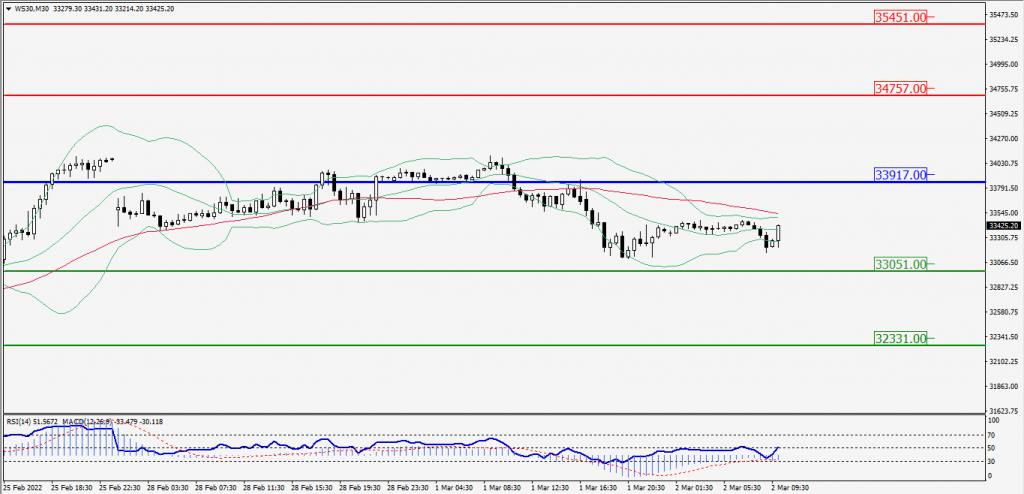
Green Lines Indicate Resistance Levels – Red Lines Indicates Support Levels
Light Blue is a Pivot Point – Black represents the price when the report was produced