Market Wrap: Stocks, Bonds, Commodities
The Dow on Friday registered its biggest daily percentage gain since November 2020 with the market rebounding for a second day from the sharp selloff leading up to Russia’s invasion of Ukraine.
The S&P 500 Gain (2.24%) ended at 4,384.62 points, while the Nasdaq Composite rose 1.64% to 13,694.62. The Dow Jones Industrial was up 2.51% to 34,058.75.
MSCI’s index of Asia-Pacific stocks outside Japan is flat to 744.63 levels. Australian index Surged 0.73% to 7,049.10. Japanese Nikkei Index collects 0.19% to 26,526.82.
European stocks were Negative on Monday, with the Stoxx Europe 50 Index lost 2.26% to 3.880.95 Germany’s DAX loss 1.85% to 14,297.61, and France’s CAC pulled down 2.10% to 6,610.85, and U.K.’s FTSE 100 down 0.96% to 7,417.33.
Benchmark 10-year U.S. Treasury fell as demand for safe assets lost again, today 10-year bond yields a negative 1.915.
Crude oil jumped after Western nations imposed new sanctions on Russia for its invasion of Ukraine, including blocking some banks from the SWIFT international payments system.
Spot Brent crude oil rose 3.76% to $97.66 per barrel. US West Texas Intermediate crude up 3.79% to $95.06 a barrel.
The yellow metal gold is ascended 0.64% to 1,899.75 dollars per ounce.
Market Wrap: Forex
The U.S. dollar soared in early European trade Monday, while the ruble plummeted to a record low, as enhanced sanctions by the West on Russia for its invasion of Ukraine lifted demand for the world’s reserve currency.
Today, the U.S. dollar index measures the Greenback against a trade-weighted basket of six major currencies, which is gain 0.58% today to 97.180.
The Euro US Dollar (EUR/USD) is a widely traded pair that is negative today. This left the pair trading around $1.11720.
The Japanese yen was negative against the U.S. dollar on Monday as the stock down. Today USD/JPY is flat to 115.560 level.
Another commodity-related currency negative against the U.S dollar, AUD/USD lost 0.50% to 0.71960, and NZD/USD down 0.40% to 0.67070 level.
EUR/USD Intraday: Trend may reverse from here
Our pivot point is at 1.12130
Preferable Price Action: Take Short positions Below pivot level with targets at 1.11290 & 1.10650 in extension.
Alternative Price Action: Above pivot looks for a further Upside to 1.12940 & 1.13590.
Comment: RSI Below 50 levels and Pair Below its 20MA & 55MA.
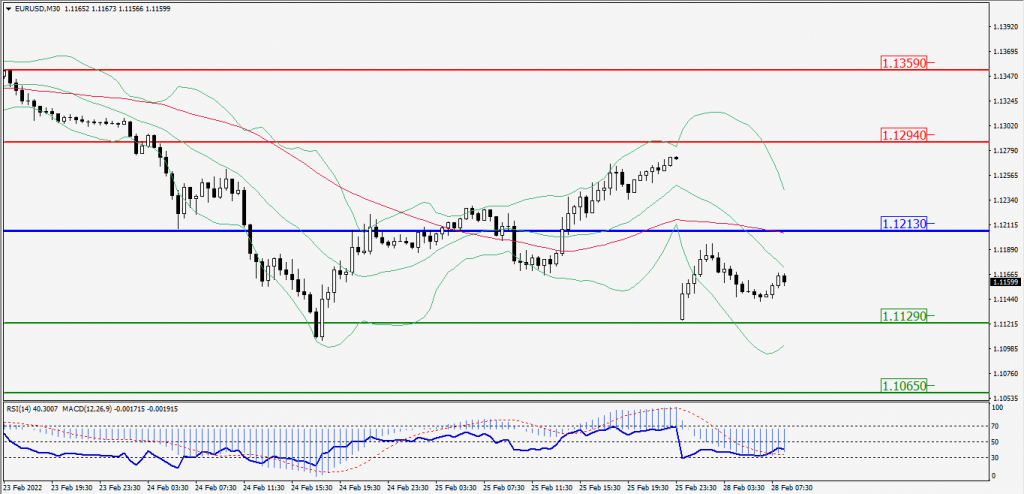
Green Lines Indicate Resistance Levels – Red Lines Indicates Support Levels
Light Blue is a Pivot Point – Black represents the price when the report was produced
GBP/USD Intraday: Trend may reverse
Our pivot point is at 1.34180
Preferable Price Action: Sell positions Below pivot with targets at 1.33280 & 1.32510 in extension.
Alternative Price Action: The price Above pivot would call for further Upside to 1.35100 & 1.35850.
Comment: RSI at 50 levels and Pair Below 55MA.
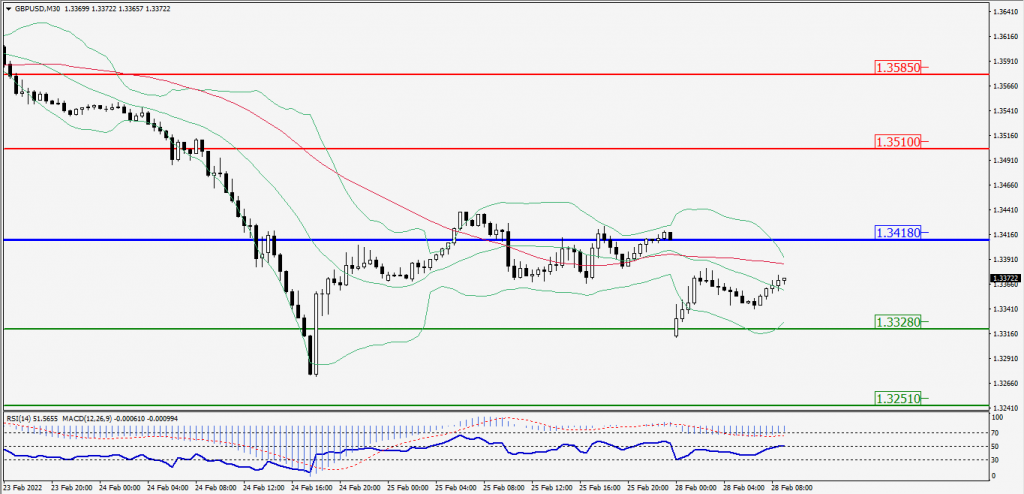
Green Lines Indicate Resistance Levels – Red Lines Indicates Support Levels
Light Blue is a Pivot Point – Black represents the price when the report was produced
USD/JPY Intraday: Support Level at 115.270
Our pivot point is at 115.270
Preferable Price Action: Buy position Above pivot with the target at 115.950 and 116.460 in extension.
Alternative Price Action: The Downside breakout of the pivot would call for 114.630 and 114.110.
Comment: MACD in Neutral territory and Pair Above 55MA.
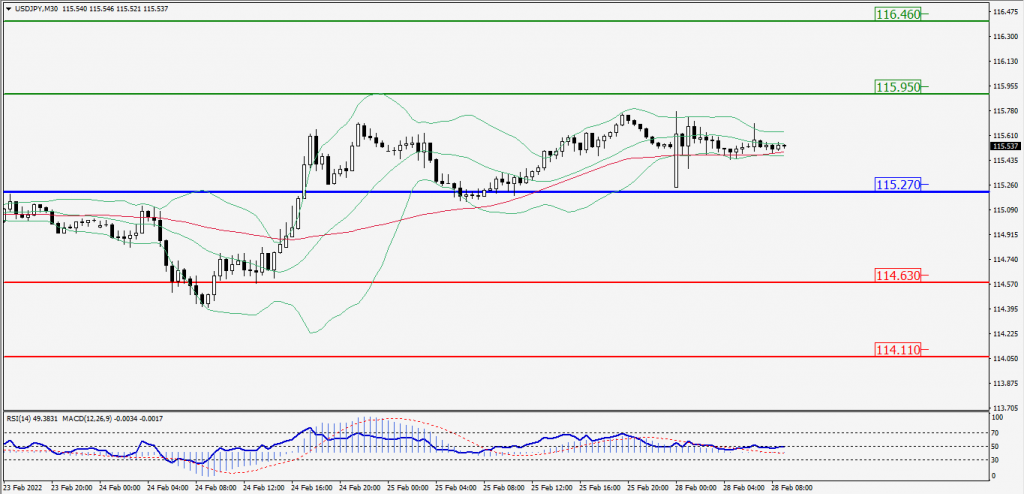
Green Lines Indicate Resistance Levels – Red Lines Indicates Support Levels
Light Blue is a Pivot Point – Black represents the price when the report was produced
AUD/USD Intraday: Trend may reverse
Our pivot point is at 0.72260
Preferable Price Action: Sell Positions Below pivot with targets at 0.71710 & 0.71250 in extension.
Alternative Price Action: Above pivot looks for a further Upside with 0.72790 & 0.73250 as targets.
Comment: Pair Above 20MA and RSI above 50 levels.
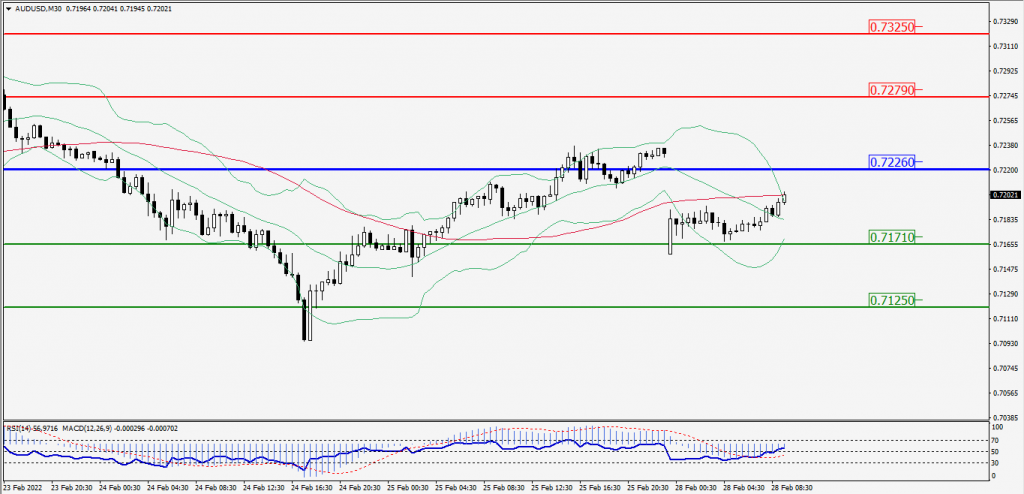
Green Lines Indicate Resistance Levels – Red Lines Indicates Support Levels
Light Blue is a Pivot Point – Black represents the price when the report was produced
CRUDEOIL Intraday: The trend may reverse from here
Our pivot point is at 94.15
Preferable Price Action: Above pivots Buy Oil with 96.15 & 97.90 as targets.
Alternative Price Action: Sell crude Below pivot with targets at 91.95 and 90.25 in extension.
Comment: MACD is in the Positive territory and Pair Above 55MA.
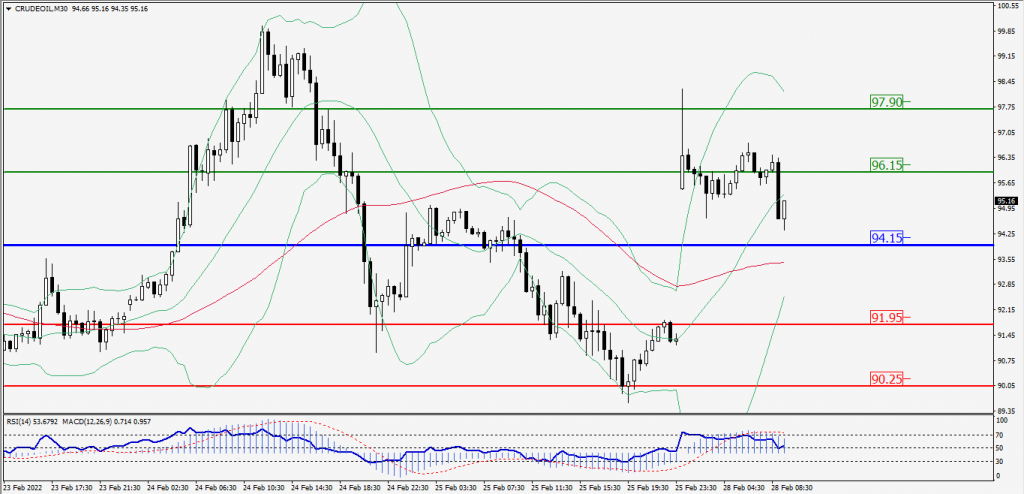
Green Lines Indicate Resistance Levels – Red Lines Indicates Support Levels
Light Blue is a Pivot Point – Black represents the price when the report was produced
XAU/USD Intraday: Trend may reverse
Our pivot point is 1912.40
Preferable Price Action: Further Downside to 1886.10 and 1864.10.
Alternative Price Action: If the price gives an Upside breakout of a pivot, then the price extends to 1937.40 and 1959.20.
Comment: MACD is a Negative territory And Price Below its 20MA & 55MA.
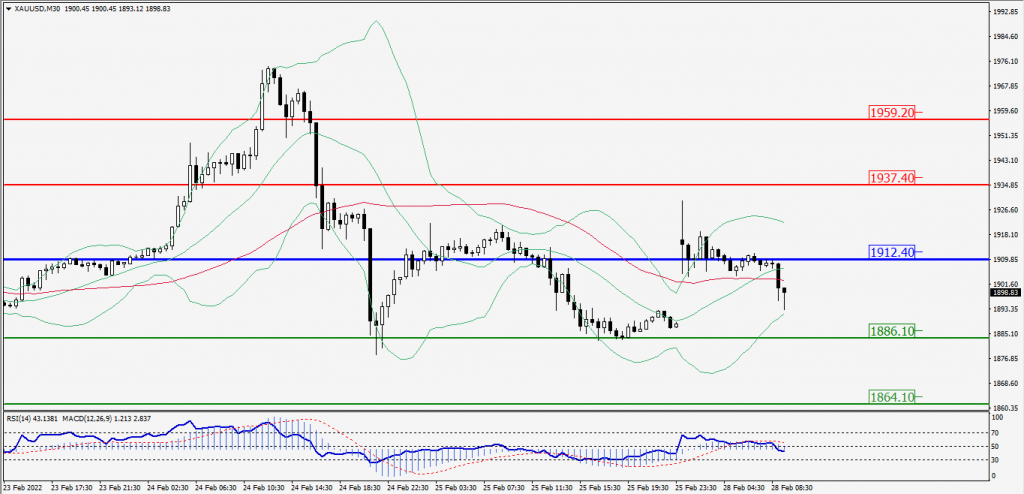
Green Lines Indicate Resistance Levels – Red Lines Indicates Support Levels
Light Blue is a Pivot Point – Black represents the price when the report was produced
Dow Jones Intraday: Trend On the Upside
Our pivot point is 33,233.00
Preferable Price Action: Take Long positions Above pivot with targets at 34,121.00 & 34,881.00.
Alternative Price Action: Below 33,233.00 looks for further Downside to 32,317.00 & 31,548.00.
Comment: Price Above 55MA and RSI above 50 levels.
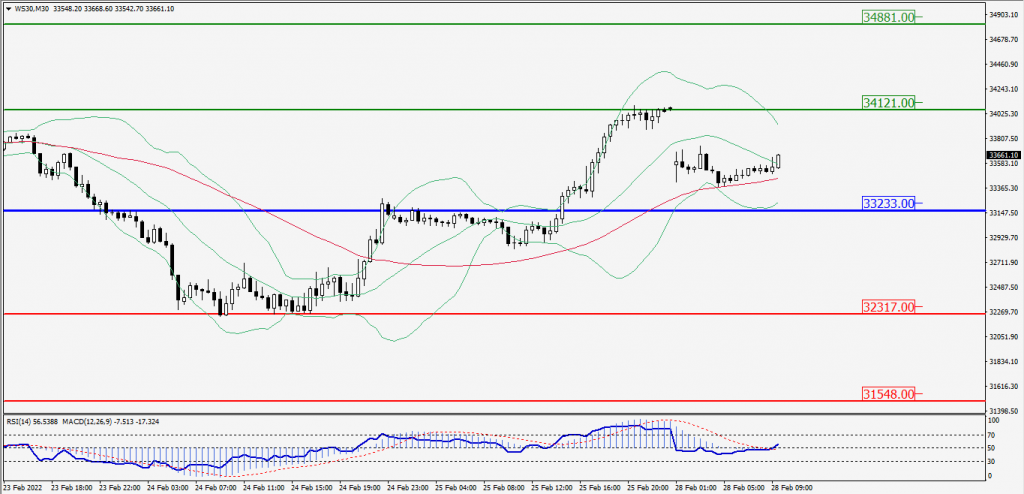
Green Lines Indicate Resistance Levels – Red Lines Indicates Support Levels
Light Blue is a Pivot Point – Black represents the price when the report was produced