Market Wrap: Stocks, Bonds, Commodities
US stocks ended sharply higher on Thursday, led by a 3 percent gain in the Nasdaq, in a dramatic market reversal as US President Joe Biden unveiled harsh new sanctions against Russia after Moscow began an all-out invasion of Ukraine.
The S&P 500 Gain (1.50%) ended at 4,288.70 points, while the Nasdaq Composite rose 3.34% to 13,473.58. The Dow Jones Industrial was Up 0.28% to 33,223.83.
MSCI’s index of Asia-Pacific stocks outside Japan is climbed 0.78%, to 744.50 levels. Australian index Surged 0.10% to 6,997.80. Japanese Nikkei Index collects 1.95% to 26,476.50.
European stocks were Positive on Friday, with the Stoxx Europe 50 Index rose 1.21% to 3.875.35 Germany’s DAX gain 1.37% to 14,244.49, and France’s CAC pulled Up 0.93% to 6,581.40, and U.K.’s FTSE 100 collected 0.91% to 7,272.60.
Benchmark 10-year U.S. Treasury fell as demand for safe assets lost again, today 10-year bond yields a negative 1.951.
Oil futures pulled back from multi-year records after Russia’s invasion of Ukraine and responses from other countries. US crude settled up 0.77 percent at $92.81 per barrel, but well below its session high of $100.54 and Brent settled up 2.3 percent at $99.08 compared with its session high of $105.79.
Spot Brent crude oil rose 2.45% to $97.76 per barrel. US West Texas Intermediate crude up 2.20% to $94.85 a barrel.
The yellow metal gold is descendded 0.51% to 1,916.50 dollars per ounce.
Market Wrap: Forex
The dollar was down on Friday morning in Asia, and the euro attempted to claw back its losses from the previous day. The Russian invasion of Ukraine on Thursday hit the single currency hard, and investors fled towards safe-haven assets including the dollar, Japanese yen, and Swiss franc.
Today, the U.S. dollar index measures the Redback against a trade-weighted basket of six major currencies, which is lost 0.22% today to 96.905.
The Euro US Dollar (EUR/USD) is a widely traded pair that is positive today. This left the pair trading around $1.12100.
The Japanese yen was negative against the U.S. dollar on Friday as the stock down. Today USD/JPY is fell 0.24% to 115.250 level.
Another commodity-related currency positive against the U.S dollar, AUD/USD gained 0.61% to 0.72060, and NZD/USD collected 0.34% to 0.67140 level.
EUR/USD Intraday: Trend may reverse from here
Our pivot point is at 1.11790
Preferable Price Action: Take Long positions Above pivot level with targets at 1.12440 & 1.12990 in extension.
Alternative Price Action: Below pivot looks for a further Downside to 1.11150 & 1.10600.
Comment: RSI Above 50 levels and Pair Above 55MA.
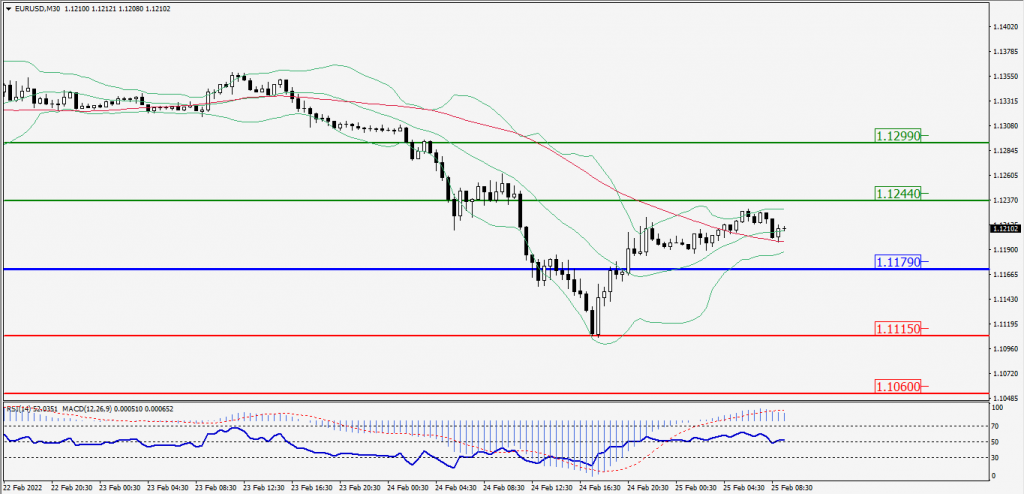
Green Lines Indicate Resistance Levels – Red Lines Indicates Support Levels
Light Blue is a Pivot Point – Black represents the price when the report was produced
GBP/USD Intraday: Trend may reverse
Our pivot point is at 1.33870
Preferable Price Action: Buy positions Above pivot with targets at 1.34540 & 1.35110 in extension.
Alternative Price Action: The price Below pivot would call for further Downside to 1.33170 & 1.32600.
Comment: RSI Above 50 levels and Pair Above its 55MA & 20MA.
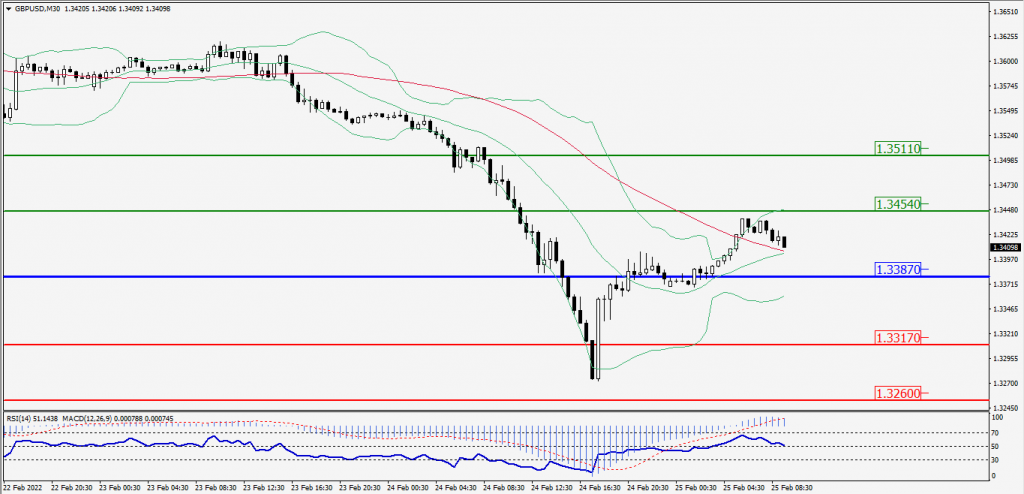
Green Lines Indicate Resistance Levels – Red Lines Indicates Support Levels
Light Blue is a Pivot Point – Black represents the price when the report was produced
USD/JPY Intraday: Support Level at 115.010
Our pivot point is at 115.010
Preferable Price Action: Buy position Above pivot with the target at 115.550 and 115.990 in extension.
Alternative Price Action: The Downside breakout of the pivot would call for 114.460 and 114.020.
Comment: MACD in Negative territory and Pair Above 55MA.
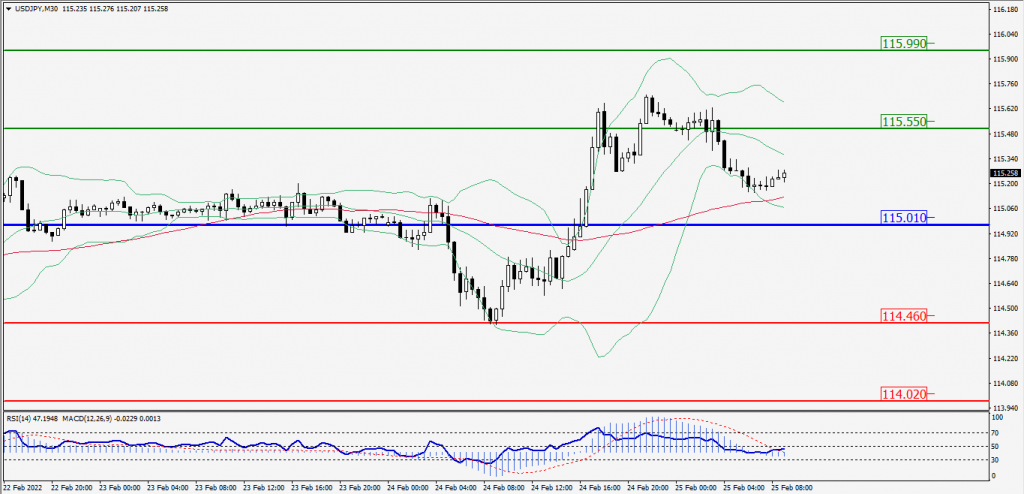
Green Lines Indicate Resistance Levels – Red Lines Indicates Support Levels
Light Blue is a Pivot Point – Black represents the price when the report was produced
AUD/USD Intraday: Trend on the Upside
Our pivot point is at 0.71820
Preferable Price Action: Buy Positions Above pivot with targets at 0.72320 & 0.72740 in extension.
Alternative Price Action: Below pivot looks for a further Downside with 0.71330 & 0.70920 as targets.
Comment: Pair Above its 20MA & 55MA and RSI above 50 levels.
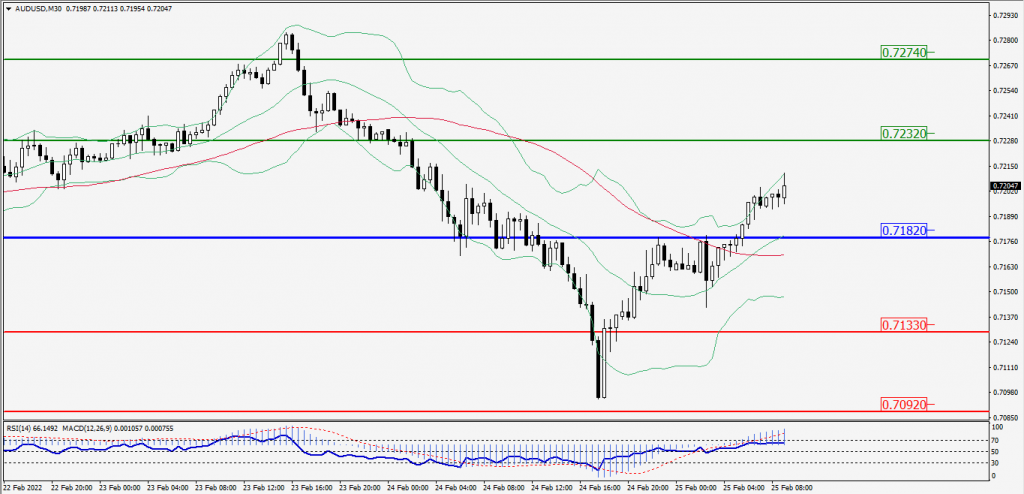
Green Lines Indicate Resistance Levels – Red Lines Indicates Support Levels
Light Blue is a Pivot Point – Black represents the price when the report was produced
CRUDEOIL Intraday: Resistance Leve at 95.25
Our pivot point is at 95.25
Preferable Price Action: Below pivots Sell Oil with 93.25 & 91.60 as targets.
Alternative Price Action: Buy crude Above pivot with targets at 97.15 and 98.80 in extension.
Comment: MACD is in the Negative territory and Pair Below 55MA.
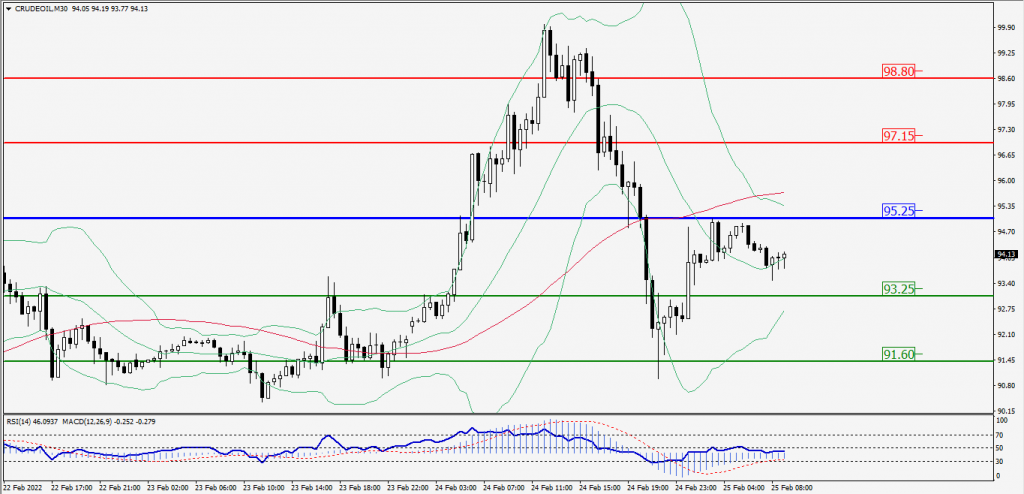
Green Lines Indicate Resistance Levels – Red Lines Indicates Support Levels
Light Blue is a Pivot Point – Black represents the price when the report was produced
XAU/USD Intraday: In a Consolidation Zone
Our pivot point is 1928.70
Preferable Price Action: Further Downside to 1908.60 and 1891.50.
Alternative Price Action: If the price gives an Upside breakout of a pivot, then the price extends to 1948.80 and 1965.50.
Comment: MACD is a Neutral territory And Price Below 55MA.
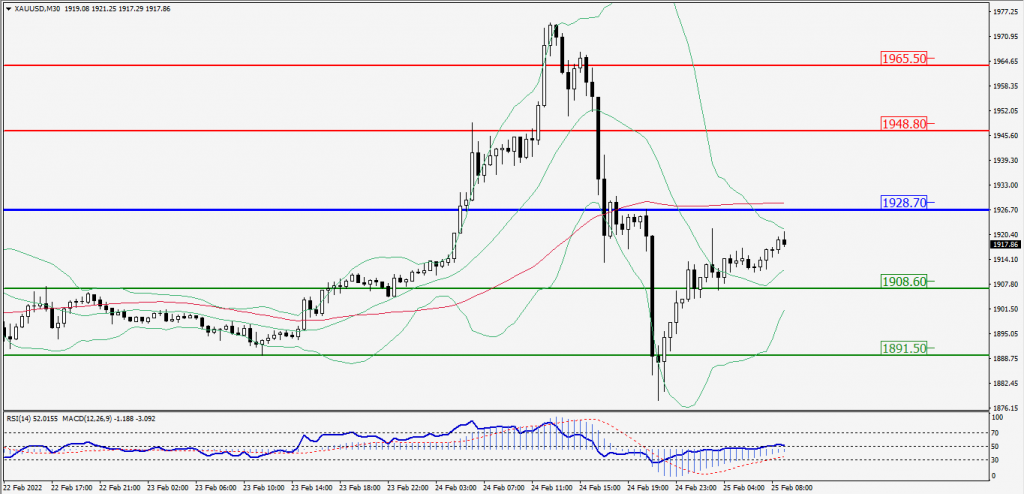
Green Lines Indicate Resistance Levels – Red Lines Indicates Support Levels
Light Blue is a Pivot Point – Black represents the price when the report was produced
Dow Jones Intraday: Trend On the Upside
Our pivot point is 32,747.00
Preferable Price Action: Take Long positions Above pivot with targets at 33,470.00 & 34,076.00.
Alternative Price Action: Below 32,747.00 looks for further Downside to 32,002.00 & 31,382.00.
Comment: Price Above 55MA and RSI above 50 levels.
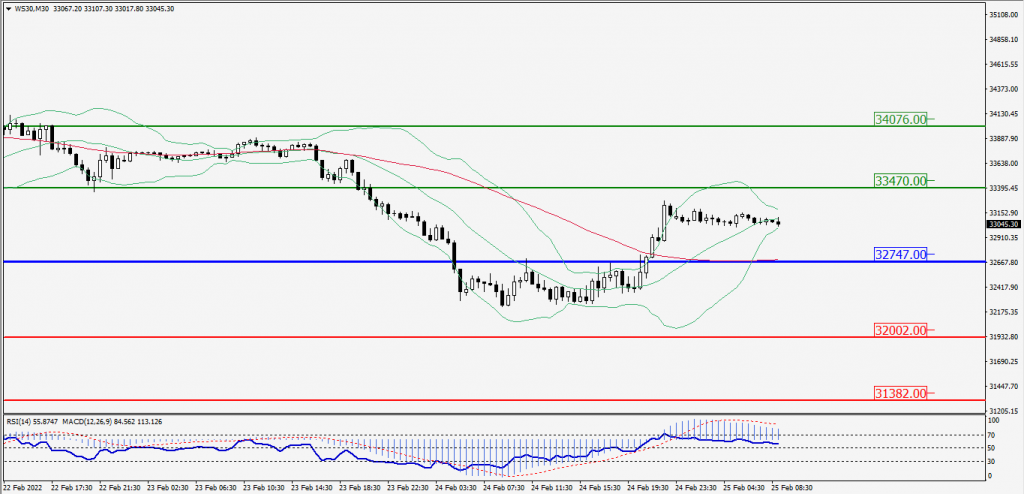
Green Lines Indicate Resistance Levels – Red Lines Indicates Support Levels
Light Blue is a Pivot Point – Black represents the price when the report was produced