Market Wrap: Stocks, Bonds, Commodities
The S&P 500 index closed modestly lower on Tuesday, largely recovering from a sharp sell-off, as US plans to close its Kyiv embassy in Ukraine sent simmering geopolitical tensions to a boil. All three major US stock indices dropped sharply after US Secretary of State Antony Blinken announced the relocation of US diplomatic operations to western Ukraine, in a possible sign of an imminent Russian invasion.
The S&P 500 Lost (0.38%) ended at 4,401.67 points, while the Nasdaq Composite down 0.03% to 13,790.92. The Dow Jones Industrial was fell 0.49% to 34,566.17.
MSCI’s index of Asia-Pacific stocks outside Japan is Down 0.41%, to 770.11 levels. Australian index down 0.51% to 7,206.90. Japanese Nikkei Index fell 0.79% to 26,865.19
European stocks were Mixed on Tuesday, with the Stoxx Europe 50 Index fell 0.14% to 4,058.65 Germany’s DAX fell 0.25% to 15,076.16, and France’s CAC pulled down 0.05% to 6,848.98, and U.K.’s FTSE 100 gain 0.03% to 7,533.85.
Benchmark 10-year U.S. Treasury descend as demand for safe assets fell again, today 10-year bond yields negative 0.69% to 1.982.
Oil prices surged over 2 percent on Tuesday to their highest in more than seven years as Ukraine’s president declared a “day of unity” for February 16, a date that some western media have cited as a possible start of a Russian invasion.
Spot Brent crude oil fell 0.73% to $95.78 per barrel. US West Texas Intermediate crude down 0.78% to $94.72 a barrel.
The yellow metal gold gains 0.57% to 1,880.10 dollars per ounce.
Market Wrap: Forex
The dollar was down on Tuesday morning in Asia, while geopolitical tensions over Ukraine weighed on the euro. However, the debate on how aggressively the U.S. should hike interest rate capped the dollar’s losses.
Today, the U.S. dollar index measures the redback against a trade-weighted basket of six major currencies, which is lost 0.13% today 96.277.
The Euro US Dollar (EUR/USD) is a widely traded pair that is positive today. This left the pair trading around $1.13120.
The Japanese yen was Weak against the U.S. dollar on Tuesday as the stock down. Today USD/JPY is lost 0.16% at the 115.340 level.
Another commodity-related currency Mixed against the U.S dollar, AUD/USD lost 0.24% to 0.71080, and NZD/USD flat 0.66170 level.
EUR/USD Intraday: Trend on the Major Downside
Our pivot point is at 1.13630
Preferable Price Action: Take Short positions Below pivot level with targets at 1.12750 & 1.12170 in extension.
Alternative Price Action: Above pivot looks for a further Upside to 1.14490 & 1.15090.
Comment: Pair above 20MA and RSI above 50 levels.
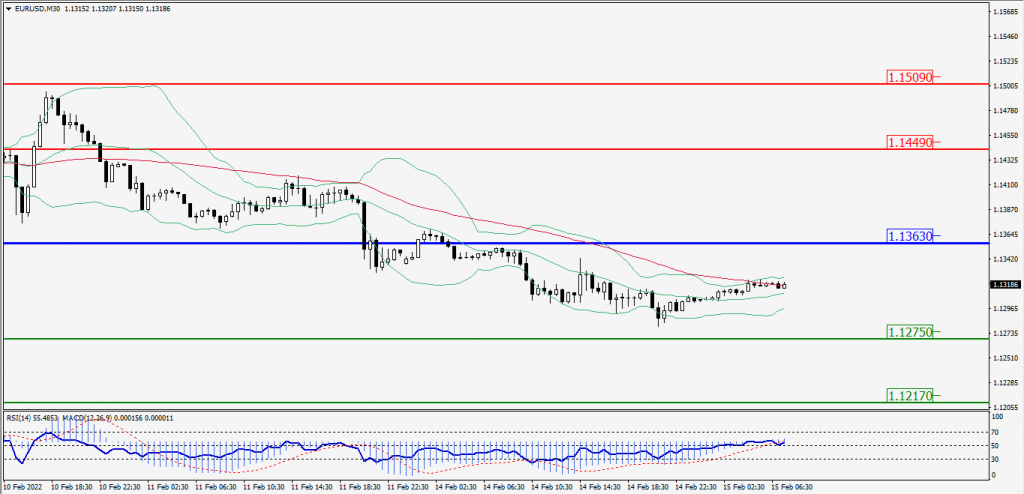
Green Lines Indicate Resistance Levels – Red Lines Indicates Support Levels
Light Blue is a Pivot Point – Black represents the price when the report was produced
GBP/USD Intraday: Major Support Level at 1.35070
Our pivot point is at 1.35070
Preferable Price Action: Buy positions Above pivot with targets at 1.35640 & 1.36110 in extension.
Alternative Price Action: The price Below pivot would call for further Downside to 1.34510 & 1.34040.
Comment: RSI below 50 levels.
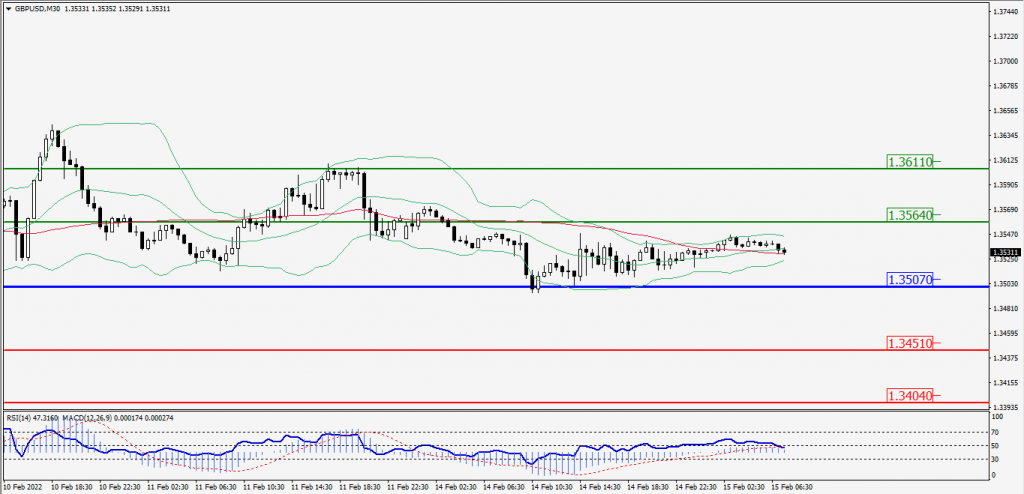
Green Lines Indicate Resistance Levels – Red Lines Indicates Support Levels
Light Blue is a Pivot Point – Black represents the price when the report was produced
USD/JPY Intraday: In a Consolidation Zone
Our pivot point is at 115.510
Preferable Price Action: Sell position Below pivot with the target at 115.200 and 114.990 in extension.
Alternative Price Action: The Upside breakout of the pivot would call for 115.810 and 116.020.
Comment: MACD in Negative territory and Pair Below its 20MA & 55MA.
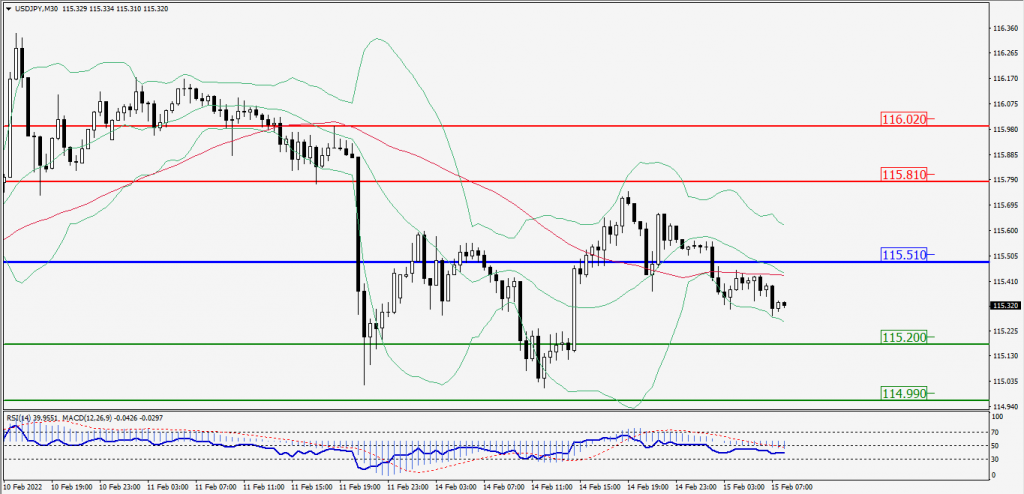
Green Lines Indicate Resistance Levels – Red Lines Indicates Support Levels
Light Blue is a Pivot Point – Black represents the price when the report was produced
AUD/USD Intraday: Resistance Level at 0.71390
Our pivot point is at 0.71390
Preferable Price Action: Sell Positions Below pivot with targets at 0.70770 & 0.70360 in extension.
Alternative Price Action: Above pivot looks for a further Upside with 0.71990 & 0.72410 as targets.
Comment: Pair Below its 20MA & 55MA and RSI below 50 levels.
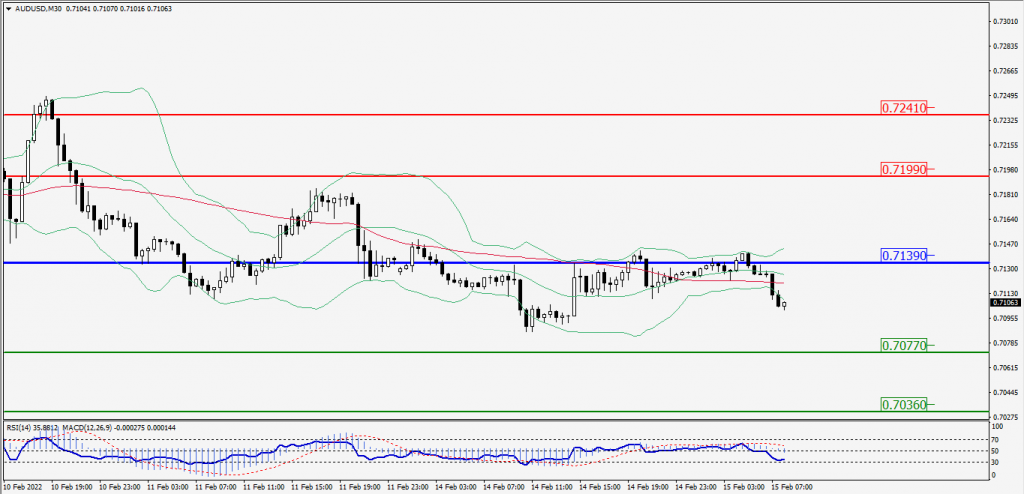
Green Lines Indicate Resistance Levels – Red Lines Indicates Support Levels
Light Blue is a Pivot Point – Black represents the price when the report was produced
CRUDEOIL Intraday: Trend on the Upside
Our pivot point is at 92.50
Preferable Price Action: Above pivots Buy Oil with 93.55 & 94.45 as targets.
Alternative Price Action: Sell crude Below pivot with targets at 91.40 and 90.50 in extension.
Comment: MACD is in the Positive territory and Pair Above 55MA.
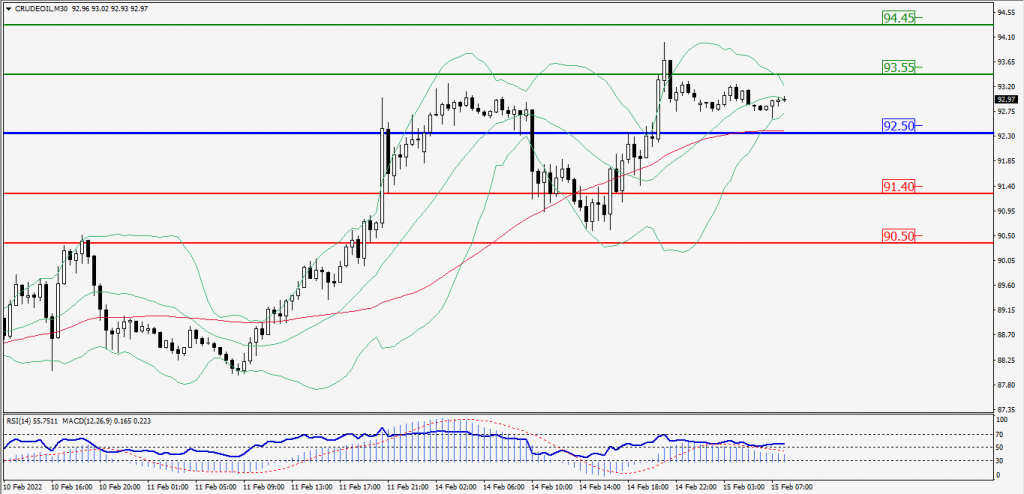
Green Lines Indicate Resistance Levels – Red Lines Indicates Support Levels
Light Blue is a Pivot Point – Black represents the price when the report was produced
XAU/USD Intraday: Trend on the Major Upside
Our pivot point is 1870.90
Preferable Price Action: Further Upside to 1889.80 and 1904.60.
Alternative Price Action: If the price gives a Downside breakout of a pivot, then the price extends to 1851.90 and 1836.80.
Comment: MACD is a Positive territory And Price Above its 20MA & 55MA.
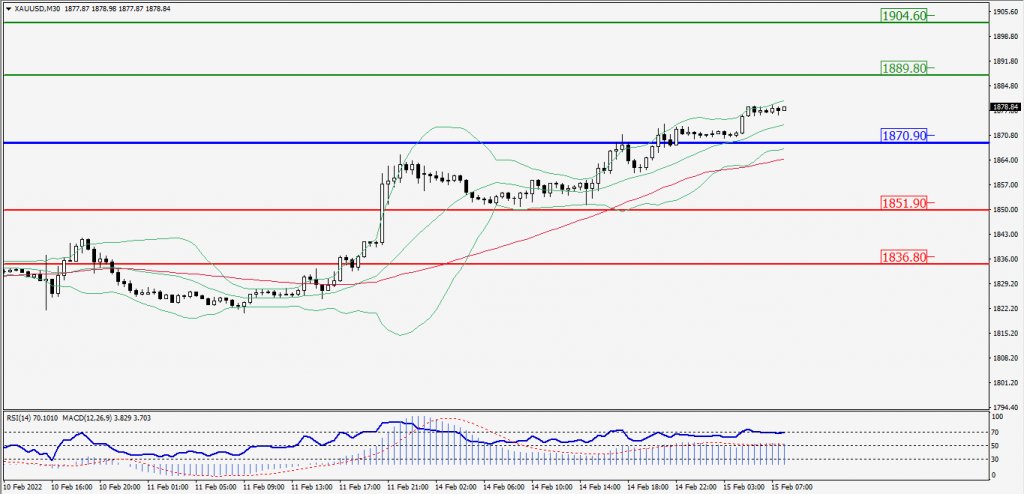
Green Lines Indicate Resistance Levels – Red Lines Indicates Support Levels
Light Blue is a Pivot Point – Black represents the price when the report was produced
Dow Jones Intraday: Trend on the Major Downside
Our pivot point is 34,677.00
Preferable Price Action: Take Short positions Below pivot with targets at 34,334.00 & 34,056.00.
Alternative Price Action: Above 34,677.00 looks for further Upside to 35,019.00 & 35,297.00.
Comment: RSI below 50 levels And Price Below its 20MA & 55MA.
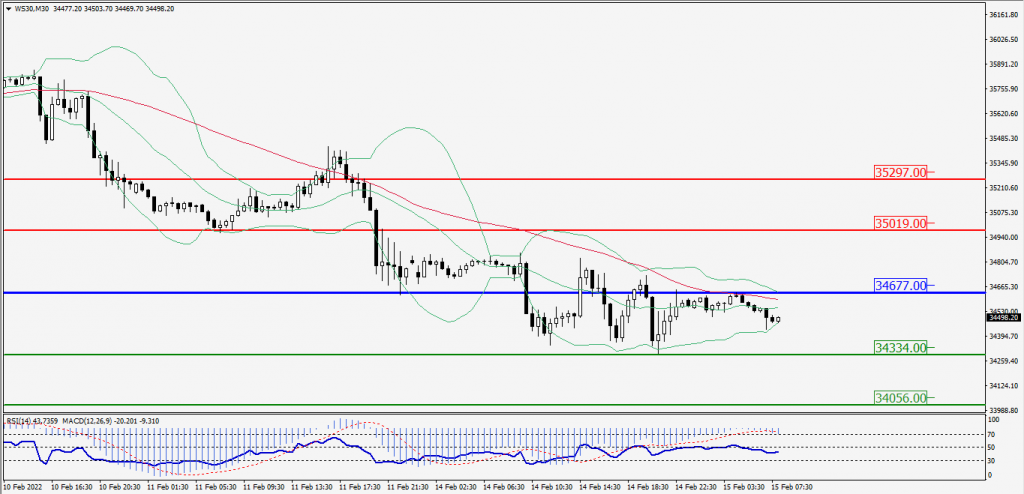
Green Lines Indicate Resistance Levels – Red Lines Indicates Support Levels
Light Blue is a Pivot Point – Black represents the price when the report was produced