Market Wrap: Stocks, Bonds, Commodities
Wall Street jumped on Wednesday, closing sharply higher as megacap growth stocks powered up thanks to a pause in rising interest rates, and upbeat earnings reports also encouraged investors to buy.
The S&P 500 Collect (1.45%) ended at 4,587.18 points, while the Nasdaq Composite rose 2.08% to 14,490.40. The Dow Jones Industrial was rise 0.86% to 35,768.06.
MSCI’s index of Asia-Pacific stocks outside Japan is up 0.65%, to 792.22 levels. Australian index rose 0.28% to 7,288.50. Japanese Nikkei Index up 0.42% to 27,696.08.
European stocks were Positive on Thursday, with the Stoxx Europe 50 Index collected 0.47% to 4,223.95 Germany’s DAX surged 0.48% to 15,555.60, and France’s CAC pulled up 0.27% to 7,150.25, and U.K.’s FTSE 100 higher 0.34% to 7,669.22.
Benchmark 10-year U.S. Treasury ascend as demand for safe assets gain again, today 10-year bond yields rose 0.35% to 1.934.
Oil prices were mixed on Thursday, after rallying on an unexpected drop in US crude inventories in the previous session, as investors await the outcome of US-Iran nuclear talks that could add crude supplies quickly to global markets.
Spot Brent crude oil rose 0.20% to $91.73 per barrel. US West Texas Intermediate crude up 0.29% to $89.92 a barrel.
The yellow metal gold lost 0.15% to 1,833.85 dollars per ounce.
Market Wrap: Forex
The U.S. dollar traded largely unchanged Thursday with the focus on the release of the latest U.S. inflation report later in the day which should provide clues about the pace of the Federal Reserve’s policy tightening.
Today, the U.S. dollar index measures the redback against a trade-weighted basket of six major currencies, which is gain 0.3% today 95.520.
The Euro US Dollar (EUR/USD) is a widely traded pair that is positive today. This left the pair trading around $1.14330.
The Japanese yen was strong against the U.S. dollar on Thursday as the stock up. Today USD/JPY is collected 0.09% at the 115.590 level.
Another commodity-related currency positive against the U.S dollar, AUD/USD get 0.20% to 0.71920, and NZD/USD constructed 0.19% to 0.66940 level.
EUR/USD Intraday: In a Consolidation Zone
Our pivot point is at 1.14320
Preferable Price Action: Take Short positions Below pivot level with targets at 1.14150 & 1.13990 in extension.
Alternative Price Action: Above pivot looks for a further Upside to 1.14490 & 1.14650.
Comment: Pair Below 55MA and RSI below 50 levels.
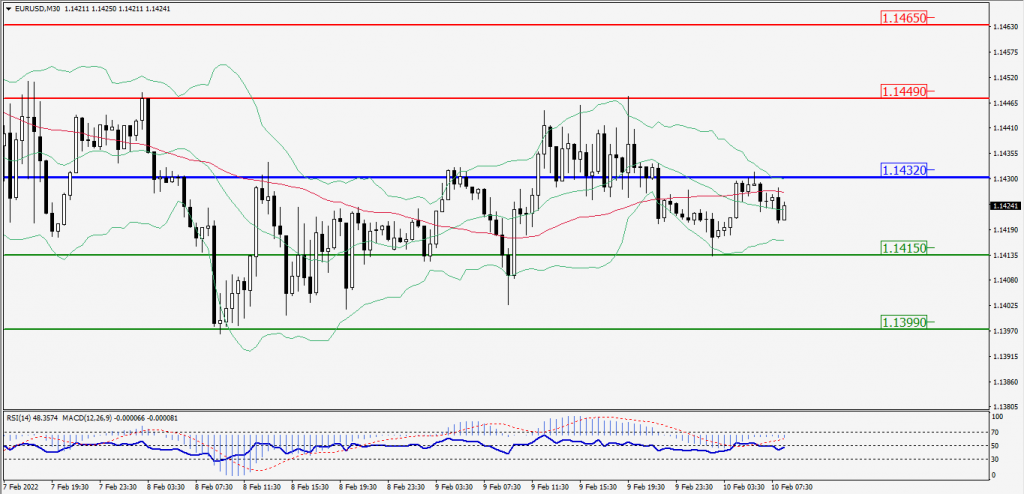
Green Lines Indicate Resistance Levels – Red Lines Indicates Support Levels
Light Blue is a Pivot Point – Black represents the price when the report was produced
GBP/USD Intraday: Resistance Level at 1.35590
Our pivot point is at 1.35590
Preferable Price Action: Sell positions Below pivot with targets at 1.35250 & 1.34920 in extension.
Alternative Price Action: The price Above pivot would call for further Upside to 1.35930 & 1.36260.
Comment: RSI above 50 levels and Pair below 55MA.
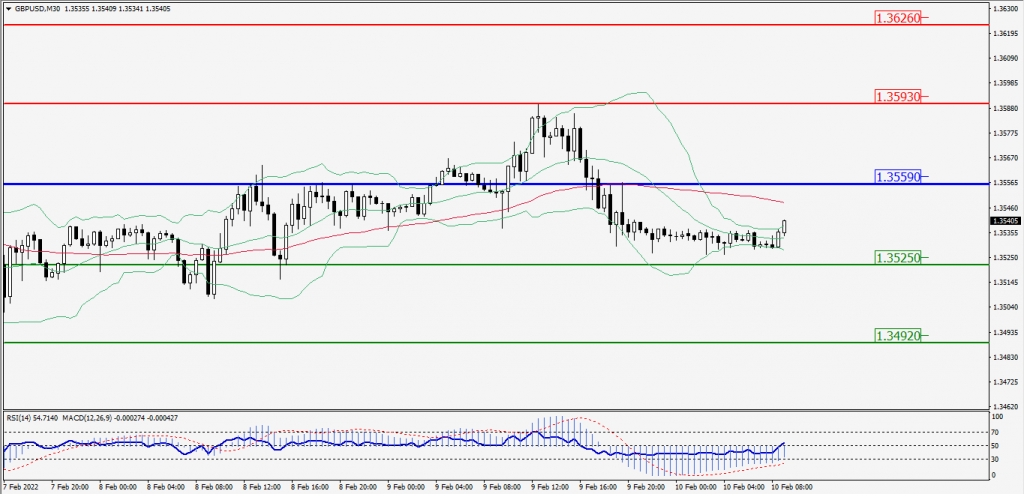
Green Lines Indicate Resistance Levels – Red Lines Indicates Support Levels
Light Blue is a Pivot Point – Black represents the price when the report was produced
USD/JPY Intraday: Trend on the Upside
Our pivot point is at 115.560
Preferable Price Action: Buy position Above pivot with the target at 115.840 and 116.060 in extension.
Alternative Price Action: The Downside breakout of the pivot would call for 115.280 and 115.060.
Comment: MACD in Positive territory and Pair Above its 20MA & 55MA.
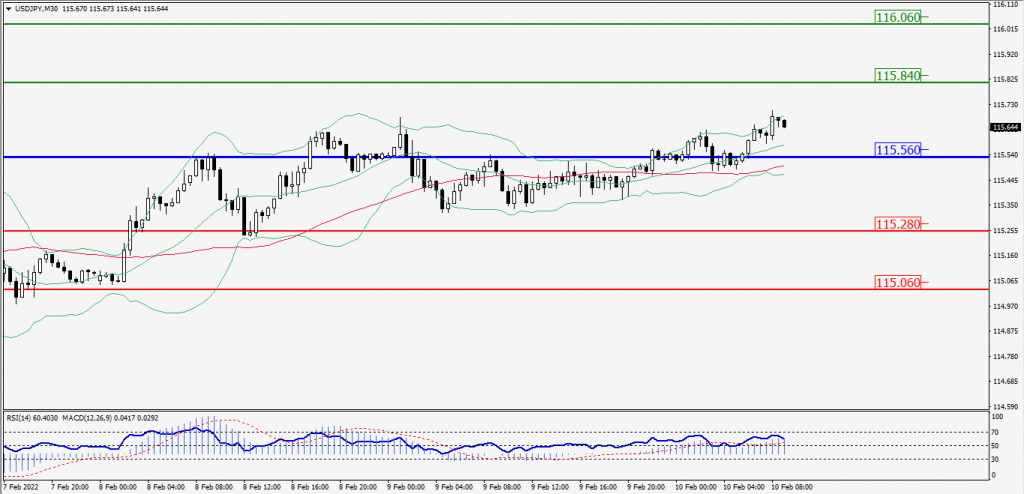
Green Lines Indicate Resistance Levels – Red Lines Indicates Support Levels
Light Blue is a Pivot Point – Black represents the price when the report was produced
AUD/USD Intraday: Trend on the Major Upside
Our pivot point is at 0.71610
Preferable Price Action: Buy Positions Above pivot with targets at 0.71940 & 0.72210 in extension.
Alternative Price Action: Below pivot looks for a further Downside with 0.71280 & 0.71010 as targets.
Comment: RSI above 50 levels.
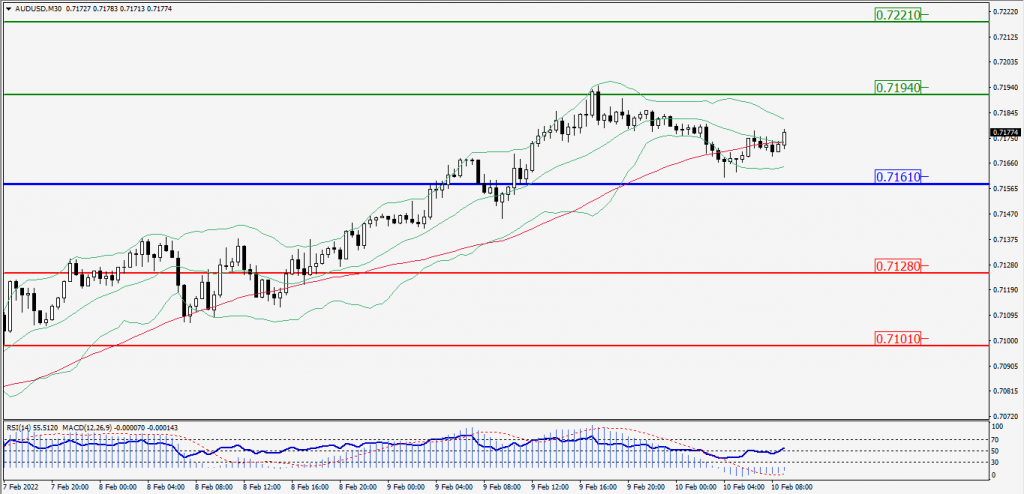
Green Lines Indicate Resistance Levels – Red Lines Indicates Support Levels
Light Blue is a Pivot Point – Black represents the price when the report was produced
CRUDEOIL Intraday: Trend on the Downside
Our pivot point is at 89.20
Preferable Price Action: Below pivots Sell Oil with 87.95 & 86.90 as targets.
Alternative Price Action: Buy crude Above pivot with targets at 90.45 and 91.50 in extension.
Comment: MACD is in the Negative territory and Pair Below 20MA.
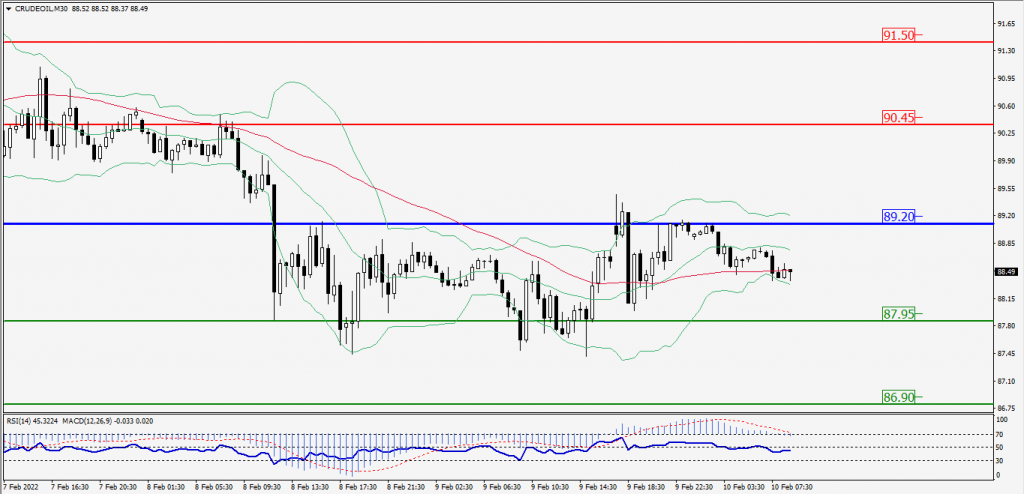
Green Lines Indicate Resistance Levels – Red Lines Indicates Support Levels
Light Blue is a Pivot Point – Black represents the price when the report was produced
XAU/USD Intraday: Support Level at 1828.50
Our pivot point is 1828.50
Preferable Price Action: Further Upside to 1841.70 and 1852.30.
Alternative Price Action: If the price gives a Downside breakout of a pivot, then the price extends to 1815.30 and 1804.70.
Comment: MACD is a positive territory And Price Above its 55MA & 20MA.
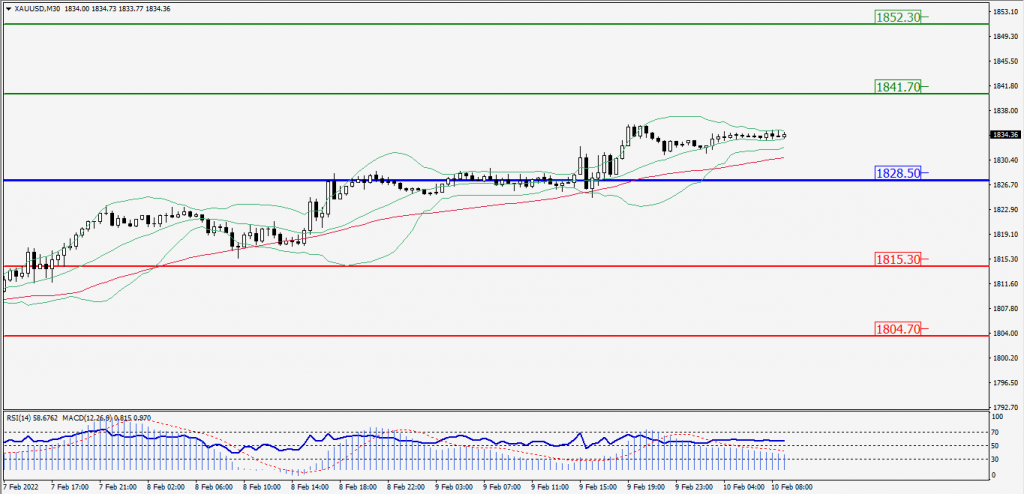
Green Lines Indicate Resistance Levels – Red Lines Indicates Support Levels
Light Blue is a Pivot Point – Black represents the price when the report was produced
Dow Jones Intraday: Trend on the Upside
Our pivot point is 35,662.00
Preferable Price Action: Take Long positions Above pivot with targets at 35,940.00 & 36,196.00.
Alternative Price Action: Below 35,662.00 looks for further Downside to 35,384.00 & 35,128.00.
Comment: RSI above 50 levels And Price Above 55MA.
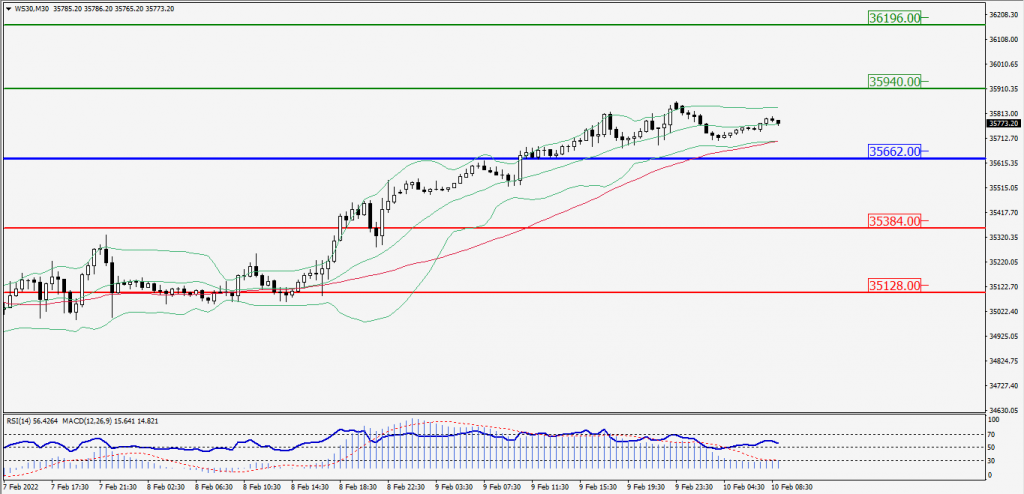
Green Lines Indicate Resistance Levels – Red Lines Indicates Support Levels
Light Blue is a Pivot Point – Black represents the price when the report was produced