Market Wrap: Stocks, Bonds, Commodities
Wall Street snapped a four-session winning streak on Friday, with all three benchmarks ending lower after Facebook-owner Meta Platforms’ dour forecast sent its stock plummeting and halted a nascent recovery built on upbeat earnings from other big tech.
The S&P 500 Lost (2.44%) ended at 4,477.44 points, while the Nasdaq Composite fell 3.74% to 13,878.80. The Dow Jones Industrial was slipped 1.45% reach 35,111.16.
MSCI’s index of Asia-Pacific stocks outside Japan is up 1.26%, to 776.13 levels. Australian index gathered 0.60% to 7,120.20. Japanese Nikkei Index rose 0.73% to 27,439.99.
European stocks were mixed on Friday, with the Stoxx Europe 50 Index fell 0.48% to 4,121.15 Germany’s DAX drop 0.82% to 15,241.76, and France’s CAC pulled down 0.17% to 6,993.72, and U.K.’s FTSE 100 higher 0.48% to 7,565.15.
Benchmark 10-year U.S. Treasury ascend as demand for safe assets gain again, today 10-year bond yields rise 0.22% to 1.831.
Oil prices edged higher on Friday, maintaining the market’s upward trajectory built on expectations that supply will continue to tighten even after OPEC+ producers stuck to planned moderate output increases.
Spot Brent crude oil rose 1.10% to $92.11 per barrel. US West Texas Intermediate crude up 1.17% to $91.33 a barrel.
The yellow metal gold Accept 0.27% to 1,809.05 dollars per ounce.
Market Wrap: Forex
The U.S. dollar weakened Friday, as strong gains in U.S. equity futures diluted the need for the safe haven and after a hawkish turn by the European Central Bank boosted the single currency.
Today, the U.S. dollar index measures the redback against a trade-weighted basket of six major currencies, which is lost 0.04% at 96.340.
The Euro US Dollar (EUR/USD) is a widely traded pair that is positive today. This left the pair trading around $1.14580.
The Japanese yen was strong against the U.S. dollar on Friday as the stock up. Today USD/JPY is collected 0.11% at the 115.080 level.
Another commodity-related currency negative against the U.S dollar, AUD/USD fell 0.45% to 0.71080, and NZD/USD deconstructed 0.21 to 0.66440 level.
EUR/USD Intraday: Trend on the Upside
Our pivot point is at 1.14270
Preferable Price Action: Take Long positions Above pivot level with targets at 1.14980 & 1.15570 in extension.
Alternative Price Action: Below pivot looks for a further Downside to 1.13560 & 1.12970.
Comment: Pair Above its 20MA & 55MA and RSI above 50 levels.
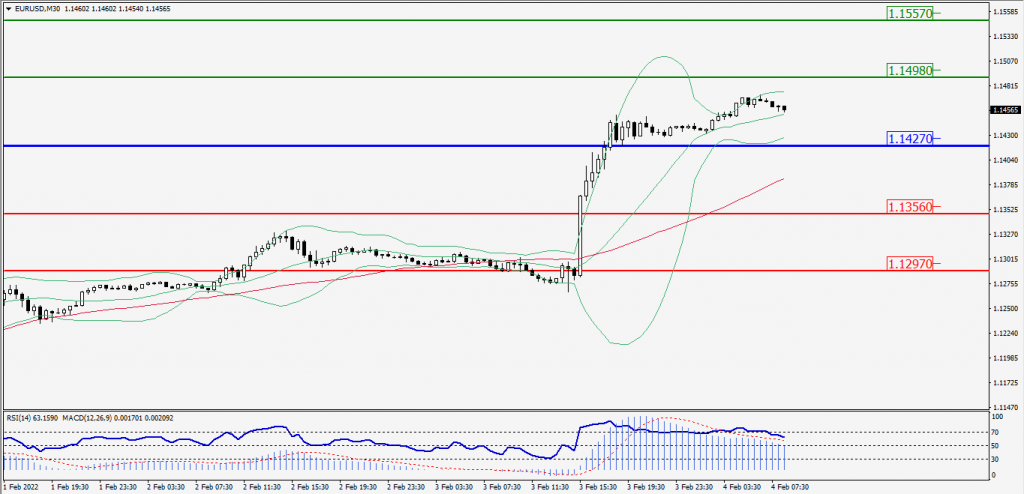
Green Lines Indicate Resistance Levels – Red Lines Indicates Support Levels
Light Blue is a Pivot Point – Black represents the price when the report was produced
GBP/USD Intraday: In a Consolidation Zone
Our pivot point is at 1.35770
Preferable Price Action: Buy positions Above pivot with targets at 1.36310 & 1.36780 in extension.
Alternative Price Action: The price Below pivot would call for further Downside to 1.35230 & 1.34760.
Comment: RSI below 50 levels and Pair below 20MA.
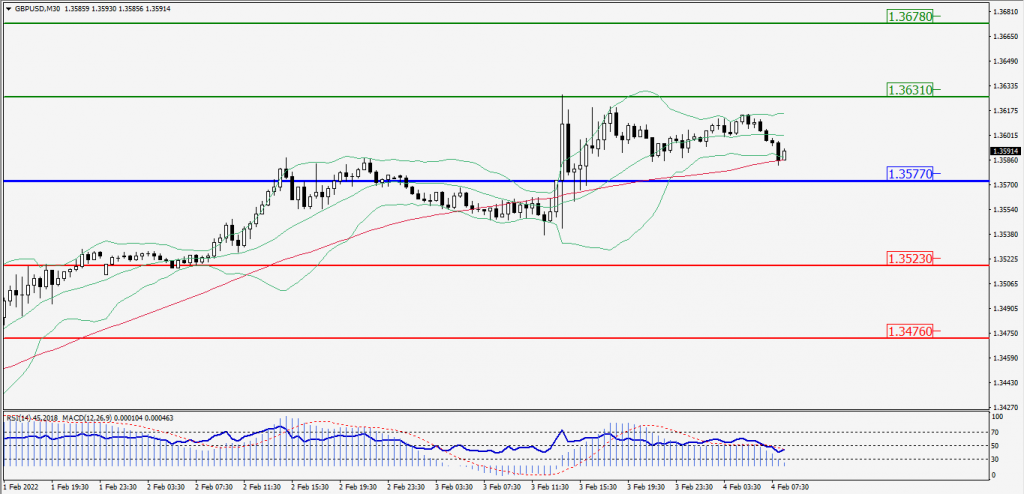
Green Lines Indicate Resistance Levels – Red Lines Indicates Support Levels
Light Blue is a Pivot Point – Black represents the price when the report was produced
USD/JPY Intraday: Major Support at 114.820
Our pivot point is at 114.820
Preferable Price Action: Buy position Above pivot with the target at 115.170 and 115.490 in extension.
Alternative Price Action: The Downside breakout of the pivot would call for 114.470 and 114.150.
Comment: MACD in positive territory and Pair Above its 20MA & 55MA.
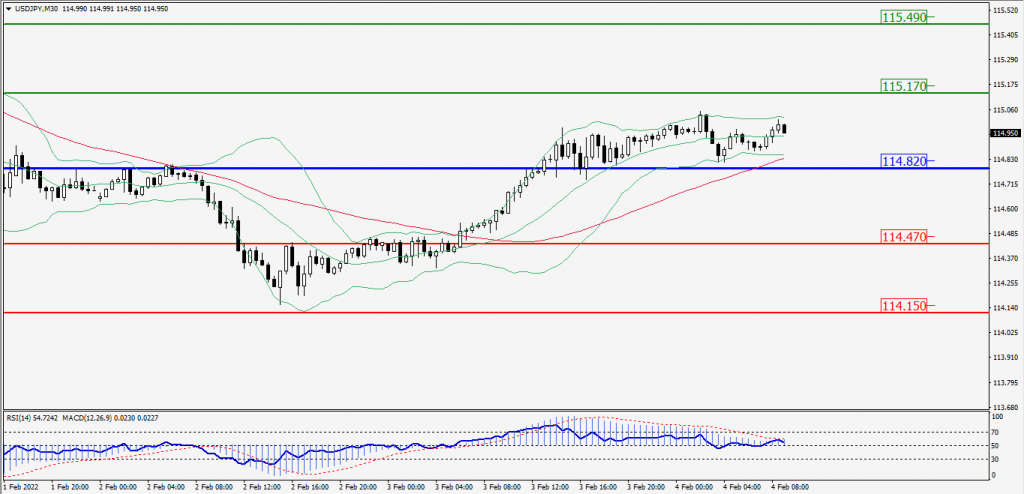
Green Lines Indicate Resistance Levels – Red Lines Indicates Support Levels
Light Blue is a Pivot Point – Black represents the price when the report was produced
AUD/USD Intraday: Resistance Level at 0.71510
Our pivot point is at 0.71510
Preferable Price Action: Sell Positions Below pivot with targets at 0.71110 & 0.70780 in extension.
Alternative Price Action: Above pivot looks for a further Upside with 0.71910 & 0.72240 as targets.
Comment: Pair below its 20MA & 55MA and RSI below 50 levels.
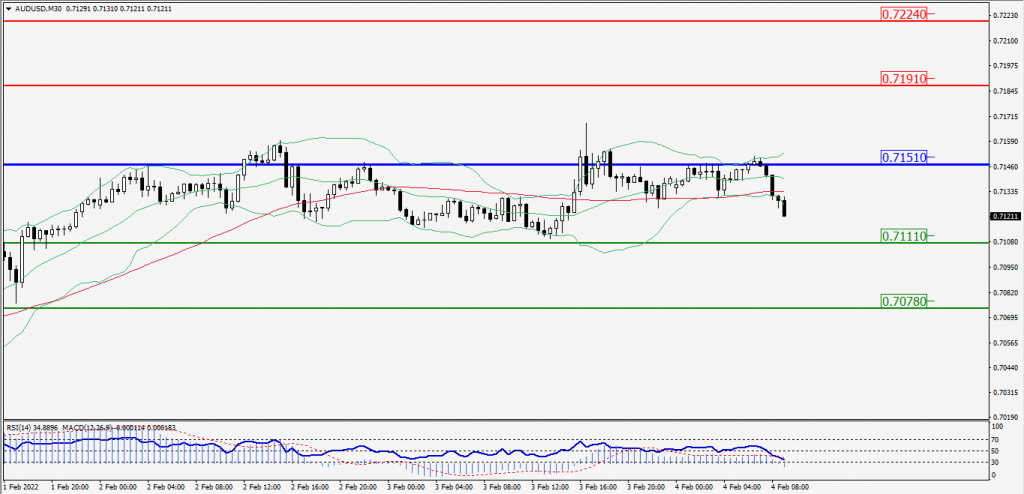
Green Lines Indicate Resistance Levels – Red Lines Indicates Support Levels
Light Blue is a Pivot Point – Black represents the price when the report was produced
CRUDEOIL Intraday: Trend on the Upside
Our pivot point is at 89.10
Preferable Price Action: Above pivots Buy Oil with 90.15 & 91.05 as targets.
Alternative Price Action: Sell crude Below pivot with targets at 88.05 and 87.15 in extension.
Comment: MACD is in the Positive territory and Pair Above its 20MA & 55MA.
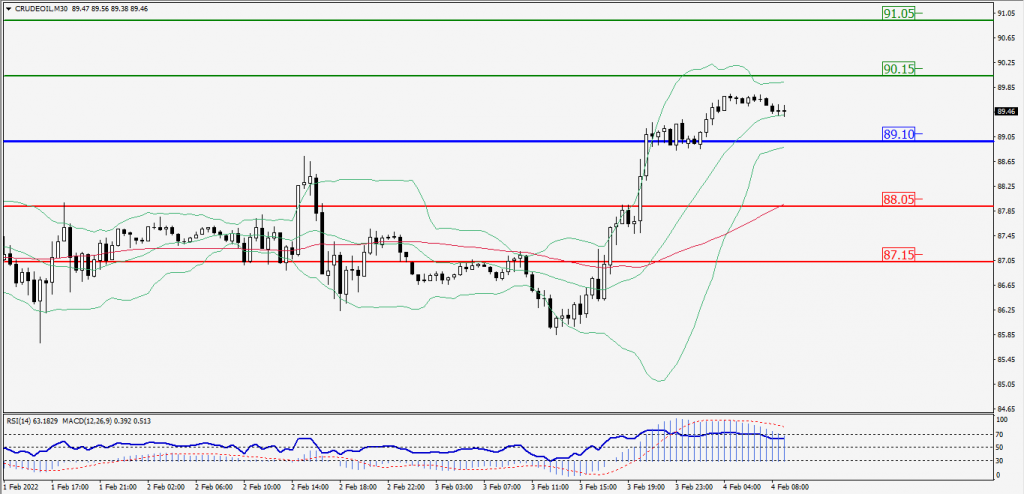
Green Lines Indicate Resistance Levels – Red Lines Indicates Support Levels
Light Blue is a Pivot Point – Black represents the price when the report was produced
XAU/USD Intraday: Major support at 1804.10
Our pivot point is 1804.10
Preferable Price Action: Further Upside to 1811.70 and 1818.00.
Alternative Price Action: If the price gives a Downside breakout of a pivot, then the price extends to 1796.50 and 1790.20.
Comment: MACD is a Positive territory And Price Below its 20MA & 55MA.
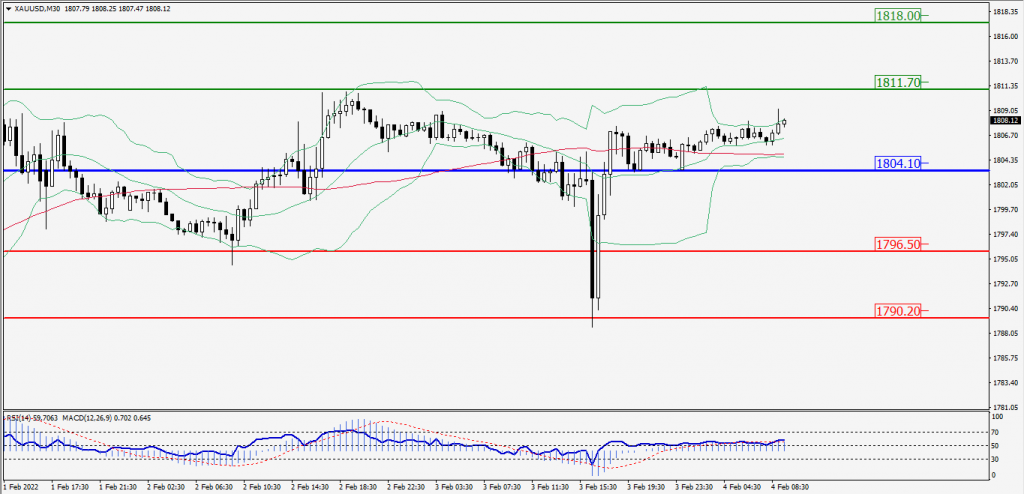
Green Lines Indicate Resistance Levels – Red Lines Indicates Support Levels
Light Blue is a Pivot Point – Black represents the price when the report was produced
Dow Jones Intraday: Trend on the Downside
Our pivot point is 35,476.00
Preferable Price Action: Take Short positions Below pivot with targets at 35,160.00 & 34,900.00.
Alternative Price Action: Above 35,476.00 looks for further Upside to 35,792.00 & 36,052.00.
Comment: RSI below 50 levels And price is Below 55MA.
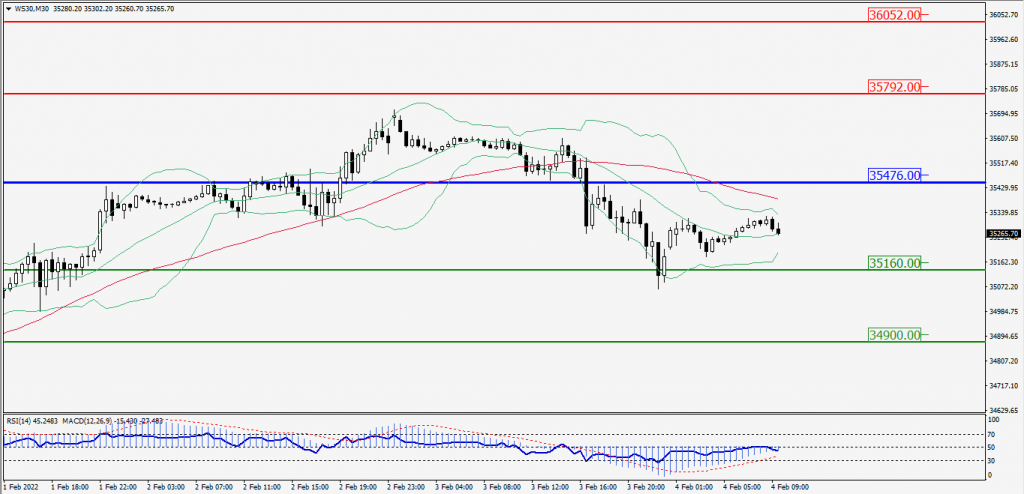
Green Lines Indicate Resistance Levels – Red Lines Indicates Support Levels
Light Blue is a Pivot Point – Black represents the price when the report was produced