Market Wrap: Stocks, Bonds, Commodities
Wall Street surged on Monday, notching its best day so far in 2022 after another zigzag session, ending a tumultuous week marked by mixed corporate earnings, geopolitical turmoil and an increasingly aggressive Federal Reserve.
The S&P 500 Gain (2.43%) ended at 4,431.85 points, while the Nasdaq Composite rose 3.13% to 13,770.60. The Dow Jones Industrial was climbed 1.65% reach 34,725.47.
MSCI’s index of Asia-Pacific stocks outside Japan is up 0.73%, to 760.78 levels. Australian index fell 0.24% to 6,971.60. Japanese Nikkei Index collects 1.07% to 27,001.98.
European stocks were positive on Monday, with the Stoxx Europe 50 Index rose 1.22% to 4,187.25 Germany’s DAX lifted 1.28% to 15,514.91, and France’s CAC pulled upside 0.84% to 7,024.41, and U.K.’s FTSE 100 higher 0.48% to 7,501.60.
Benchmark 10-year U.S. Treasury ascend as demand for safe assets gains again, today 10-year bond yields rose 0.11% to 1.782.
Oil rose more than 1% on Monday to the near 7-year highs hit in the previous session, while supply concerns and political tension in Eastern Europe and the Middle East put prices on track for their biggest monthly gain in almost a year.
Spot Brent crude oil gained 0.85% to $89.27 per barrel. US West Texas Intermediate crude up 0.88% to $87.58 a barrel.
The yellow metal gold accepts 0.26% to 1,789.50 dollars per ounce.
Market Wrap: Forex
The U.S. dollar lurched lower on Monday, stepping back from a 1-1/2 year high tested on Friday, as hawkish comments over the weekend by a Federal Reserve official sent the U.S. yield curve to its flattest levels in three months.
Today, the U.S. dollar index measures the greenback against a trade-weighted basket of six major currencies, which is lay at 97.120.
The Euro US Dollar (EUR/USD) is a widely traded pair that is gained today. This left the pair trading around $1.11780.
The Japanese yen was strong against the U.S. dollar on Monday as the stock pulled. Today USD/JPY is rose 0.12% at the 115.380 level.
Another commodity-related currency positive against the U.S dollar, AUD/USD collect 0.84% to 0.70450, and NZD/USD constructed 0.70 to 0.65800 level.
EUR/USD Intraday: Trend on the Upside
Our pivot point is at 1.11440
Preferable Price Action: Take Long positions Above pivot level with targets at 1.12050 & 1.12640 in extension.
Alternative Price Action: Below pivot looks for a further Downside to 1.10830 & 1.10240.
Comment: Pair Above its 20MA & 55MA and RSI above 50 levels.
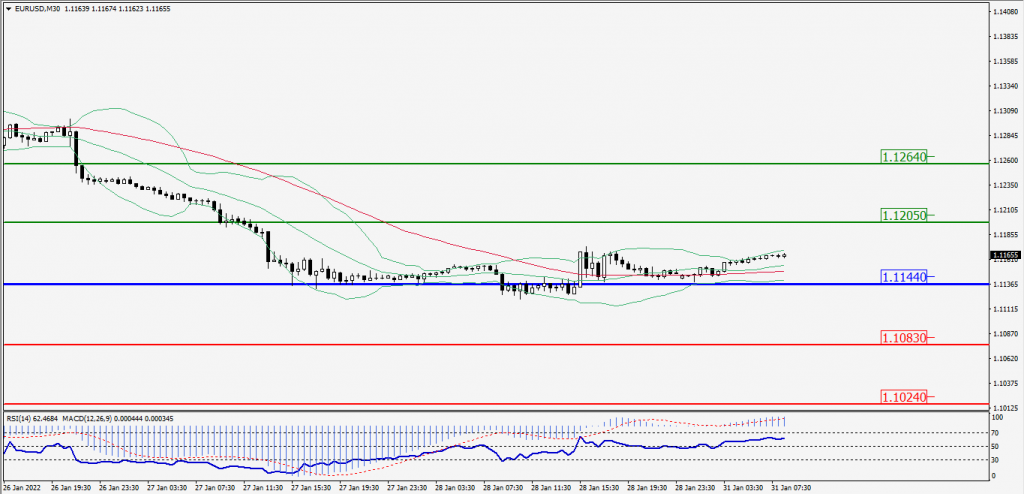
Green Lines Indicate Resistance Levels – Red Lines Indicates Support Levels
Light Blue is a Pivot Point – Black represents the price when the report was produced
GBP/USD Intraday: Trend on the Upside
Our pivot point is at 1.34030
Preferable Price Action: Buy positions Above pivot with targets at 1.34730 & 1.35320 in extension.
Alternative Price Action: The price Below pivot would call for further Downside to 1.33330 & 1.32740.
Comment: RSI above 50 levels and Pair Above its 20MA & 55MA.
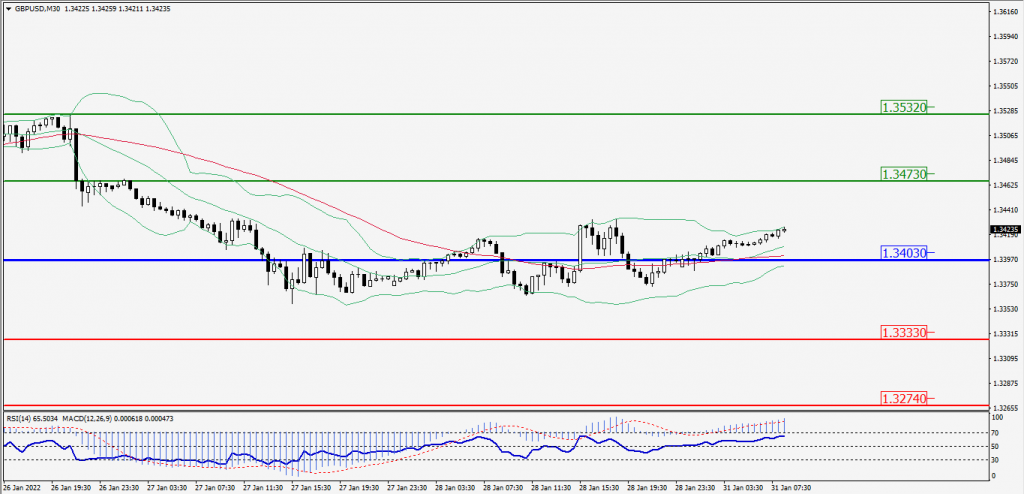
Green Lines Indicate Resistance Levels – Red Lines Indicates Support Levels
Light Blue is a Pivot Point – Black represents the price when the report was produced
USD/JPY Intraday: In a Consolidation zone
Our pivot point is at 115.240
Preferable Price Action: Buy position Above pivot with the target at 115.710 and 116.030 in extension.
Alternative Price Action: The Downside breakout of the pivot would call for 114.770 and 114.450.
Comment: MACD in neutral territory.
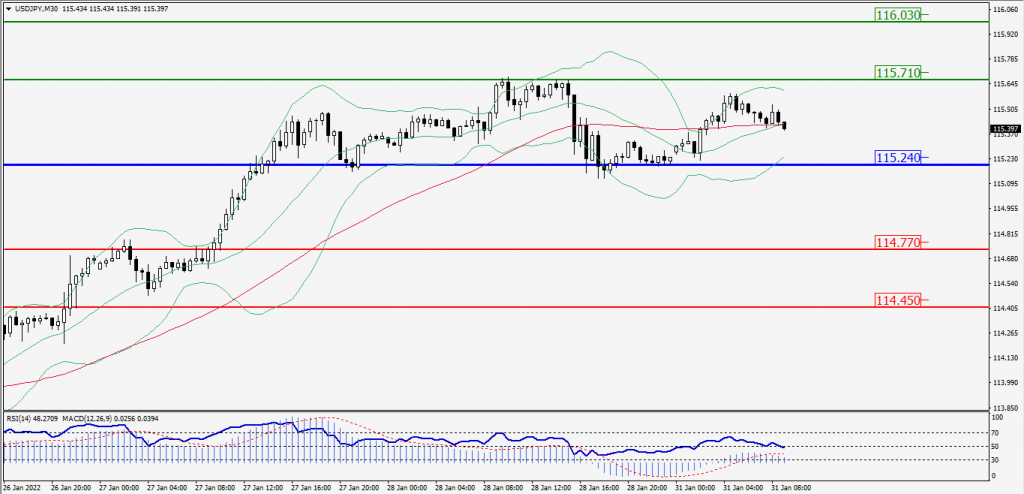
Green Lines Indicate Resistance Levels – Red Lines Indicates Support Levels
Light Blue is a Pivot Point – Black represents the price when the report was produced
AUD/USD Intraday: Trend on the upside
Our pivot point is at 0.70070
Preferable Price Action: Buy Positions Above pivot with targets at 0.70690 & 0.71170 in extension.
Alternative Price Action: Below pivot looks for a further Downside with 0.69450 & 0.68970 as targets.
Comment: Pair Above its 55MA & 20MA and RSI above 50 levels.
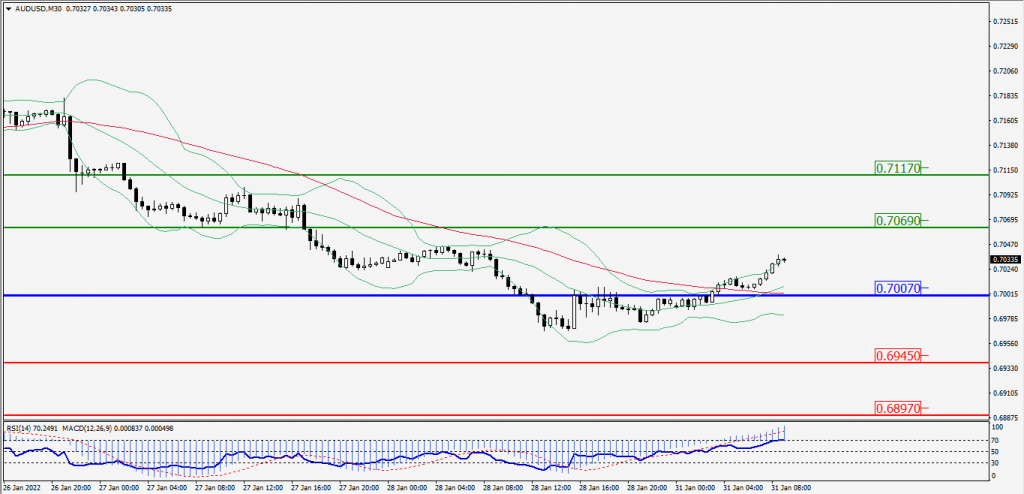
Green Lines Indicate Resistance Levels – Red Lines Indicates Support Levels
Light Blue is a Pivot Point – Black represents the price when the report was produced
CRUDEOIL Intraday: Major Support at 86.40
Our pivot point is at 86.40
Preferable Price Action: Above pivots Buy Oil with 88.25 & 89.55 as targets.
Alternative Price Action: Sell crude Below pivot with targets at 84.55 and 83.25 in extension.
Comment: MACD is in the Positive territory and Pair Above its 55MA & 20MA.
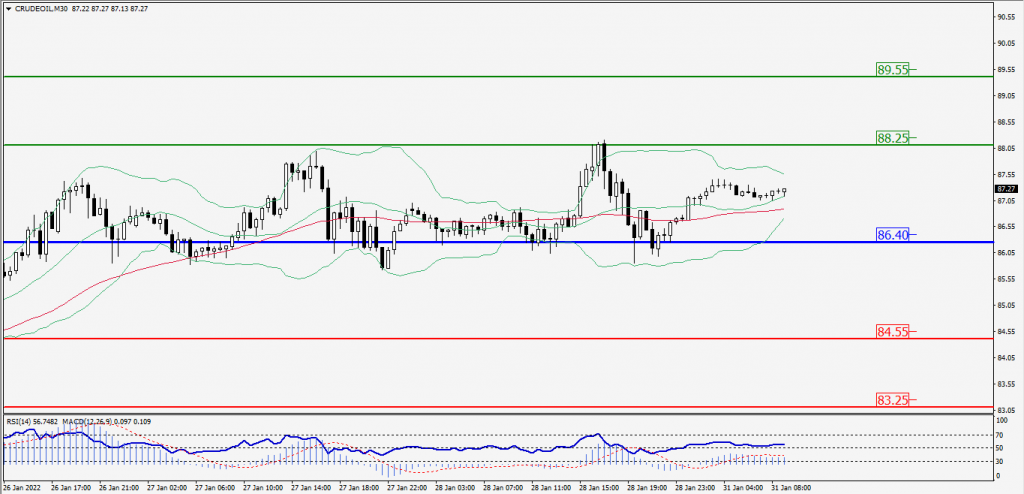
Green Lines Indicate Resistance Levels – Red Lines Indicates Support Levels
Light Blue is a Pivot Point – Black represents the price when the report was produced
XAU/USD Intraday: Major Trend on the Downside
Our pivot point is 1804.10
Preferable Price Action: Further Downside to 1774.60 and 1754.10.
Alternative Price Action: If the price gives an Upside breakout of a pivot, then the price extends to 1833.60 and 1854.10.
Comment: MACD is a Negative territory And Price Below 55MA.
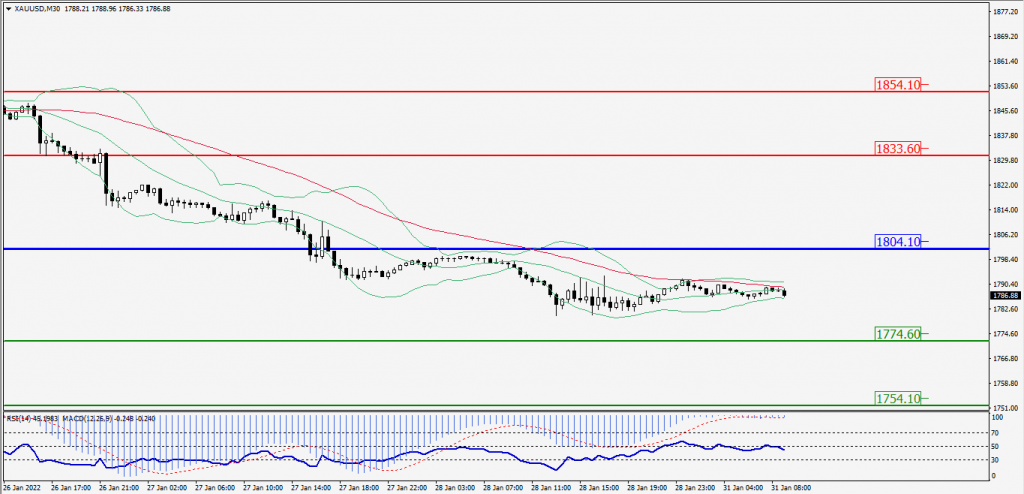
Green Lines Indicate Resistance Levels – Red Lines Indicates Support Levels
Light Blue is a Pivot Point – Black represents the price when the report was produced
Dow Jones Intraday: Support at 34,245.00
Our pivot point is 34,245.00
Preferable Price Action: Take Long positions Above pivot with targets at 35,319.00 & 36,228.00.
Alternative Price Action: Below 34,245.00 looks for further Downside to 33,171.00 & 32,262.00.
Comment: RSI above 50 levels And price is Above 55MA.
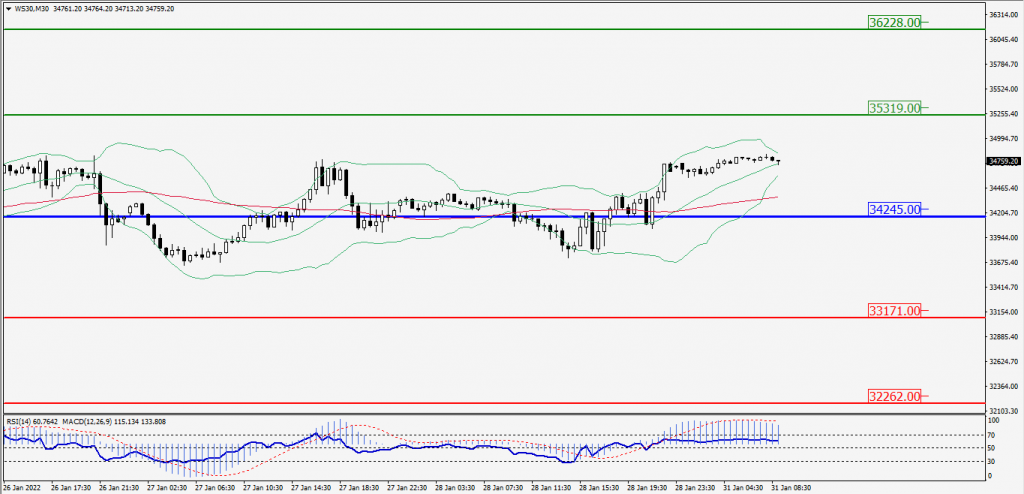
Green Lines Indicate Resistance Levels – Red Lines Indicates Support Levels
Light Blue is a Pivot Point – Black represents the price when the report was produced