Market Wrap: Stocks, Bonds, Commodities
US stock market was closed on Tuesday as a celebration of Martin Luther King day.
MSCI’s index of Asia-Pacific stocks outside Japan fell 0.60%, to 796.47 levels. Australian index down 0.11% to 7,408.80. Japanese Nikkei Index fell 0.27% to 28,257.25.
European stocks were negative on Tuesday, with the Stoxx Europe 50 Index lost 1.18% to 4,251.35 Germany’s DAX stair down 1.18% to 15,745.15, and France’s CAC fell 1.13% to 7,120.38, and U.K.’s FTSE 100 pulled down 0.33% to 7,586.30.
Benchmark 10-year U.S. Treasury ascend as demand for safe assets gains again, today 10-year bond yields rose to 3.20% to 1.829.
Oil prices rose on Tuesday with investors betting that global supply will remain tight, although restraint by major producers was partially offset by a rise in Libyan output.
Spot Brent crude oil gained 1.70% to $87.95 per barrel. US West Texas Intermediate crude up 2.06% to $85.02 a barrel.
The yellow metal gold is flat at 1,816.30 dollars per ounce.
Market Wrap: Forex
The dollar edged higher on Tuesday as traders continued to hold on to dollars but took the view that Federal Reserve tightening plans were largely priced in, while the euro eased from Friday’s two-month high.
Today, the U.S. dollar index measures the greenback against a trade-weighted basket of six major currencies, which is rose 0.05% to 95.300.
The Euro US Dollar (EUR/USD) is a widely traded pair that is lost today. This left the pair trading around $1.14000.
The Japanese yen rose against the U.S. dollar on Tuesday as the stock pushes the upper. Today USD/JPY is up 0.22% at 114.850 level.
Another commodity-related currency negative against the U.S dollar, AUD/USD lost 0.10% to 0.72030, and NZD/USD down 0.21% to 0.67830 level.
EUR/USD Intraday: Trend on The Downside
Our pivot point is at 1.14280
Preferable Price Action: Take Short positions below pivot level with targets at 1.13770 & 1.13360 in extension.
Alternative Price Action: Above pivot looks for a further Upside to 1.14790 & 1.15200.
Comment: Pair Below its 55MA & 20MA and RSI below 50 levels.
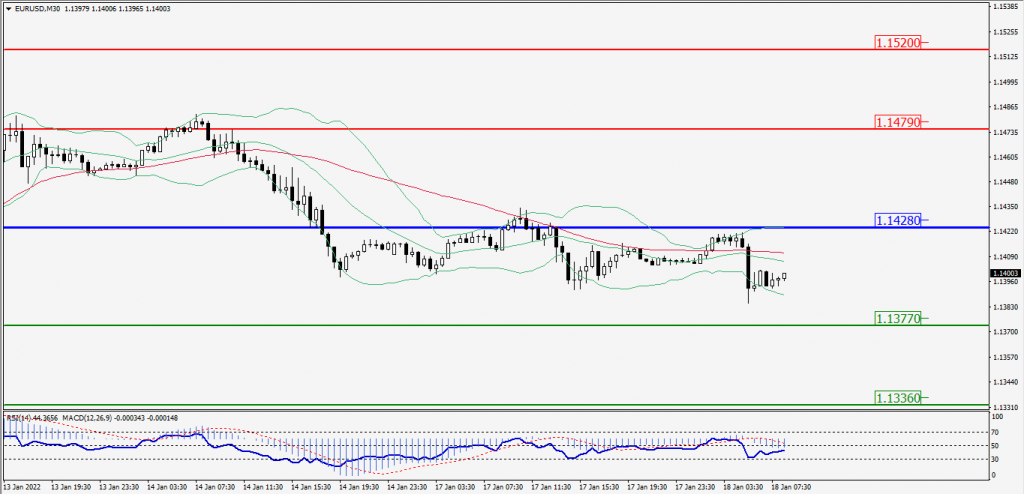
Green Lines Indicate Resistance Levels – Red Lines Indicates Support Levels
Light Blue is a Pivot Point – Black represents the price when the report was produced
GBP/USD Intraday: Major Resistance at 1.36780
Our pivot point is at 1.36780
Preferable Price Action: Sell positions Below pivot with targets at 1.36050 & 1.35510 in extension.
Alternative Price Action: The price Above pivot would call for further Upside to 1.37510 & 1.38050.
Comment: Pair Below its 55MA & 20MA and RSI below 50 levels.
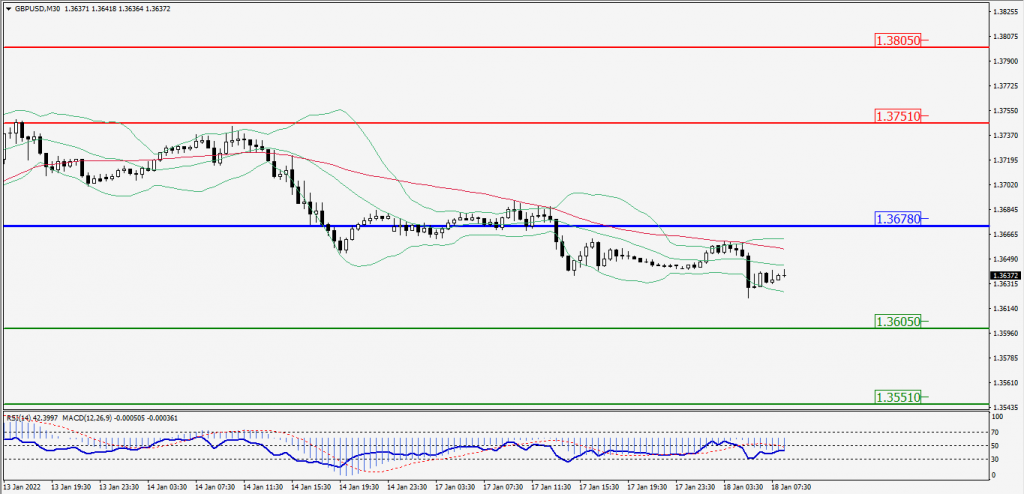
Green Lines Indicate Resistance Levels – Red Lines Indicates Support Levels
Light Blue is a Pivot Point – Black represents the price when the report was produced
USD/JPY Intraday: Major Support at 114.650
Our pivot point is at 114.650
Preferable Price Action: Buy position Above pivot with the target at 115.350 and 115.840 in extension.
Alternative Price Action: The Downside breakout of the pivot would call for 113.950 and 113.460.
Comment: Pair Above its 55MA & 20MA and MACD in positive territory.
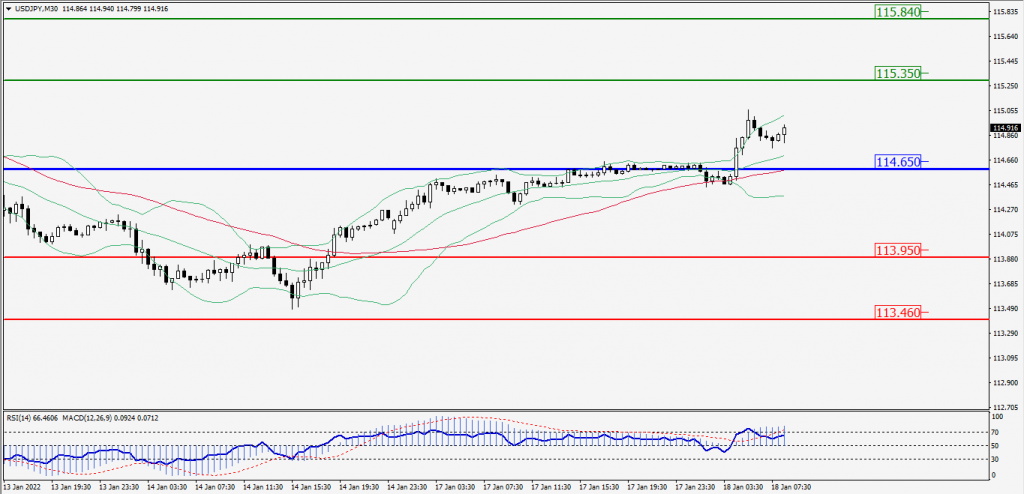
Green Lines Indicate Resistance Levels – Red Lines Indicates Support Levels
Light Blue is a Pivot Point – Black represents the price when the report was produced
AUD/USD Intraday: Major Trend on the Downside
Our pivot point is at 0.72300
Preferable Price Action: Sell Positions Below pivot with targets at 0.71710 & 0.71330 in extension.
Alternative Price Action: Above pivot looks for a further Upside with 0.72890 & 0.73270 as targets.
Comment: Pair Below its 55MA & 20MA and RSI below 50 levels.
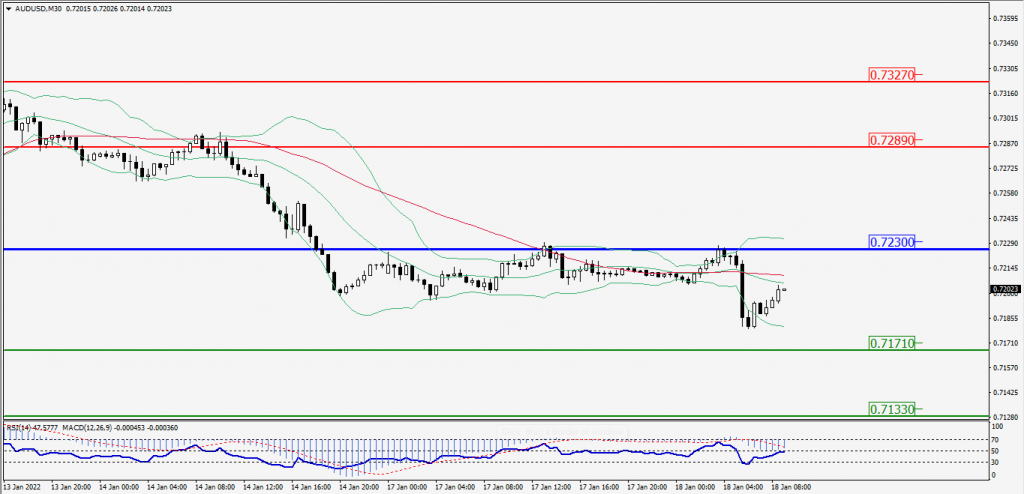
Green Lines Indicate Resistance Levels – Red Lines Indicates Support Levels
Light Blue is a Pivot Point – Black represents the price when the report was produced
CRUDEOIL Intraday: Strong Trend on the Upside
Our pivot point is at 84.05
Preferable Price Action: Above pivots Buy Oil with 86.10 & 87.65 as targets.
Alternative Price Action: Sell crude Below pivot with targets at 82.00 and 80.45 in extension.
Comment: Price Above its 55MA & 20MA and MACD is in the positive territory.
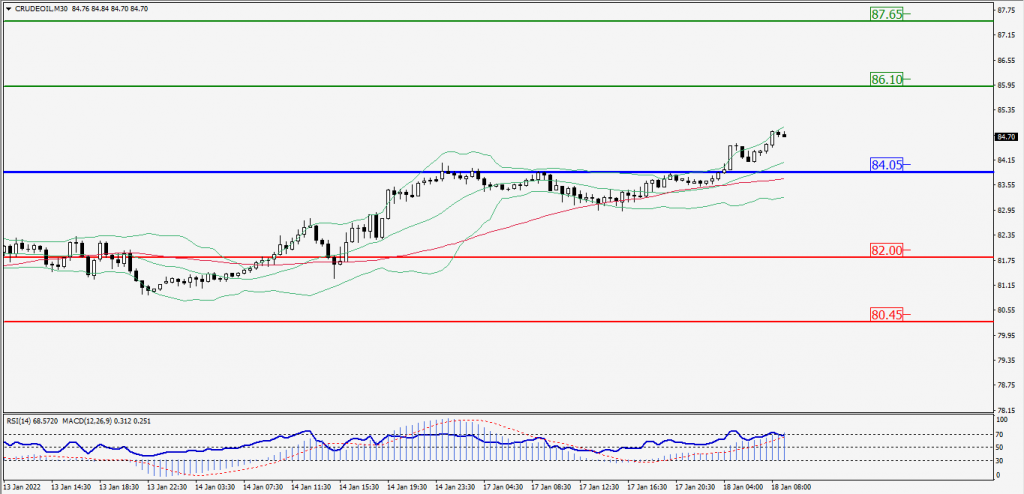
Green Lines Indicate Resistance Levels – Red Lines Indicates Support Levels
Light Blue is a Pivot Point – Black represents the price when the report was produced
XAU/USD Intraday: In Consolidation Zone
Our pivot point is 1821.20
Preferable Price Action: Further Downside to 1812.90 and 1806.40.
Alternative Price Action: If the price gives an Upside breakout of a pivot, then the price extends to 1829.50 and 1835.80.
Comment: MACD is in negative territory and the price is below its 55MA & 20MA.
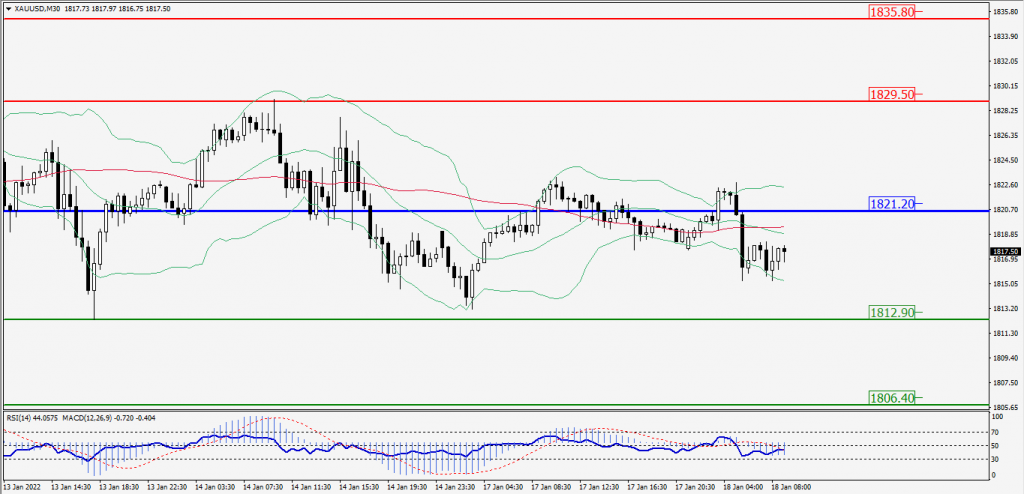
Green Lines Indicate Resistance Levels – Red Lines Indicates Support Levels
Light Blue is a Pivot Point – Black represents the price when the report was produced
Dow Jones Intraday: Resistance at 36,053.00
Our pivot point is 36,053.00
Preferable Price Action: Take Short positions Below pivot with targets at 35,636.00 & 35,320.00.
Alternative Price Action: Above 36,053.00 looks for further Upside to 36,470.00 & 36,786.00.
Comment: RSI below 50 levels And price is Below its 55MA & 20MA.
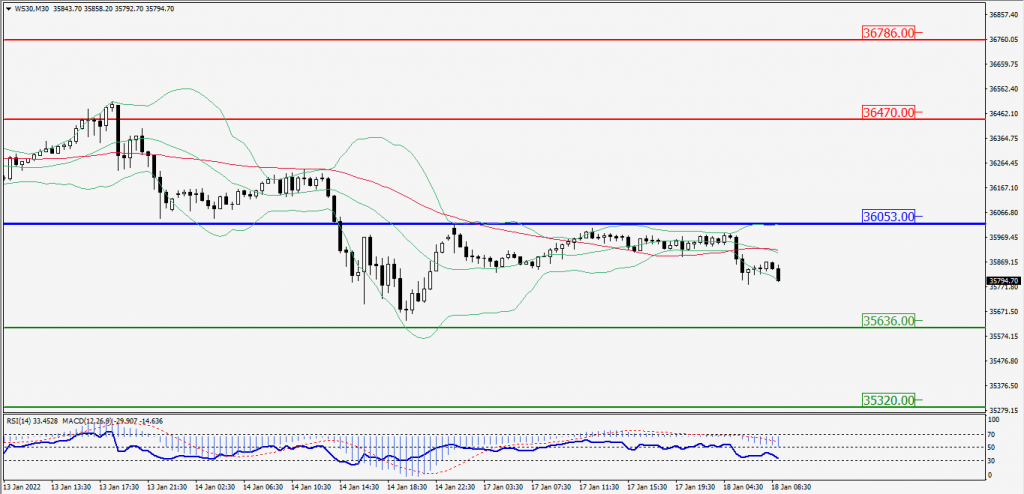
Green Lines Indicate Resistance Levels – Red Lines Indicates Support Levels
Light Blue is a Pivot Point – Black represents the price when the report was produced