Market Wrap: Stocks, Bonds, Commodities
The S&P 500 Lost (1.42%) to end at 4,659.02 points, while the Nasdaq Composite loos 381.60 points (2.51%) to 14,806.80. The Dow Jones Industrial fell (0.49%) to 36,113.62.
MSCI’s index of Asia-Pacific stocks outside Japan fell 0.38%, to 803.57 levels. Australian index down 1.08% to 7,393.90. Japanese Nikkei Index fell 1.28% to 28,124.28.
European stocks were negative on Friday, with the Stoxx Europe 50 Index lost 0.89% to 4,277.45 Germany’s DAX stair down 0.71% to 15,917.47, and France’s CAC down 0.77% to 7,145.41, and U.K.’s FTSE 100 pull down 0.12% to 7,554.96.
Benchmark 10-year U.S. Treasury descend as demand for safe assets loose again, today 10-year bond yields rose to 0.97% to 1.726.
Spot Brent crude oil collected 0.83% to $85.17 per barrel. US West Texas Intermediate crude up to $82.61 a barrel.
The yellow metal gold is rose 0.27% to 1,826.35 dollars per ounce.
Market Wrap: Forex
Today, the U.S. dollar index measures the greenback against a trade-weighted basket of six major currencies, which is dropped 0.11% to 94.690.
The Euro US Dollar (EUR/USD) is a widely traded pair that is gained today. This left the pair trading around $1.14730.
The Japanese yen fell against the U.S. dollar on Friday as the stock pushes lower. Today US/JPY is down 0.39% at 113.720 level.
Another commodity-related currency Lost against the U.S dollar, AUD/USD flat 0.72850, and NZD/USD fell 0.03% to 0.68580 level.
EUR/USD Intraday: Trend on The Upside
Our pivot point is at 1.14560
Preferable Price Action: Take Long positions above pivot level with targets at 1.15230 & 1.15720 in extension.
Alternative Price Action: Below pivot looks for a further Downside to 1.13820 & 1.13290.
Comment: Pair Above 55MA and RSI at 50 levels.
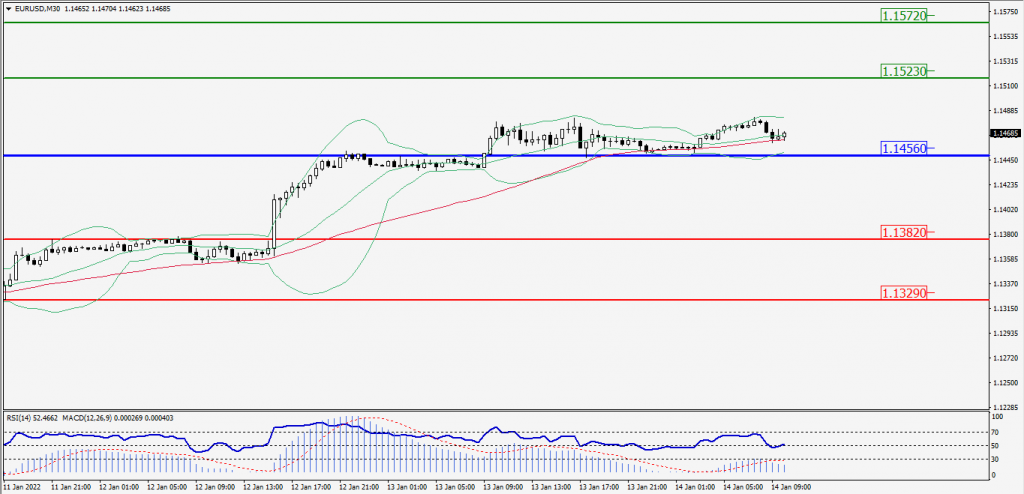
Green Lines Indicate Resistance Levels – Red Lines Indicates Support Levels
Light Blue is a Pivot Point – Black represents the price when the report was produced
GBP/USD Intraday: Major Support at 1.37110
Our pivot point is at 1.37110
Preferable Price Action: Buy positions Above pivot with targets at 1.38010 & 1.38690 in extension.
Alternative Price Action: The price Below pivot would call for further Downside to 1.36130 & 1.35430.
Comment: Pair Above its 55MA & 20MA and RSI above 50 levels.
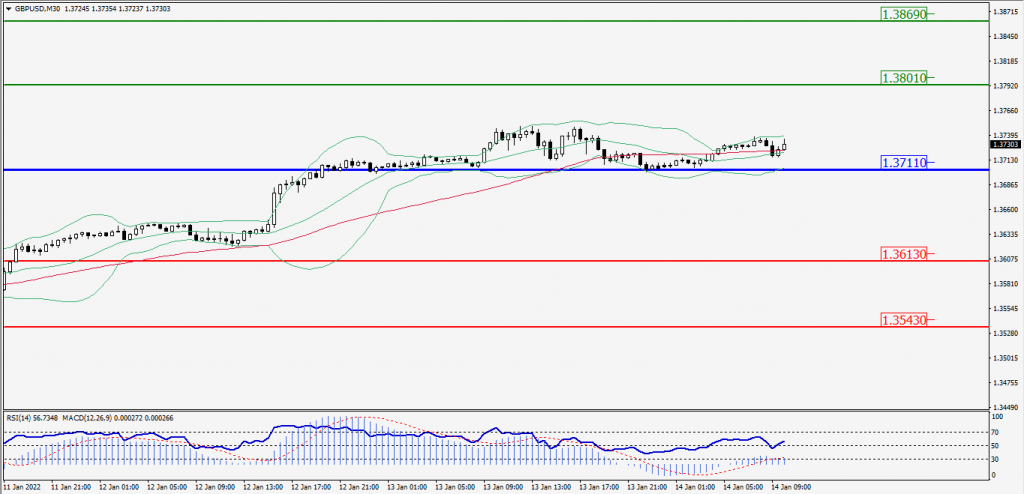
Green Lines Indicate Resistance Levels – Red Lines Indicates Support Levels
Light Blue is a Pivot Point – Black represents the price when the report was produced
USD/JPY Intraday: Trend on the Downside
Our pivot point is at 114.340
Preferable Price Action: Sell position Below pivot with the target at 112.990 and 112.030 in extension.
Alternative Price Action: The Upside breakout of the pivot would call for 115.670 and 116.670.
Comment: Pair Below its 55MA & 20MA and MACD in negative territory.
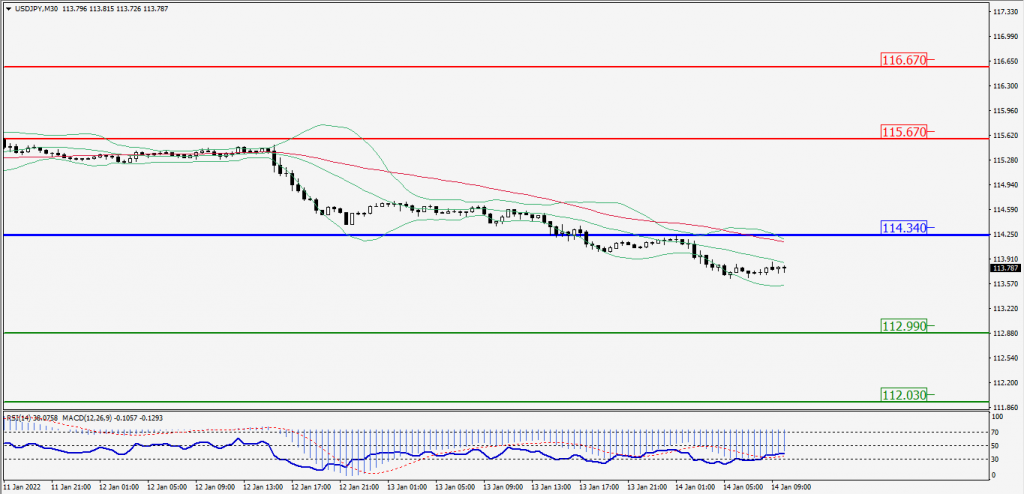
Green Lines Indicate Resistance Levels – Red Lines Indicates Support Levels
Light Blue is a Pivot Point – Black represents the price when the report was produced
AUD/USD Intraday: Major Support at 0.72590
Our pivot point is at 0.72590
Preferable Price Action: Buy Positions Above pivot with targets at 0.73590 & 0.74170 in extension.
Alternative Price Action: Below pivot looks for a further Downside with 0.71720 & 0.71220 as targets.
Comment: Pair above its 55MA & 20MA and RSI Above 50 levels.
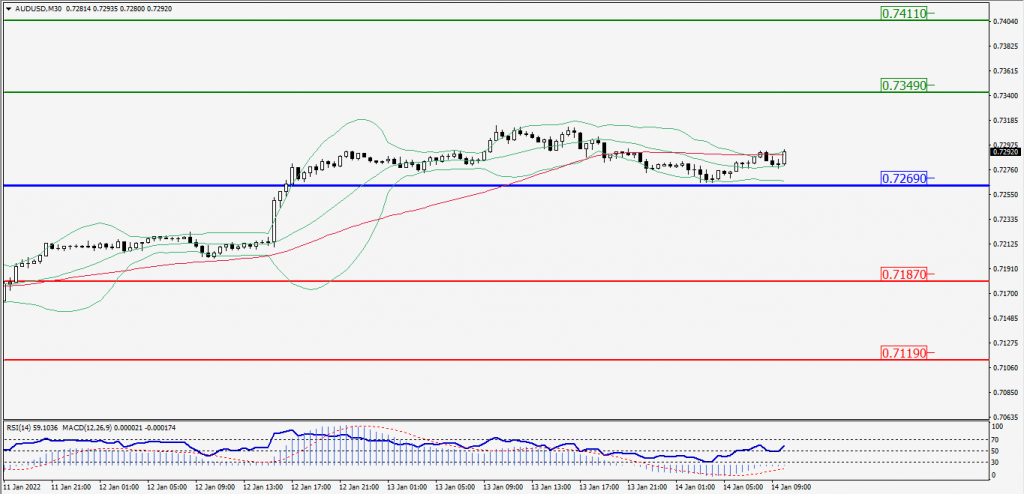
Green Lines Indicate Resistance Levels – Red Lines Indicates Support Levels
Light Blue is a Pivot Point – Black represents the price when the report was produced
CRUDEOIL Intraday: Trend on the Major Upside
Our pivot point is at 81.60
Preferable Price Action: Above pivots Buy Oil with 83.20 & 84.10 as targets.
Alternative Price Action: Sell crude Below pivot with targets at 80.10 and 79.05 in extension.
Comment: Price Above 20MA & 55MA and MACD is in the positive territory.
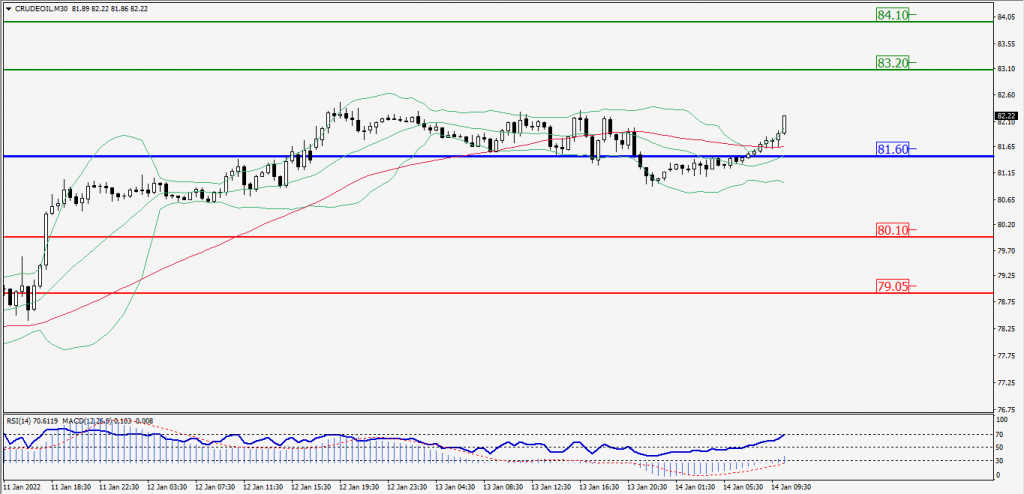
Green Lines Indicate Resistance Levels – Red Lines Indicates Support Levels
Light Blue is a Pivot Point – Black represents the price when the report was produced
XAU/USD Intraday: Trend on the Upside
Our pivot point is 1822.80
Preferable Price Action: Further Upside to 1837.10 and 1845.90.
Alternative Price Action: If the price gives a Downside breakout of a pivot, then the price extends to 1808.50 and 1799.10.
Comment: MACD is in positive territory and the price is above its 55MA & 20MA.
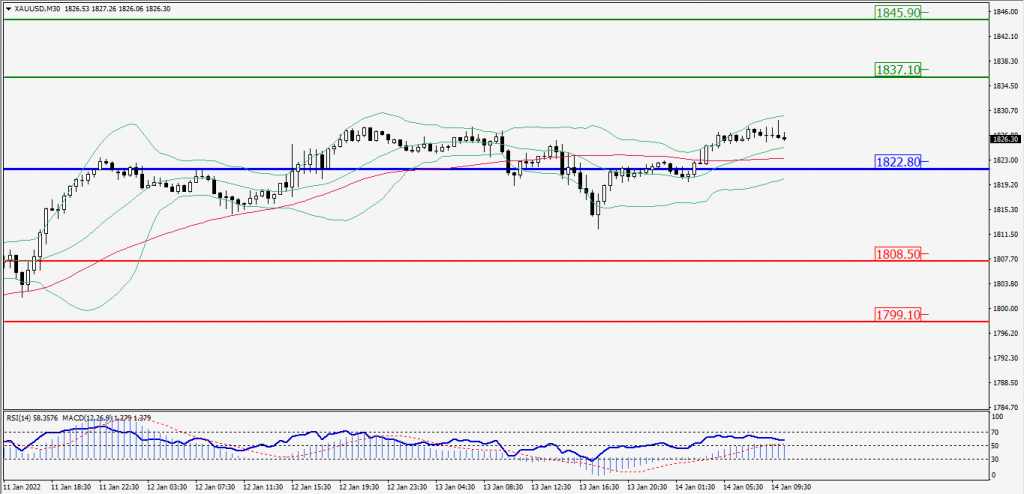
Green Lines Indicate Resistance Levels – Red Lines Indicates Support Levels
Light Blue is a Pivot Point – Black represents the price when the report was produced
Dow Jones Intraday: Resistance at 36,333.00
Our pivot point is 36,333.00
Preferable Price Action: Take Short positions Below pivot with targets at 35,993.00 & 35,768.00.
Alternative Price Action: Above 36,333.00 looks for further Upside to 36,652.00 & 36,865.00.
Comment: RSI at 50 levels And price is Below 55MA.
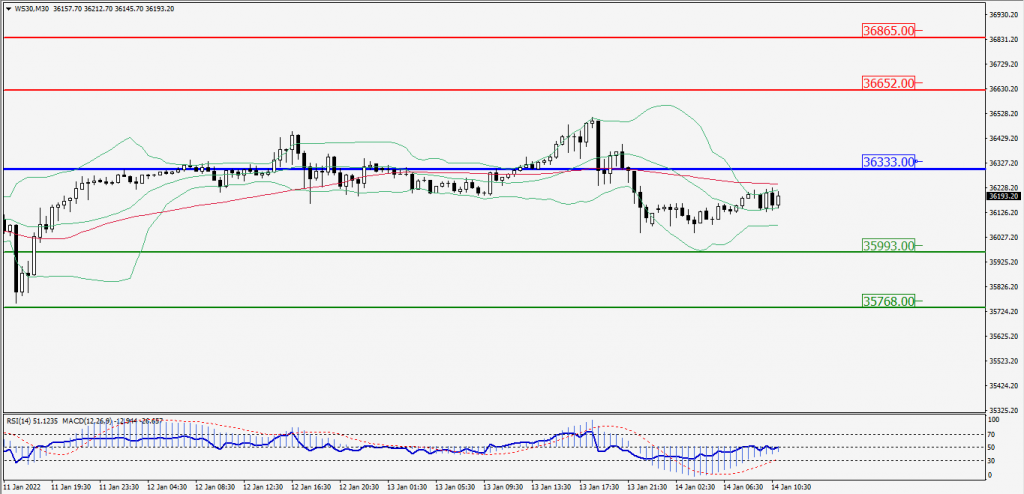
Green Lines Indicate Resistance Levels – Red Lines Indicates Support Levels
Light Blue is a Pivot Point – Black represents the price when the report was produced