Market Wrap: Stocks, Bonds, Commodities
Shares in Asia-Pacific were mixed in Monday morning trade, with multiple major markets in the region closed for holidays.
MSCI’s index of Asia-Pacific stocks outside Japan advance flat 781.48 levels. Australian index rose 0.44% to 7,420.30. Japanese Nikkei Index fell 0.37% to 28,676.46.
European stocks were lower on Monday, with the Stoxx Europe 50 Index fell 0.40% to 4,248.35, Germany’s DAX lost 0.05% to 15,748.31, and France’s CAC down 0.04% to 7,083.81, and U.K.’s FTSE 100 flat to 7,372.10.
Benchmark 10-year U.S. Treasury rose as demand for safe assets fell again, today 10-year bond yields lose 0.71% to 1.482.
Oil prices were mixed on Monday, with Brent edging up while US crude futures slipped after airlines called off thousands of flights in the United States over Christmas holidays amid surging COVID-19 infections.
Spot Brent crude oil lost 0.36% to $75.52 per barrel. US West Texas Intermediate crude down 1.36% to $72.79 a barrel.
The yellow metal gold is fell 0.05% to 1,810.25 dollars per ounce.
Market Wrap: Forex
The euro, Australian dollar, and other currencies recovered against the US dollar as traders turned more positive about the economic outlook on Wednesday, even as Omicron cases rocketed and investors braced for more volatility.
Today, the U.S. dollar index measures the greenback against a trade-weighted basket of six major currencies, which rise 0.17% to 96.145.
The Euro US Dollar (EUR/USD) is a widely traded pair that is flat today. This left the pair trading around $1.13190.
The Japanese yen fell against the U.S. dollar on Monday as the stock pushes higher. Today US/JPY is rose 0.05% to 114.46 level.
Another commodity-related currency mixed against the U.S dollar, AUD/USD gained 0.05% to 0.72260, and NZD/USD down 0.05% to 0.68120 level.
EUR/USD Intraday: Support at 1.13060
Our pivot point is at 1.13060
Preferable Price Action: Take Long positions Above pivot level with targets at 1.13330 & 1.13530 in extension.
Alternative Price Action: Below pivot looks for a further Downside to 1.12790 & 1.12590.
Comment: Pair below 55MA & 20MA and RSI below 50 levels.
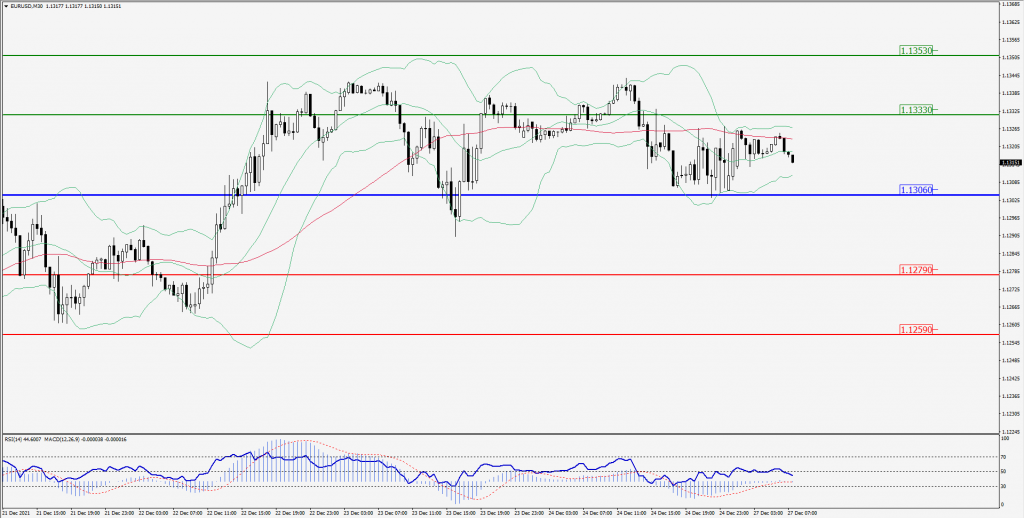
Green Lines Indicate Resistance Levels – Red Lines Indicates Support Levels
Light Blue is a Pivot Point – Black represents the price when the report was produced
GBP/USD Intraday: Trend on the upside
Our pivot point is at 1.33860
Preferable Price Action: Buy positions above pivot with targets at 1.34290 & 1.34560 in extension.
Alternative Price Action: The price below pivot would call for further downside to 1.33500 & 1.33230.
Comment: Pair above its 55MA & 20MA and RSI at 50 levels.
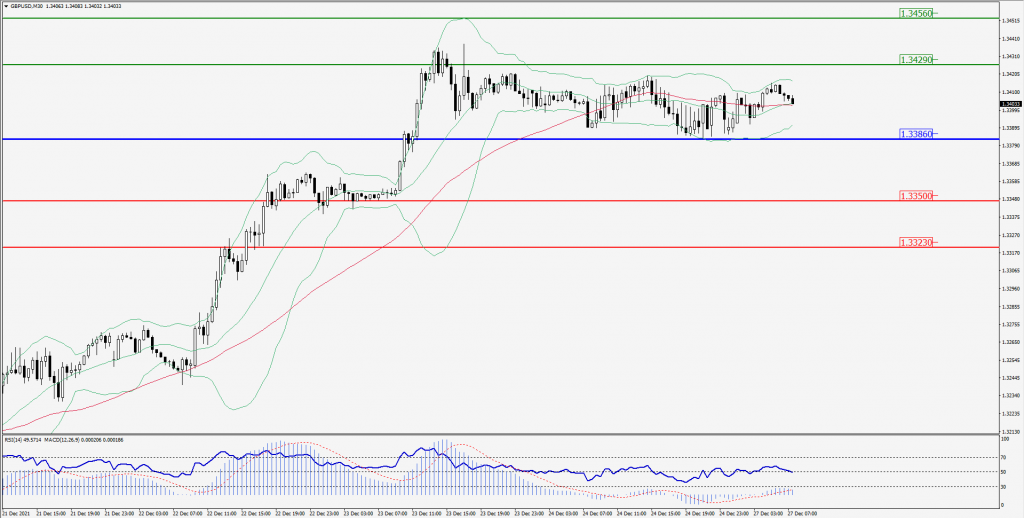
Green Lines Indicate Resistance Levels – Red Lines Indicates Support Levels
Light Blue is a Pivot Point – Black represents the price when the report was produced
USD/JPY Intraday: Support at 114.300
Our pivot point is at 114.300
Preferable Price Action: Buy position Above pivot with the target at 114.560 and 114.730 in extension.
Alternative Price Action: The Downside breakout of the pivot would call for 114.060 and 113.890.
Comment: Price above its 55MA & 20MA and MACD in positive territory.
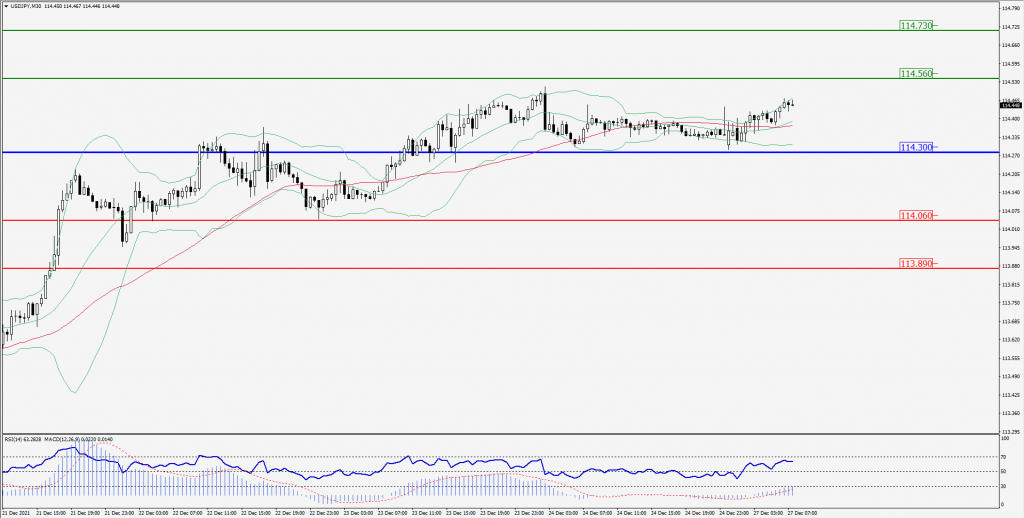
Green Lines Indicate Resistance Levels – Red Lines Indicates Support Levels
Light Blue is a Pivot Point – Black represents the price when the report was produced
AUD/USD Intraday: Trend on the upside
Our pivot point is at 0.72190
Preferable Price Action: Buy Positions pivot with targets at 0.72630 & 0.72960 in extension.
Alternative Price Action: Below pivot looks for a further downside with 0.71760 & 0.71430 as targets.
Comment: Pair above its 55MA and RSI at 50 levels.
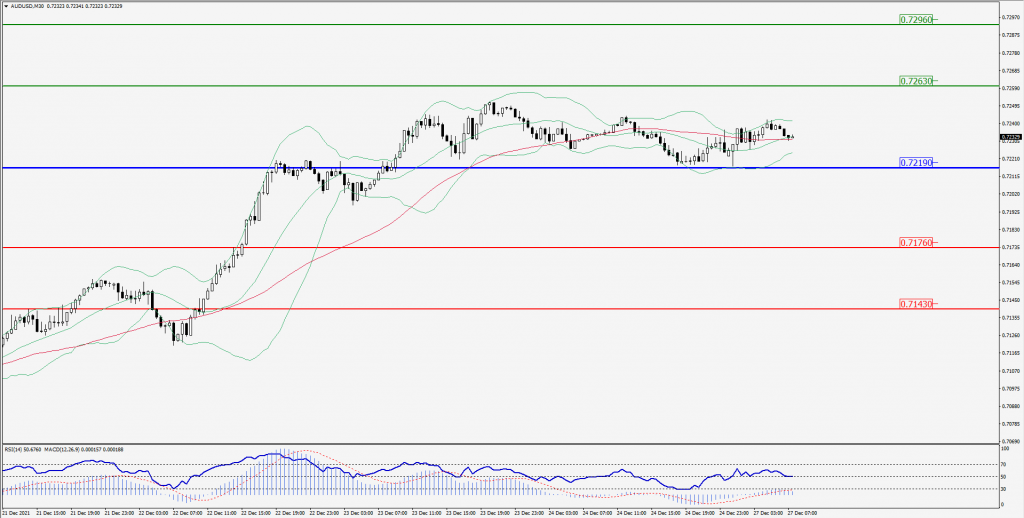
Green Lines Indicate Resistance Levels – Red Lines Indicates Support Levels
Light Blue is a Pivot Point – Black represents the price when the report was produced
CRUDEOIL Intraday: Trend on the upside
Our pivot point is at 72.20
Preferable Price Action: Above pivots Buy Oil with 74.10 & 75.30 as targets.
Alternative Price Action: Sell crude Below pivot with targets at 70.50 and 69.30 in extension.
Comment: Crude is below its 20MA and MACD in the negative territory.
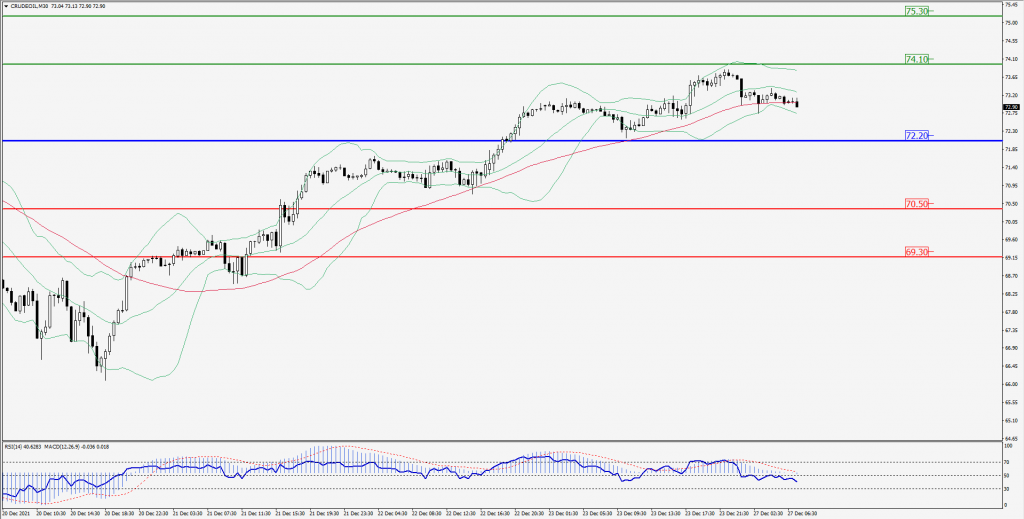
Green Lines Indicate Resistance Levels – Red Lines Indicates Support Levels
Light Blue is a Pivot Point – Black represents the price when the report was produced
XAU/USD Intraday: Support Level at 1805.00
Our pivot point is 1805.00
Preferable Price Action: Further Upside to 1819.00 and 1826.00.
Alternative Price Action: If the price gives a downside breakout of a pivot, then the price extends to 1793.00 and 1786.00.
Comment: MACD in positive territory and price above its 55MA.
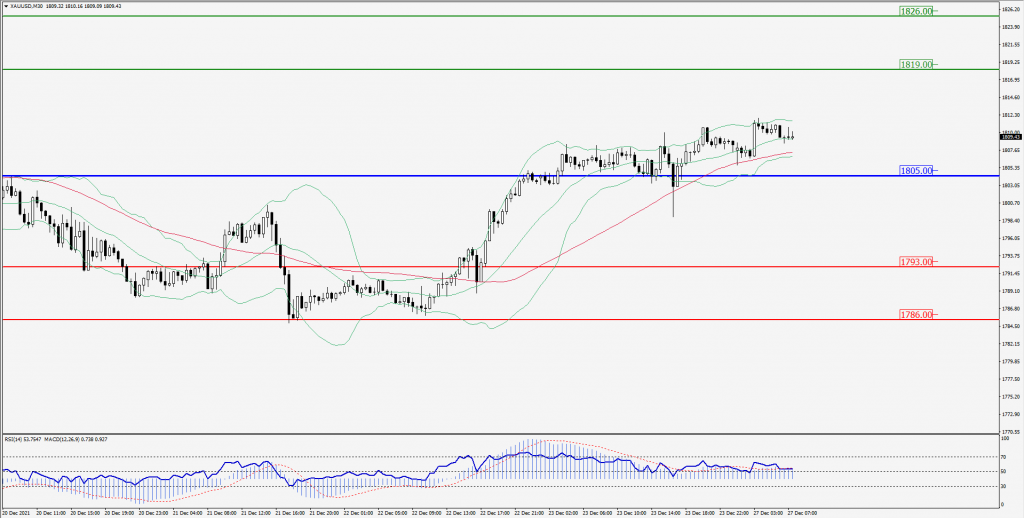
Green Lines Indicate Resistance Levels – Red Lines Indicates Support Levels
Light Blue is a Pivot Point – Black represents the price when the report was produced
Dow Jones Intraday: Trend on the upside
Our pivot point is 35,760.00
Preferable Price Action: Take Long positions above pivot with targets at 36,090.00 & 36,330.00.
Alternative Price Action: Below 35,760.00 looks for further Downside to 35,433.00 & 35,203.00.
Comment: Price above its 55MAand RSI below 50 levels.
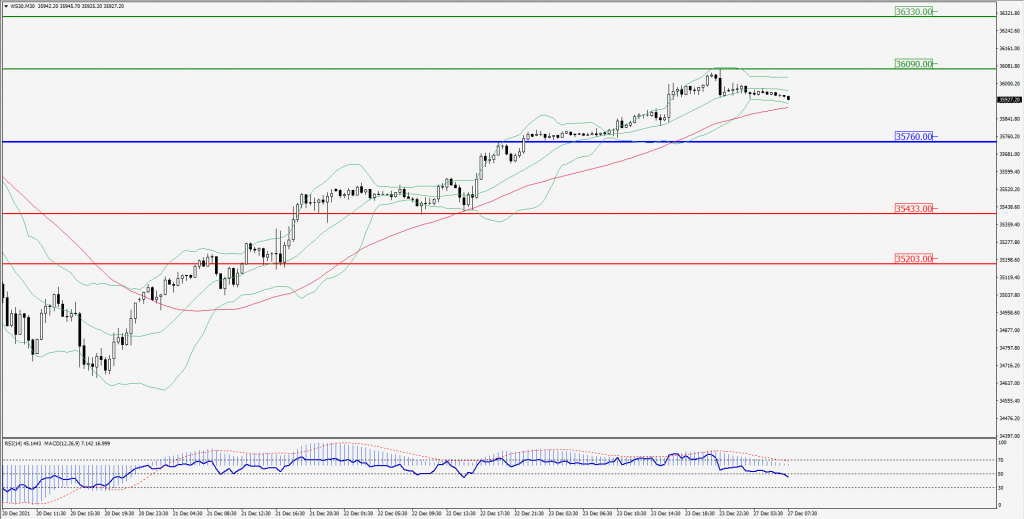
Green Lines Indicate Resistance Levels – Red Lines Indicates Support Levels
Light Blue is a Pivot Point – Black represents the price when the report was produced