Market Wrap: Stocks, Bonds, Commodities
Wall Street’s main indexes went higher yesterday in a broad rally after upbeat economic data and hopeful developments about the severity of the Omicron coronavirus variant that is sweeping the world.
The Dow Jones Industrial Average rose 261.19 points (0.74%) to 35,753.89, the S&P 500 gained 47.33 points (1.02%) to 4,696.56 and the Nasdaq Composite added 180.81 points (1.18%) to 15,521.89.
MSCI’s index of Asia-Pacific stocks outside Japan advance 0.76% to 780.29 levels. Australian index rose 0.31% to 7,387.60. Japanese Nikkei Index surged 0.75% to 28,777.00.
European stocks were surged on Thursday, with the Stoxx Europe 50 Index raised 0.31% to 4,230.15, Germany’s DAX gained 0.30% to 15,640.95, and France’s CAC rose 0.09% to 7,057.84, and U.K.’s FTSE 100 raised 0.04% to 7,344.75.
Benchmark 10-year U.S. Treasury rose as demand for safe assets grows again, today 10-year bond yields flourished 0.26% to 1.462.
Oil prices shrugged off early gains on Thursday as countries imposed new travel curbs to combat surging cases, though the downside remained capped over positive developments around COVID-19.
Spot Brent crude oil rose 0.04% to $75.31 per barrel. US West Texas Intermediate crude gained 0.12% to $72.85 a barrel.
The yellow metal gold is straighten 0.24% to 1,8635.45 dollars per ounce.
Market Wrap: Forex
The euro, Australian dollar, and other currencies recovered against the US dollar as traders turned more positive about the economic outlook on Wednesday, even as Omicron cases rocketed and investors braced for more volatility.
Today, the U.S. dollar index measures the greenback against a trade-weighted basket of six major currencies, which flat to 96.043.
The Euro US Dollar (EUR/USD) is a widely traded pair that is fell 0.10% today. This left the pair trading around $1.13130.
The Japanese yen fell against the U.S. dollar on Thursday as the stock pushes higher. Today US/JPY is rose 0.11% to 114.240 level.
Another commodity-related currency higher against the U.S dollar, AUD/USD gain 0.06% to 0.72170, and NZD/USD up 0.13% to 0.68150 level.
EUR/USD Intraday: Support at 1.13230
Our pivot point is at 1.13230
Preferable Price Action: Take Long positions Above pivot level with targets at 1.13730 & 1.14030 in extension.
Alternative Price Action: Below pivot looks for a further Downside to 1.12730 & 1.12460.
Comment: Pair above 55MA & 20MA and RSI above 50 levels.
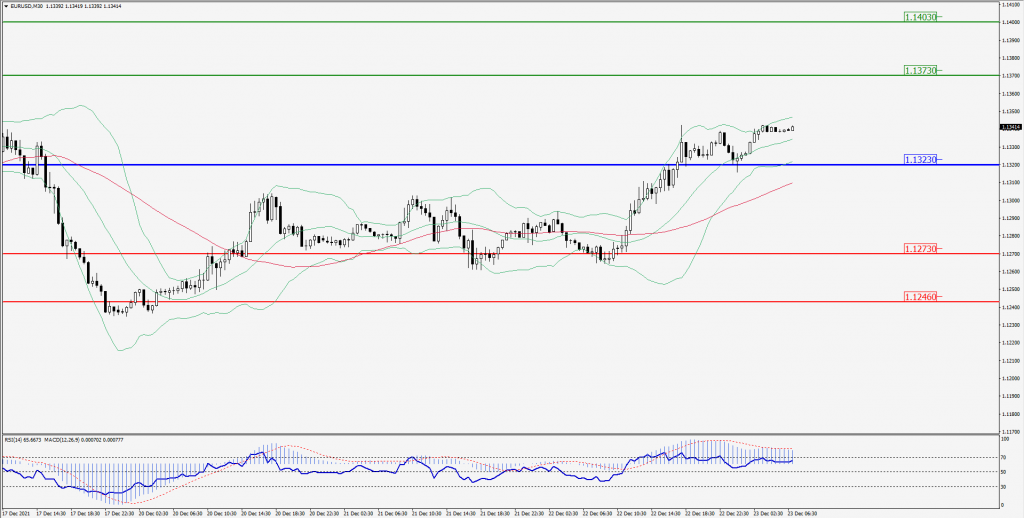
Green Lines Indicate Resistance Levels – Red Lines Indicates Support Levels
Light Blue is a Pivot Point – Black represents the price when the report was produced
GBP/USD Intraday: Trend on the upside
Our pivot point is at 1.33260
Preferable Price Action: Buy positions above pivot with targets at 1.34060 & 1.34490 in extension.
Alternative Price Action: The price below pivot would call for further downside to 1.32560 & 1.32130.
Comment: Pair above its 55MA and RSI above 50 levels.
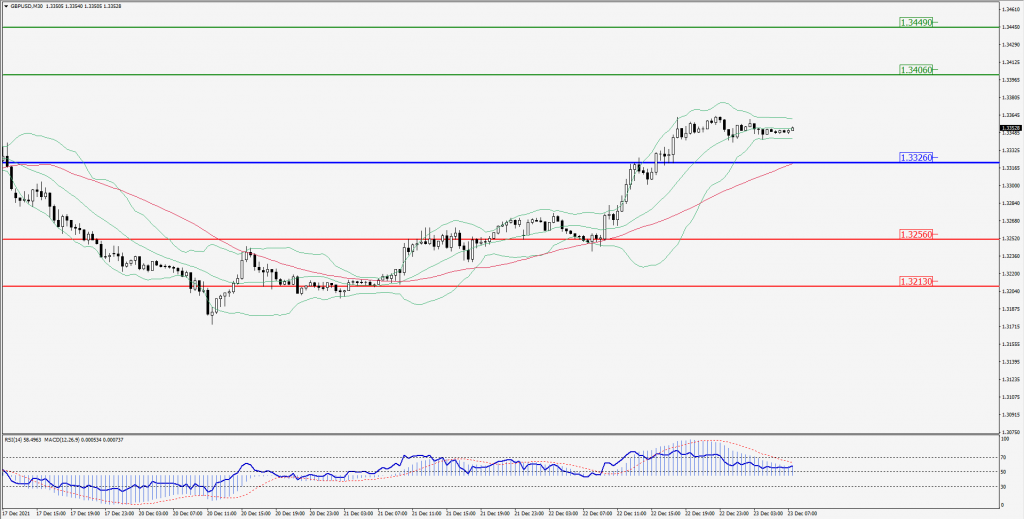
Green Lines Indicate Resistance Levels – Red Lines Indicates Support Levels
Light Blue is a Pivot Point – Black represents the price when the report was produced
USD/JPY Intraday: Support Level at 114.060
Our pivot point is at 114.060
Preferable Price Action: Buy position Above pivot with the target at 114.490 and 114.760 in extension.
Alternative Price Action: The Downside breakout of the pivot would call for 113.630 and 113.390.
Comment: Price above its 55MA and MACD in negative territory.
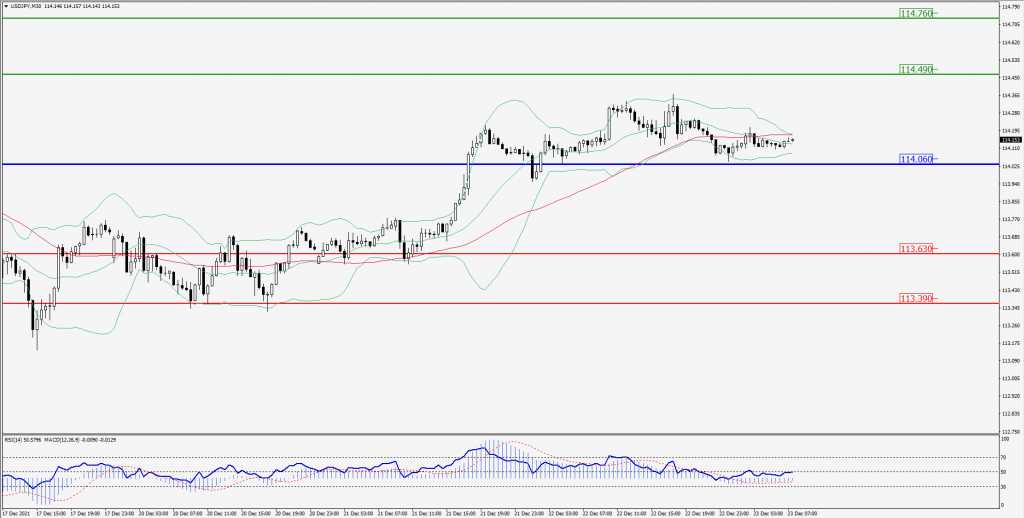
Green Lines Indicate Resistance Levels – Red Lines Indicates Support Levels
Light Blue is a Pivot Point – Black represents the price when the report was produced
AUD/USD Intraday: Trend on the upside
Our pivot point is at 0.72030
Preferable Price Action: Buy Positions pivot with targets at 0.72590 & 0.72900 in extension.
Alternative Price Action: Below pivot looks for a further downside with 0.71530 & 0.71230 as targets.
Comment: Pair above its 55MA & 20MA and RSI above 50 levels.
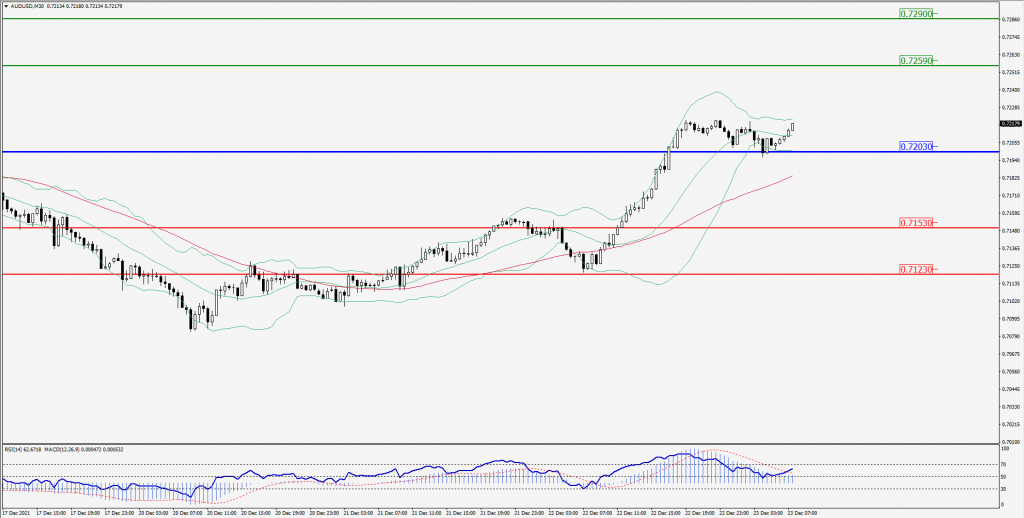
Green Lines Indicate Resistance Levels – Red Lines Indicates Support Levels
Light Blue is a Pivot Point – Black represents the price when the report was produced
CRUDEOIL Intraday: Trend on the upside
Our pivot point is at 71.90
Preferable Price Action: Above pivots Buy Oil with 74.30 & 75.90 as targets.
Alternative Price Action: Sell crude Below pivot with targets at 69.30 and 67.90 in extension.
Comment: Crude is above its 55MA and MACD in the positive territory.
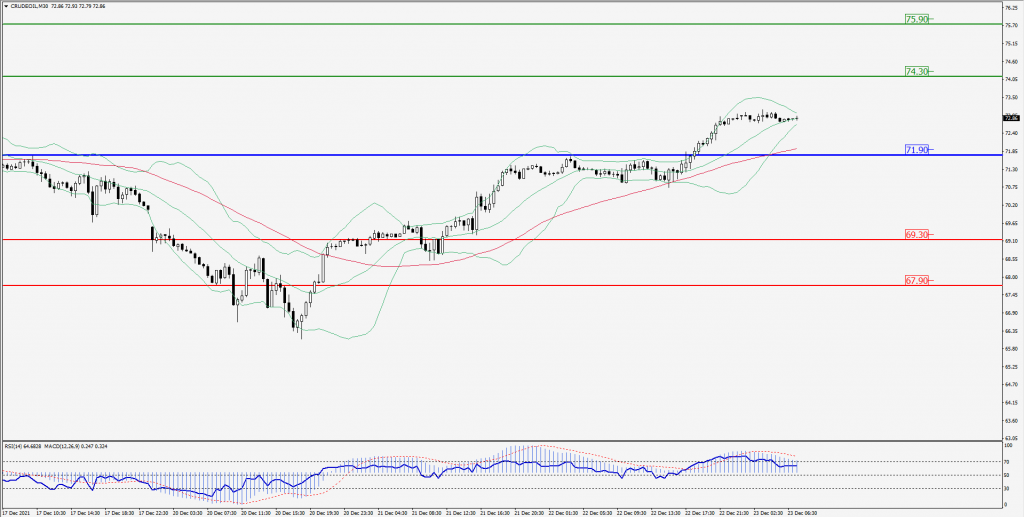
Green Lines Indicate Resistance Levels – Red Lines Indicates Support Levels
Light Blue is a Pivot Point – Black represents the price when the report was produced
XAU/USD Intraday: In Consolidation Zone
Our pivot point is 1803.00
Preferable Price Action: Further Upside to 1816.00 and 1823.00.
Alternative Price Action: If the price gives a downside breakout of a pivot, then the price extends to 1789.00 and 1783.00.
Comment: MACD in positive territory and price above its 20MA & 55MA.
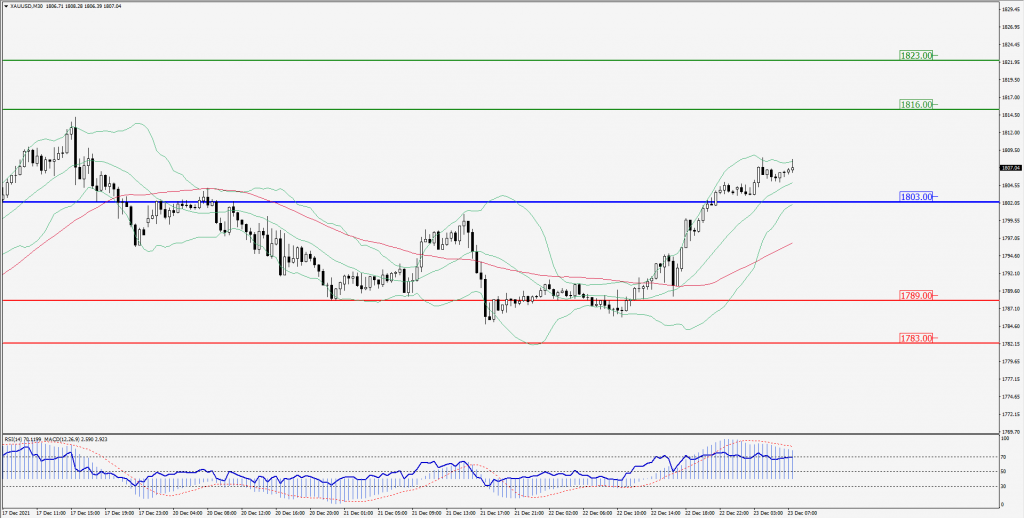
Green Lines Indicate Resistance Levels – Red Lines Indicates Support Levels
Light Blue is a Pivot Point – Black represents the price when the report was produced
Dow Jones Intraday: Support at 35590.00
Our pivot point is 35,590.00
Preferable Price Action: Take Long positions above pivot with targets at 35,990.00 & 36,260.00.
Alternative Price Action: Below 35,030.00 looks for further Downside to 35,230.00 & 34,960.00.
Comment: Price above its 55MA & 20MAand RSI above 50 levels.
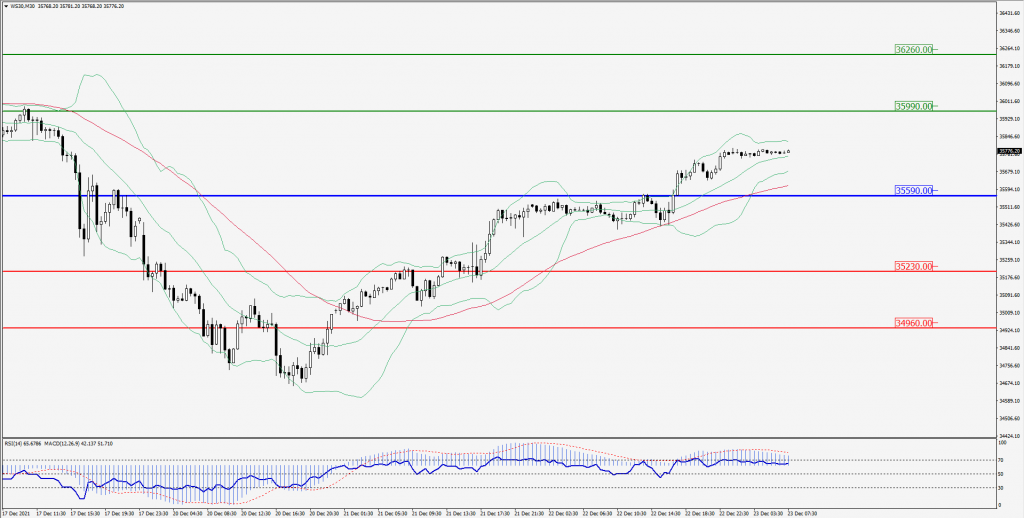
Green Lines Indicate Resistance Levels – Red Lines Indicates Support Levels
Light Blue is a Pivot Point – Black represents the price when the report was produced