Market Wrap: Stocks, Bonds, Commodities
Wall Street indices closed out Monday’s session near the unchanged mark as rising Treasury yields dented the appetite for technology stocks, while Boeing shares advanced on signs of demand for its freighter aircraft.
The Dow Jones Industrial Average fell 12.86 points (0.04%) to 36,087.45, the S&P 500 flat to 4,682.80, and the Nasdaq Composite dropped 7.11 points to 15,853.85.
MSCI’s index of Asia-Pacific stocks outside Japan is rose 0.45% to 828.97 levels. Australian index lost 0.67% to 7,420.00. Japanese Nikkei Index higher 0.11% to 29,808.12.
European stocks were higher on Tuesday, with the Stoxx Europe 50 Index gaining 0.13% to 4,391.95, Germany’s DAX rose 0.15% to 16,172.30, and France’s CAC gained 0.13% to 7,137.11, and U.K.’s FTSE 100 slipped 0.05% to 7,350.10.
Benchmark 10-year U.S. Treasury rose as demand for safe assets grows again, today 10-year bond yields fell 0.93% to 1.606.
Oil prices slipped on Tuesday as a rebound in COVID-19 cases in Europe raised concerns over demand amid the expectation that supply will rise, while some in the market still fear the US may release crude reserves to stop a rally in gasoline prices.
Spot Brent crude oil rose 1.07% to $82.93 per barrel. US West Texas Intermediate crude gained 0.94% to $80.50 a barrel.
The yellow metal traded flat to 1866.30 dollars per ounce.
Market Wrap: Forex
The dollar eased broadly against riskier currencies and the yuan scaled a five-month high on Tuesday, as talks between U.S. and Chinese leaders seemed to have an amicable start, while traders awaited looming U.S. retail sales data.
Today, the U.S. dollar index measures the greenback against a trade-weighted basket of six major currencies, which advanced 0.07% to 95.470.
The Euro US Dollar (EUR/USD) is a widely traded pair that is rose 0.06% today. This left the pairing trading around $1.13720.
The Japanese yen fell against the U.S. dollar on Tuesday as the stock pushes higher. Today US/JPY is gained 0.10% to 114.220 level.
Another commodity-related currency lower against the U.S dollar, AUD/USD slipped 0.10% to 0.73360, and NZD/USD declined 0.21% to 0.70310 level.
EUR/USD Intraday: Trend on the downside
Our pivot point is at 1.14160
Preferable Price Action: Take Short positions Below pivot level with targets at 1.13540 & 1.13180 in extension.
Alternative Price Action: Above pivot looks for a further Upside to 1.14830 & 1.15210.
Comment: Pair below its 55MA & 20MA and RSI below 50 levels.
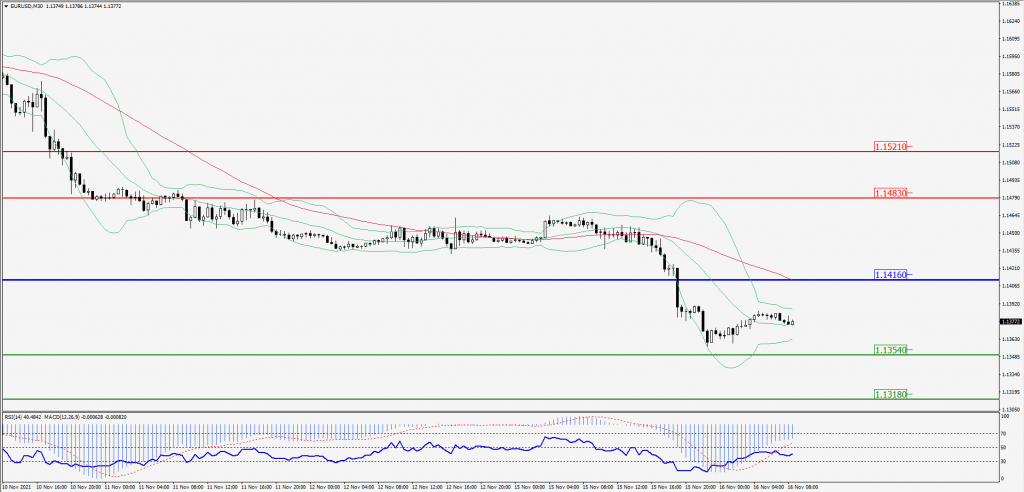
Green Lines Indicate Resistance Levels – Red Lines Indicates Support Levels
Light Blue is a Pivot Point – Black represents the price when the report was produced
GBP/USD Intraday: Support at 1.34080
Our pivot point is at 1.34080
Preferable Price Action: Buy positions above pivot with targets at 1.34660 & 1.34930 in extension.
Alternative Price Action: The price below pivot would call for further downside to 1.33580 & 1.33330.
Comment: Pair above its 50MA and RSI at 50 levels.
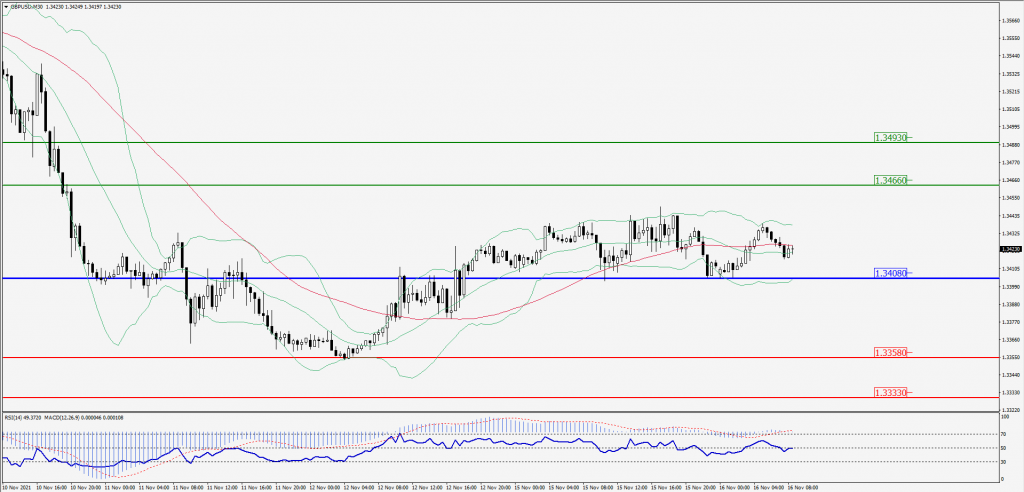
Green Lines Indicate Resistance Levels – Red Lines Indicates Support Levels
Light Blue is a Pivot Point – Black represents the price when the report was produced
USD/JPY Intraday: In a consolidation zone
Our pivot point is at 114.100
Preferable Price Action: Buy position Above pivot with the target at 114.570 and 114.800 in extension.
Alternative Price Action: The Downside breakout of the pivot would call for 113.620 and 113.400.
Comment: Price below its 55MA & 20MA and MACD in positive territory.
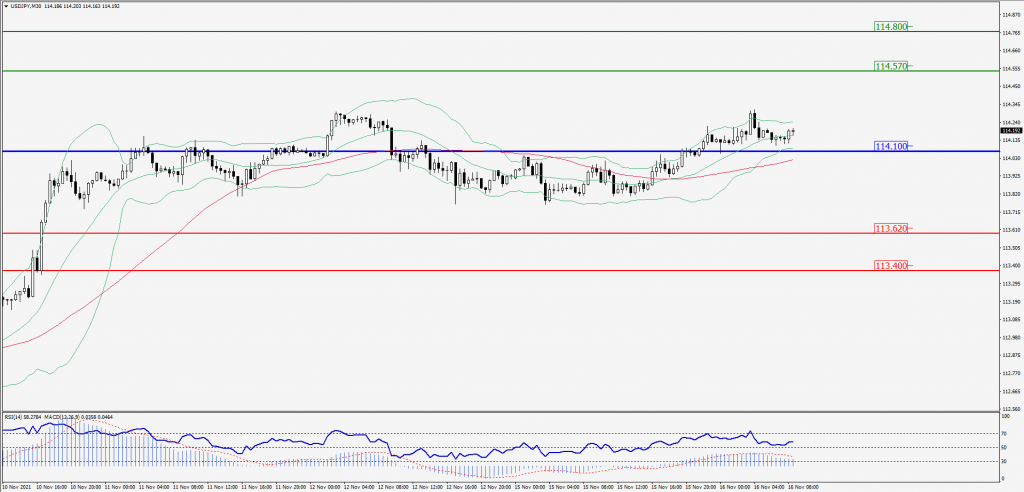
Green Lines Indicate Resistance Levels – Red Lines Indicates Support Levels
Light Blue is a Pivot Point – Black represents the price when the report was produced
AUD/USD Intraday: Resistance at 0.73670
Our pivot point is at 0.73670
Preferable Price Action: Sell Positions below pivot with targets at 0.73200 & 0.73020 in extension.
Alternative Price Action: Above pivot looks for a further upside with 0.74110 & 0.74270 as targets.
Comment: Pair below its 55MA & 20MA and RSI below 50 levels.
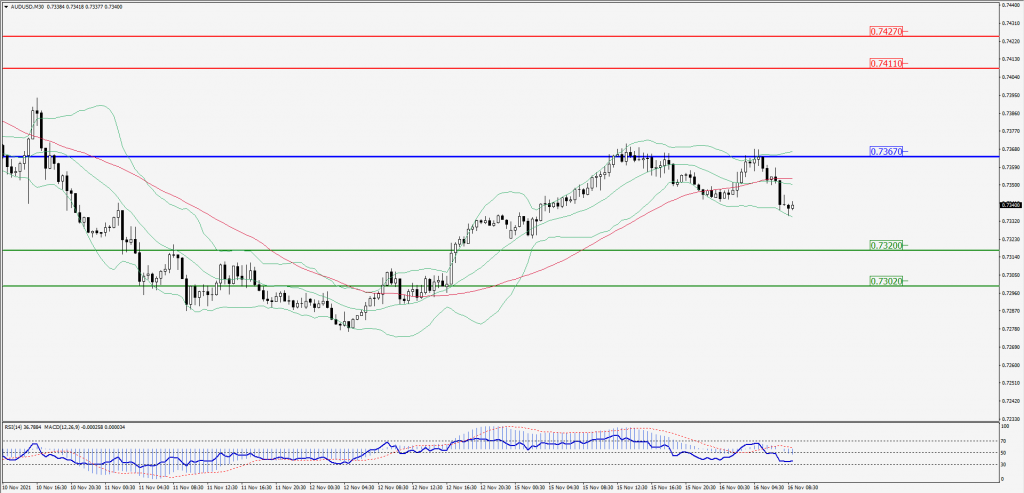
Green Lines Indicate Resistance Levels – Red Lines Indicates Support Levels
Light Blue is a Pivot Point – Black represents the price when the report was produced
CRUDEOIL Intraday: Break resistance level
Our pivot point is at 79.70
Preferable Price Action: Above pivots Buy Oil with 81.30 & 82.00 as targets.
Alternative Price Action: Sell crude Below pivot with targets at 78.20 and 77.50 in extension.
Comment: Crude is above its 55MA & 20MA and MACD in the positive territory.
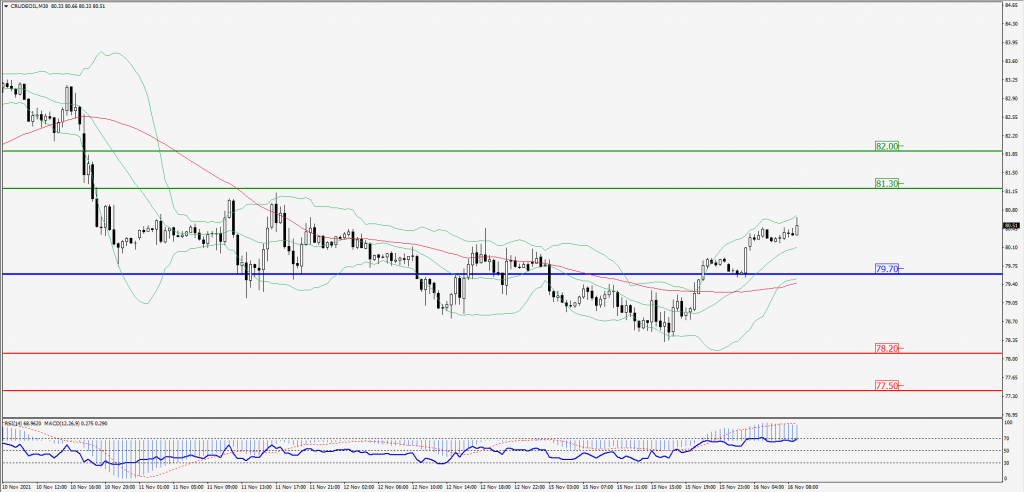
Green Lines Indicate Resistance Levels – Red Lines Indicates Support Levels
Light Blue is a Pivot Point – Black represents the price when the report was produced
XAU/USD Intraday: In a consolidation zone
Our pivot point is 1862.10
Preferable Price Action: Further upside to 1876.40 and 1882.20.
Alternative Price Action: If the price gives a downside breakout of a pivot, then the price extends to 1848.50 and 1843.50.
Comment: MACD in negative territory and price above its 20MA & 55MA.
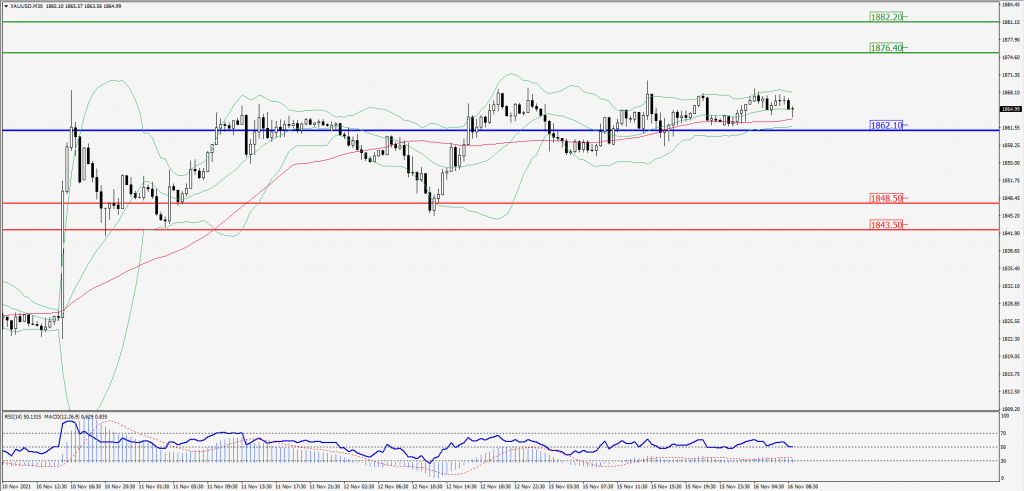
Green Lines Indicate Resistance Levels – Red Lines Indicates Support Levels
Light Blue is a Pivot Point – Black represents the price when the report was produced
Dow Jones Intraday: In a consolidation zone
Our pivot point is 36,174.00
Preferable Price Action: Take Short positions below pivot with targets at 35,959.00 & 35,851.00.
Alternative Price Action: Above 35,958.00 looks for further upside to 36,390.00 & 36,496.00.
Comment: Price below its 55MA & 20MA and RSI below 50 levels.
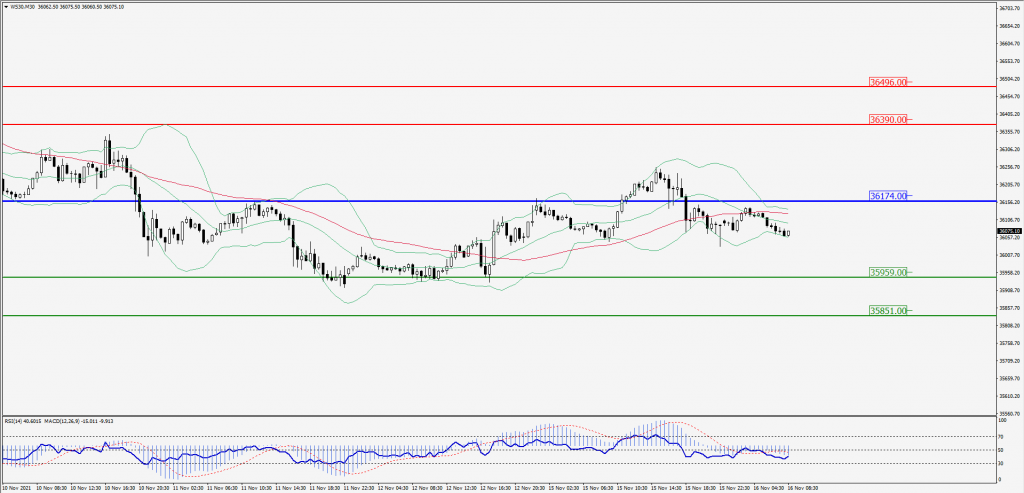
Green Lines Indicate Resistance Levels – Red Lines Indicates Support Levels
Light Blue is a Pivot Point – Black represents the price when the report was produced