Market Wrap: Stocks, Bonds, Commodities
Wall Street’s main indexes rose on Tuesday to record highs as a strong earnings season continued to lift sentiment for equities, while investors were looking ahead to the outcome of a critical Federal Reserve meeting.
The Dow Jones Industrial Average rose 138.79 points (0.39%) to 36,052.63, the S&P 500 gained 16.98 points (0.37%) to 4,630.65 and the Nasdaq Composite added 53.69 points (0.34%) to 15,649.60.
MSCI’s index of Asia-Pacific stocks outside Japan is fell 0.52% to 806.16 levels. Australian index gained 0.93% to 7,392.70. Japanese Nikkei Index closed today.
European stocks were lower on Wednesday, with the Stoxx Europe 50 Index flat to 4,294.30, Germany’s DAX down 0.10% to 15,940.85, and France’s CAC fell 0.05% to 6,923.91, and U.K.’s FTSE 100 down 0.19% to 7,2361.15.
Benchmark 10-year U.S. Treasury rose as demand for safe assets grows again, today 10-year bond yields rose 0.55% to 1.564.
Oil prices fell on Wednesday as industry data pointed to a big build in crude oil and distillate stocks in the United States, the world’s largest oil consumer, and as pressure mounted on OPEC to increase supply.
Spot Brent crude oil fell 1.18% to $83.72 per barrel. US West Texas Intermediate crude slipped 1.59% to $82.58 a barrel.
The yellow metal traded 0.36% lower to 1783.00 dollars per ounce.
Market Wrap: Forex
The dollar held within striking distance of the year’s peaks on the euro and yen on Wednesday, as investors looked for the Federal Reserve to begin unwinding pandemic-era policy support faster than central banks in Europe and Japan.
Today, the U.S. dollar index measures the greenback against a trade-weighted basket of six major currencies, which flat to 94.055.
The Euro US Dollar (EUR/USD) is a widely traded pair that is rose 0.10% today. This left the pairing trading around $1.15850.
The Japanese yen rose against the U.S. dollar on Wednesday as the stock pushes higher. Today US/JPY is fell 0.07% to 113.860 level.
Another commodity-related currency higher against the U.S dollar, AUD/USD advanced 0.15% to 0.74370, and NZD/USD added 0.21% to 0.71220 level.
EUR/USD Intraday: Trend on the upside
Our pivot point is at 1.15760
Preferable Price Action: Take long positions above pivot level with targets at 1.16400 & 1.16800 in extension.
Alternative Price Action: Below pivot looks for a further downside to 1.15240 & 1.14890.
Comment: Pair above its 55MA & 20MA and RSI above 50 levels.
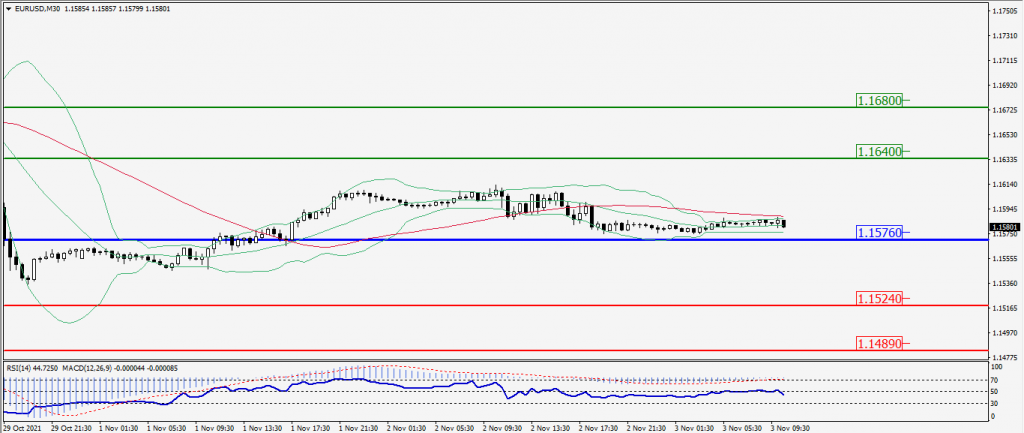
Green Lines Indicate Resistance Levels – Red Lines Indicates Support Levels
Light Blue is a Pivot Point – Black represents the price when the report was produced
GBP/USD Intraday: Resistance at 1.37050
Our pivot point is at 1.36940
Preferable Price Action: Sell positions below pivot with targets at 1.36140 & 1.35700 in extension.
Alternative Price Action: The price above pivot would call for further upside to 1.37810 & 1.38210.
Comment: Pair below its 50MA & 20MA and RSI below 50 levels.
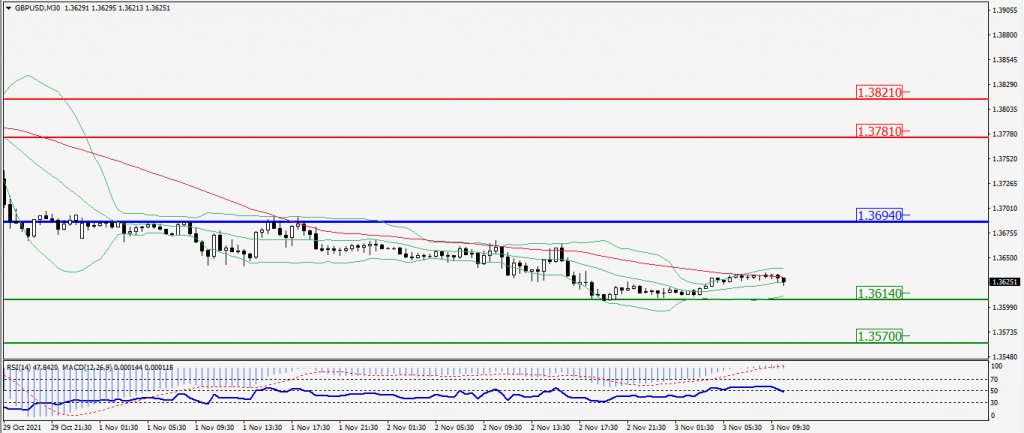
Green Lines Indicate Resistance Levels – Red Lines Indicates Support Levels
Light Blue is a Pivot Point – Black represents the price when the report was produced
USD/JPY Intraday: Resistance at 114.060
Our pivot point is at 114.060
Preferable Price Action: Sell position below pivot with the target at 113.490 and 113.190 in extension.
Alternative Price Action: The upside breakout of the pivot would call for 114.580 and 114.880.
Comment: Price below its 55MA & 20MA and MACD in negative territory.
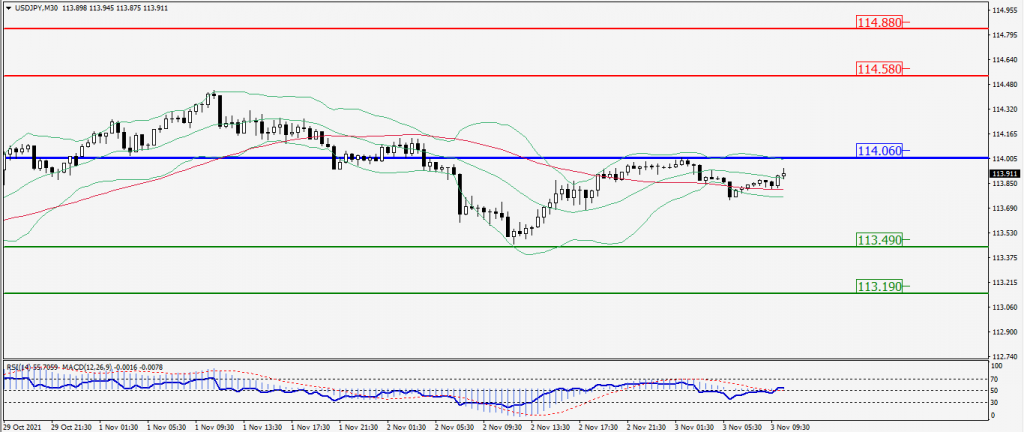
Green Lines Indicate Resistance Levels – Red Lines Indicates Support Levels
Light Blue is a Pivot Point – Black represents the price when the report was produced
AUD/USD Intraday: Break support level
Our pivot point is at 0.74930
Preferable Price Action: Sell Positions below pivot with targets at 0.74300 & 0.73940 in extension.
Alternative Price Action: Above pivot looks for a further upside with 0.75630 & 0.76020 as targets.
Comment: Pair below its 55MA & 20MA and RSI below 50 levels.
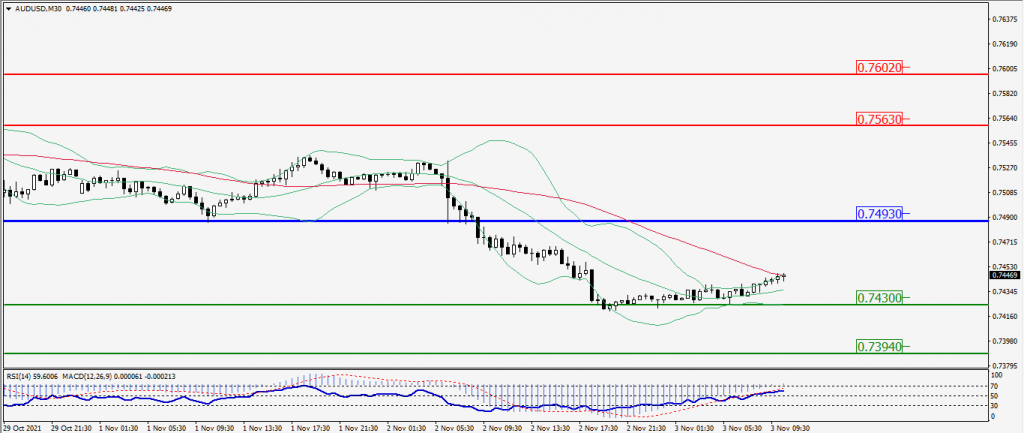
Green Lines Indicate Resistance Levels – Red Lines Indicates Support Levels
Light Blue is a Pivot Point – Black represents the price when the report was produced
CRUDEOIL Intraday: Trend on the downside
Our pivot point is at 83.00
Preferable Price Action: Below pivots sell Oil with 80.70 & 79.40 as targets.
Alternative Price Action: Buy crude above pivot with targets at 85.10 and 86.20 in extension.
Comment: Crude is above its 55MA & 20MA and MACD in the positive territory.
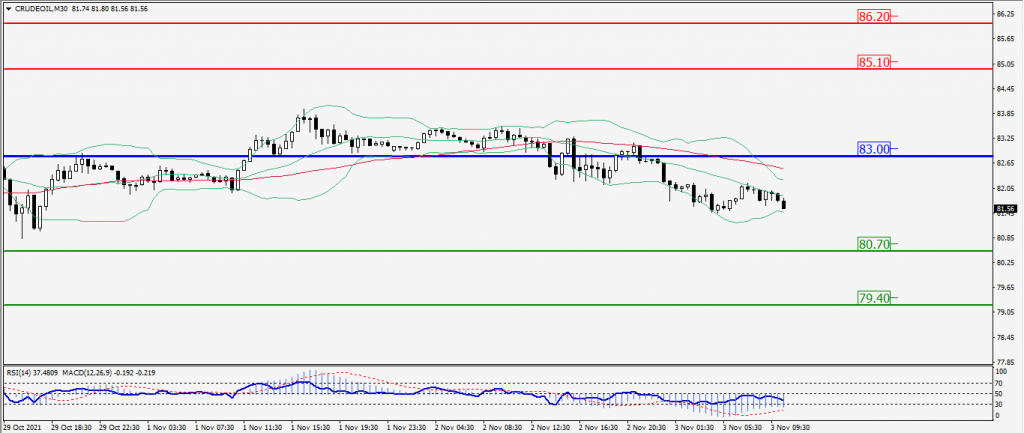
Green Lines Indicate Resistance Levels – Red Lines Indicates Support Levels
Light Blue is a Pivot Point – Black represents the price when the report was produced
XAU/USD Intraday: Trend on the downside
Our pivot point is 1790.00
Preferable Price Action: Further Downside to 1773.20 and 1764.20
Alternative Price Action: If the price gives an Upside breakout of a pivot, then the price extends to 1808.10 and 1817.80.
Comment: MACD in flat territory and price above its 55MA.
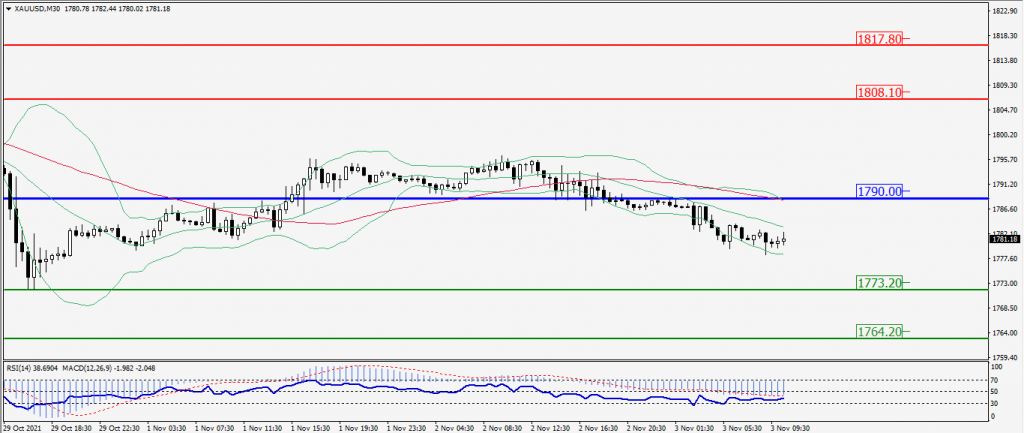
Green Lines Indicate Resistance Levels – Red Lines Indicates Support Levels
Light Blue is a Pivot Point – Black represents the price when the report was produced
Dow Jones Intraday: Support at 35,920.00
Our pivot point is 35,920.00
Preferable Price Action: Take long positions above pivot with targets at 36170.00 & 36,300.00.
Alternative Price Action: Below 35,790.00 looks for further downside to 35,670.00 & 35,510.00.
Comment: Price above its 55MA and RSI above 50 levels.
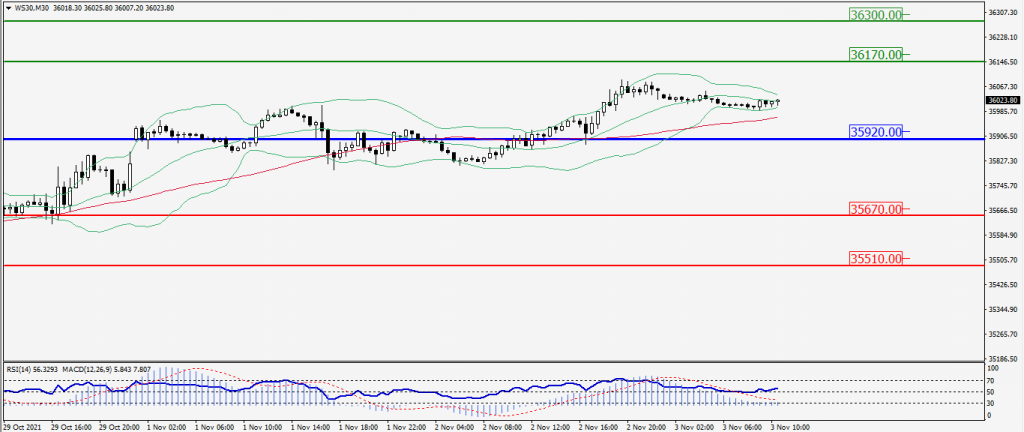
Green Lines Indicate Resistance Levels – Red Lines Indicates Support Levels
Light Blue is a Pivot Point – Black represents the price when the report was produced