Market Wrap: Stocks, Bonds, Commodities
The Dow Jones Industrial Average was advanced 125.39 points (0.35%) at 35,866.54 to hit a record high. The S&P 500 was gained 24.64 points (0.54%) at 4,591.12, and the Nasdaq Composite was rose 94.73 points (0.62%) at 15,321.44.
Asia’s major stock index was down on Wednesday as traders remained concerned about the risk from elevated inflation and the indebted real estate sector in China.
MSCI’s index of Asia-Pacific stocks outside Japan is fell 0.91% to 822.63 levels. Australian index rose 0.07% to 7,448.70. Japanese Nikkei Index lower 0.05% to 29,098.24.
European stocks were lower on Wednesday, with the Stoxx Europe 50 Index falling 0.05% to 4,222.45, Germany’s DAX lost 0.12% to 15,737.75, and France’s CAC slipped 0.05% to 6,766.10, and U.K.’s FTSE 100 down 0.05% to 7,275.00.
Benchmark 10-year U.S. Treasury rose as demand for safe assets grows again, today 10-year bond yields rose 0.10% to 1.620.
Oil prices fell on Wednesday as data publish crude oil stockpiles were higher than expected and fuel inventories unexpectedly increased last week in the United States.
Spot Brent crude oil fell 1.16% to $84.67 per barrel. US West Texas Intermediate crude slipped 1.25% to $83.58 a barrel.
The yellow metal traded 0.14% lower to 1791.05 dollars per ounce.
Market Wrap: Forex
The US dollar edged up on Tuesday in narrow-range trading as markets awaited news from upcoming central bank meetings that might spark volatility.
Today, the U.S. dollar index measures the greenback against a trade-weighted basket of six major currencies, which lower 0.10% to 93.855.
The Euro US Dollar (EUR/USD) is a widely traded pair that is rose 0.11% today. This left the pairing trading around $1.16060.
The Japanese yen rose against the U.S. dollar on Wednesday as the stock pushes higher. Today US/JPY is fell 0.11% to 113.990 level.
Another commodity-related currency higher against the U.S dollar, AUD/USD rose 0.40% to 0.75280, and NZD/USD flat to 0.71710 level.
EUR/USD Intraday: Support at 1.15890
Our pivot point is at 1.15890
Preferable Price Action: Take Long positions Above pivot level with targets at 1.16290 & 1.16490 in extension.
Alternative Price Action: Below pivot looks for a further Downside to 1.15540 & 1.15340.
Comment: Pair above its 55MA & 20MA and RSI above 50 levels.
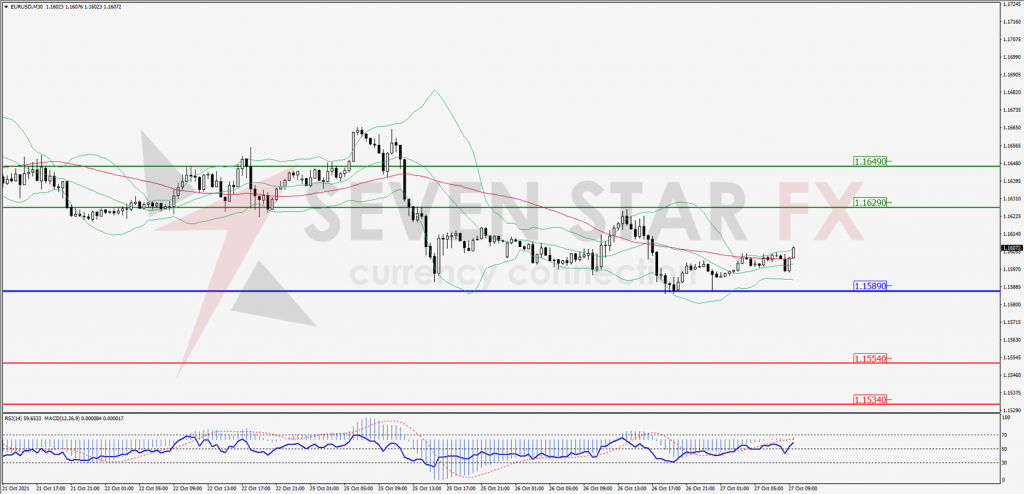
Green Lines Indicate Resistance Levels – Red Lines Indicates Support Levels
Light Blue is a Pivot Point – Black represents the price when the report was produced
GBP/USD Intraday: In a consolidation zone
Our pivot point is at 1.37580
Preferable Price Action: Buy positions above pivot with targets at 1.38060 & 1.38340 in extension.
Alternative Price Action: The price below pivot would call for further downside to 1.37110 & 1.36820.
Comment: Pair above its 50MA & 20MA and RSI above 50 levels.
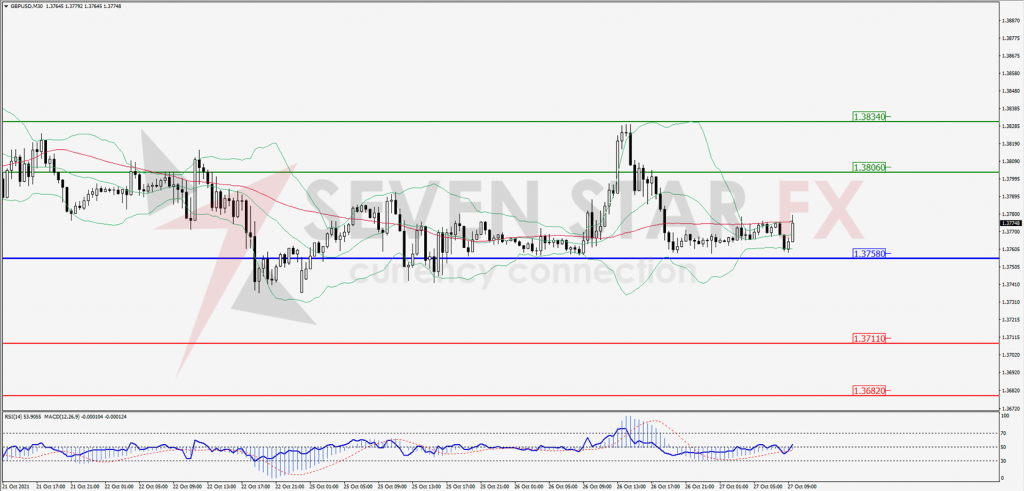
Green Lines Indicate Resistance Levels – Red Lines Indicates Support Levels
Light Blue is a Pivot Point – Black represents the price when the report was produced
USD/JPY Intraday: Resistance at 114.220
Our pivot point is at 114.220
Preferable Price Action: Sell position Below pivot with the target at 113.830 and 113.610 in extension.
Alternative Price Action: The Upside breakout of the pivot would call for 114.580 and 114.770.
Comment: Price below its 55MA & 20MA and MACD in negative territory.
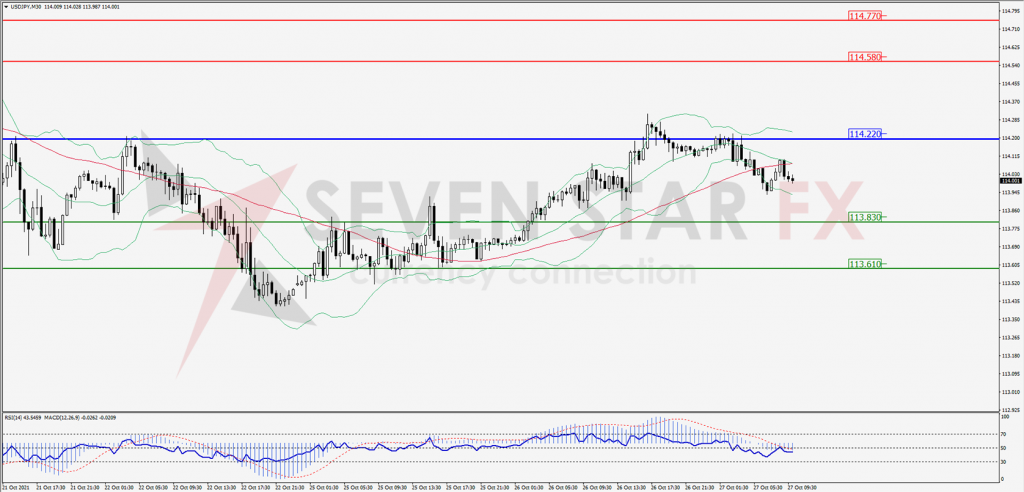
Green Lines Indicate Resistance Levels – Red Lines Indicates Support Levels
Light Blue is a Pivot Point – Black represents the price when the report was produced
AUD/USD Intraday: Trend on the upside
Our pivot point is at 0.75020
Preferable Price Action: Buy Positions above pivot with targets at 0.75460 & 0.75700 in extension.
Alternative Price Action: Below pivot looks for a further downside with 0.74550 & 0.74280 as targets.
Comment: Pair above its 55MA & 20MA and RSI above 50 levels.
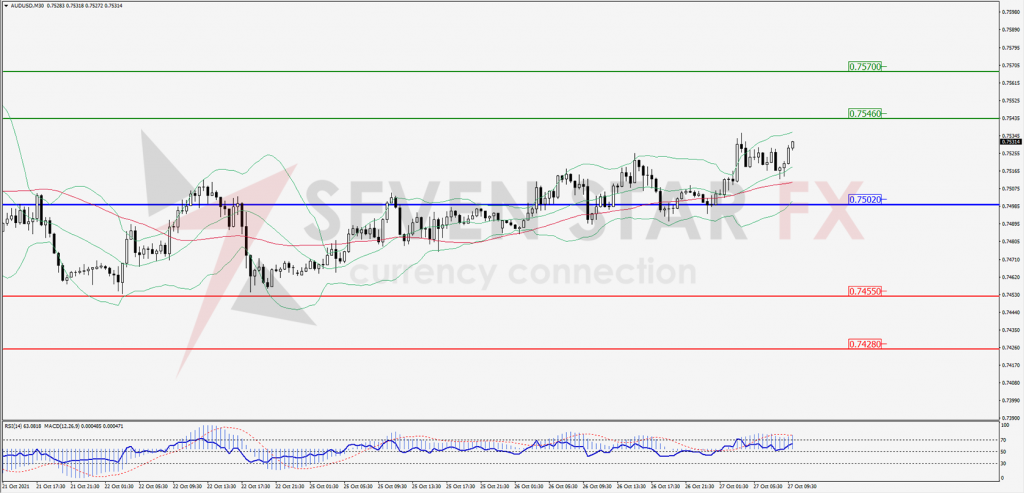
Green Lines Indicate Resistance Levels – Red Lines Indicates Support Levels
Light Blue is a Pivot Point – Black represents the price when the report was produced
CRUDEOIL Intraday: Trend may reverse from here
Our pivot point is at 84.10
Preferable Price Action: Below pivots Sell Oil with 82.30 & 81.20 as targets.
Alternative Price Action: Buy crude Above pivot with targets at 85.80 and 86.60 in extension.
Comment: Crude is below its 55MA & 20MA and MACD in the negative territory.
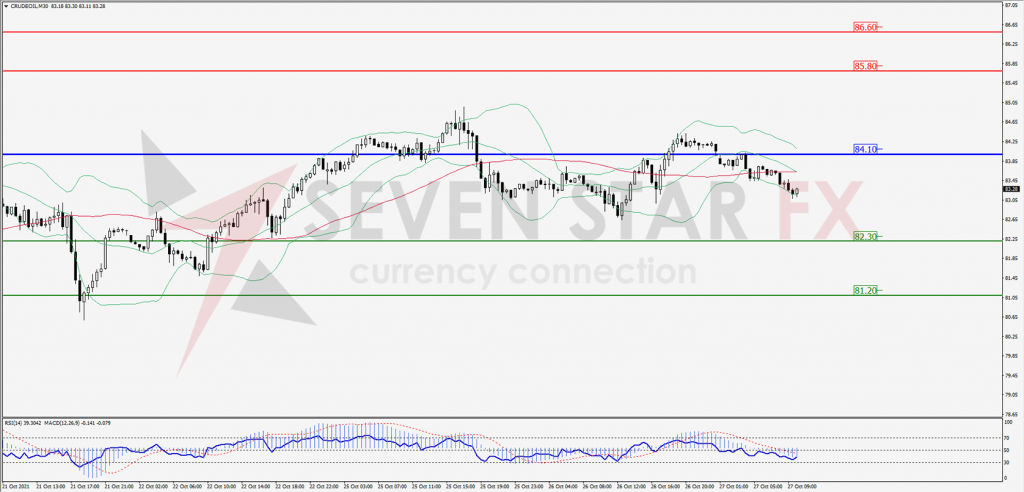
Green Lines Indicate Resistance Levels – Red Lines Indicates Support Levels
Light Blue is a Pivot Point – Black represents the price when the report was produced
XAU/USD Intraday: Resistance at 1798.60
Our pivot point is 1798.60
Preferable Price Action: Further downside to 1782.10 and 1774.00.
Alternative Price Action: If the price gives an upside breakout of a pivot, then the price extends to 1814.00 and 1822.30.
Comment: MACD in negative territory and price below its 20MA & 55MA.
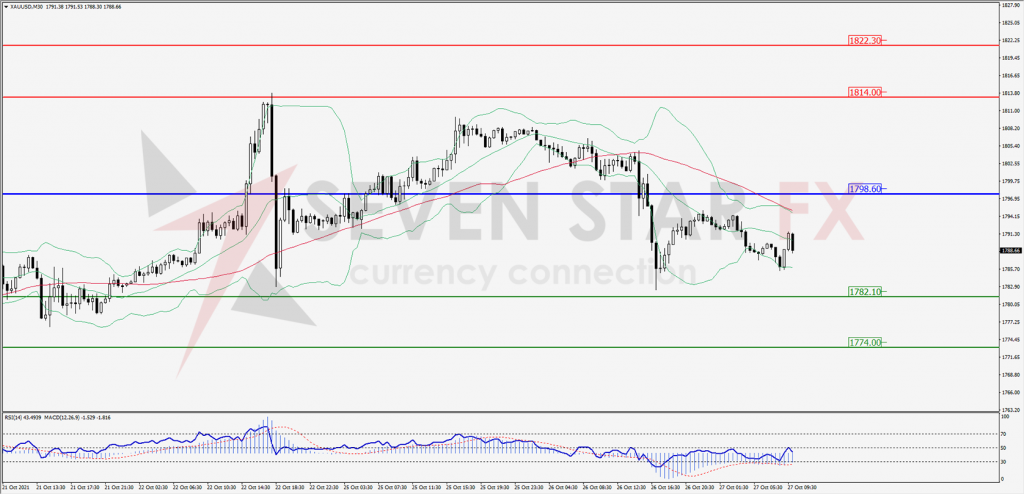
Green Lines Indicate Resistance Levels – Red Lines Indicates Support Levels
Light Blue is a Pivot Point – Black represents the price when the report was produced
Dow Jones Intraday: Trend on the upside
Our pivot point is 35,674.00
Preferable Price Action: Take long positions above pivot with targets at 35,875.00 & 35,973.00.
Alternative Price Action: Below 35,674.00 looks for further downside to 35,480.00 & 35,385.00.
Comment: Price above its 55MA & 20MA and RSI above 50 levels.
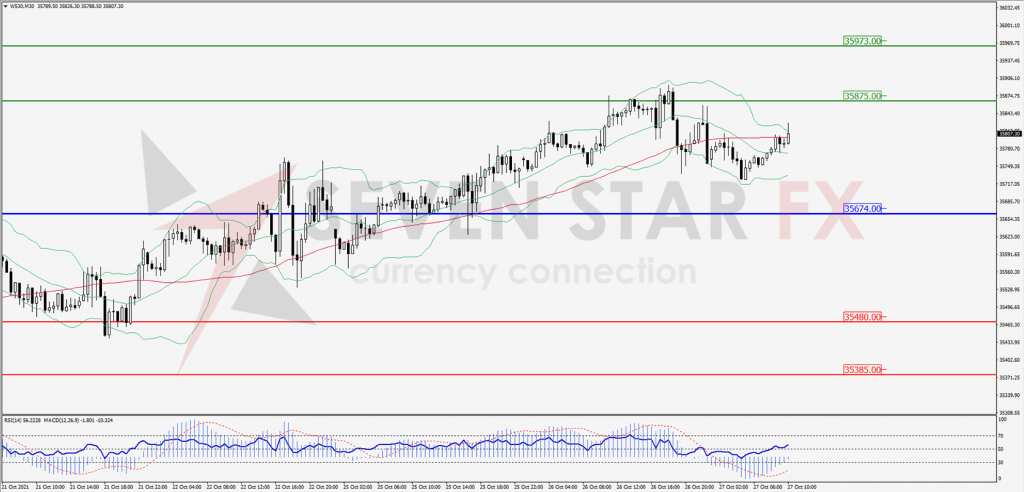
Green Lines Indicate Resistance Levels – Red Lines Indicates Support Levels
Light Blue is a Pivot Point – Black represents the price when the report was produced