Market Wrap: Stocks, Bonds, Commodities
Global capital market indices decline on Monday as traders concerns about U.S.-China trade tensions and rising inflation as crude oil prices advance to multi-year highs.
The Dow Jones Industrial Average slipped 0.94% to 34,002.92, the S&P 500 down 1.30% to 4,300.46 and the Nasdaq Composite lost 2.14% to 14,255.49.
Asian stocks posses heavy losses on Tuesday as a broad selling on the American market, as traders fretted about the impact of multi-year high oil prices at a time when supply chain disruptions are already putting pressure on economic activity.
MSCI’s index of Asia-Pacific stocks outside Japan fell 0.43% to 785.18 levels. Australian index decline 0.41% to 7,248.40. Japanese Nikkei Index plunged 2.19% to 27,822.12.
European stocks were higher on Tuesday, with the Stoxx Europe 50 Index gained 0.29% to 4,008.05, Germany’s DAX rose 0.10% to 15,051.95, and France’s CAC advance 0.12% to 6,485.60, and U.K.’s FTSE 100 up 0.28% to 7,030.60.
Benchmark 10-year U.S. Treasury rose as demand for safe assets grows again, today 10-year bond yields rose 0.56% to 1.489.
OPEC+ passes an agreement on Monday to stay with to an existing pact to hike oil output by 400,000 barrels per day in November, despite people’s calls for more crude production and rising prices that threaten an economic recovery from the pandemic.
Spot Brent crude oil increase 0.48% to $81.65 per barrel. US West Texas Intermediate crude gained 0.39% to $77.91 a barrel.
The yellow metal traded 0.49% lower to 1758.95 dollars per ounce.
Market Wrap: Forex
The US dollar index slipped versus major peers on Monday as traders waited on key US payrolls data at the end of the week for clues on the timing of a tapering of Federal Reserve stimulus and the start of interest rate hikes.
Today, the U.S. dollar index measures the greenback against a trade-weighted basket of six major currencies, which rose 0.20% to 93.965.
The Euro US Dollar (EUR/USD) is a widely traded pair that is fell 0.16% today. This left the pairing trading around $1.16030.
The Japanese yen fell against the U.S. dollar on Tuesday as the stock pushes higher. Today US/JPY is rose 0.30% to 111.180 level.
Another commodity-related currency lower against the U.S dollar, AUD/USD fell 0.16% to 0.72710, and NZD/USD slipped 0.10% to 0.69530 level.
EUR/USD Intraday: Resistance at 1.16150
Our pivot point is at 1.16150
Preferable Price Action: Take short positions below pivot level with targets at 1.15780 & 1.1560 in extension.
Alternative Price Action: above pivot looks for a further upside to 1.16520 & 1.16690.
Comment: Pair below its 55MA & 20MA and RSI below 50 levels.
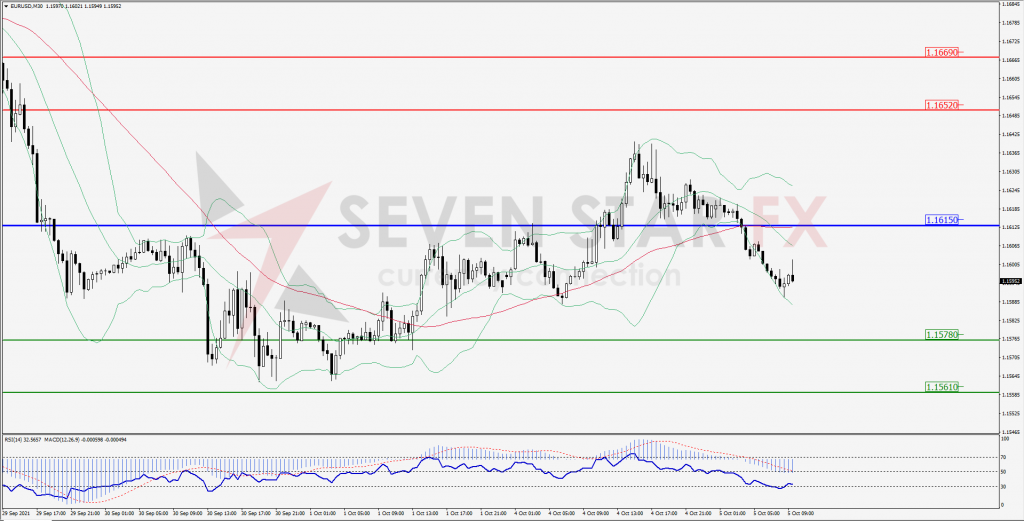
Green Lines Indicate Resistance Levels – Red Lines Indicates Support Levels
Light Blue is a Pivot Point – Black represents the price when the report was produced
GBP/USD Intraday: Break Resistance level
Our pivot point is at 1.35620
Preferable Price Action: Buy positions above pivot with targets at 1.36340 & 1.36690 in extension.
Alternative Price Action: The price below pivot would call for further downside to 1.34820 & 1.34440.
Comment: Pair above its 55MA and RSI near 50 levels.
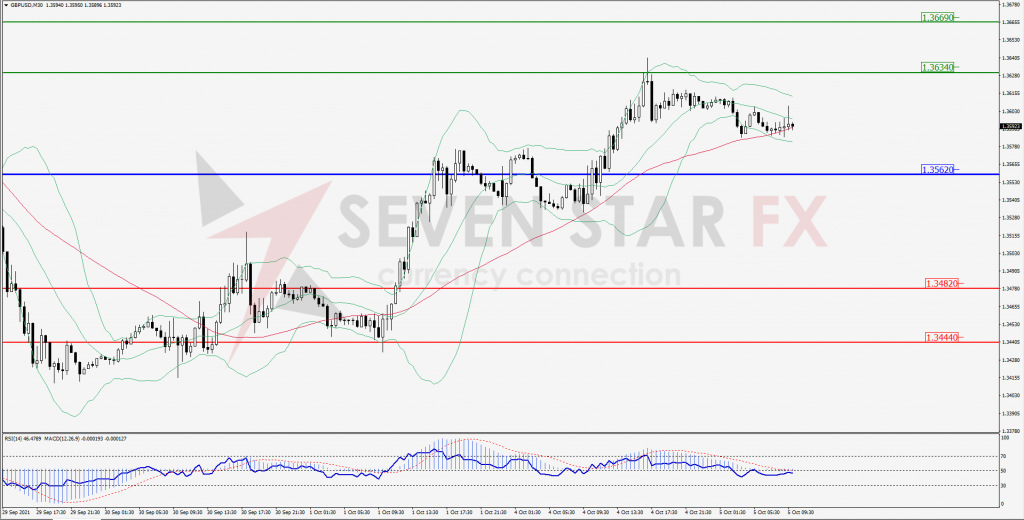
Green Lines Indicate Resistance Levels – Red Lines Indicates Support Levels
Light Blue is a Pivot Point – Black represents the price when the report was produced
USD/JPY Intraday: Trend may change to upside
Our pivot point is at 110.990
Preferable Price Action: Buy position above pivot with the target at 111.470 and 111.750 in extension.
Alternative Price Action: The downside breakout of the pivot would call for 110.490 and 110.220.
Comment: Price above its 55MA & 20MA and MACD in positive territory.
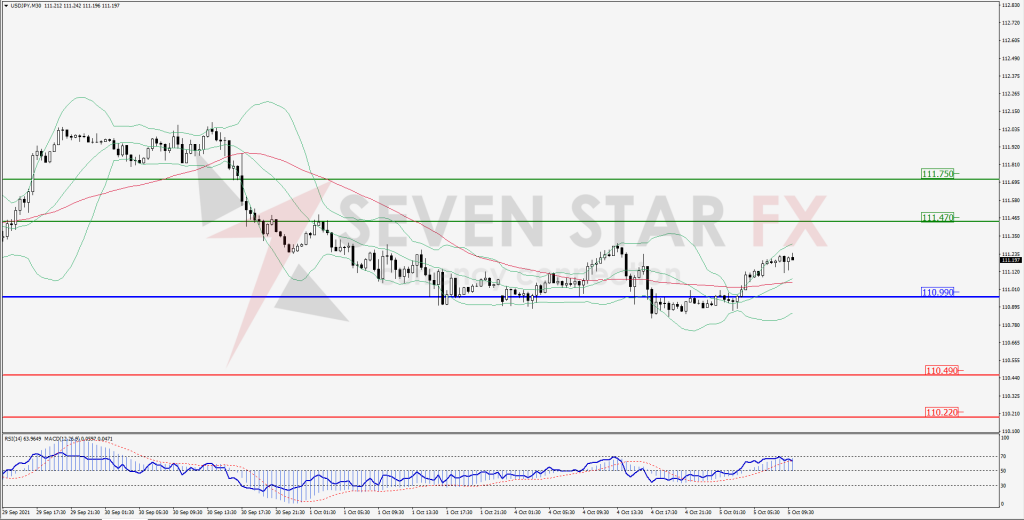
Green Lines Indicate Resistance Levels – Red Lines Indicates Support Levels
Light Blue is a Pivot Point – Black represents the price when the report was produced
AUD/USD Intraday: Resistance at 0.72790
Our pivot point is at 0.72790
Preferable Price Action: Sell Positions below pivot with targets at 0.72350 & 0.72150 in extension.
Alternative Price Action: Above pivot looks for a further upside with 0.73200 & 0.73400 as targets.
Comment: Pair below its 55MA and RSI below 50 levels.
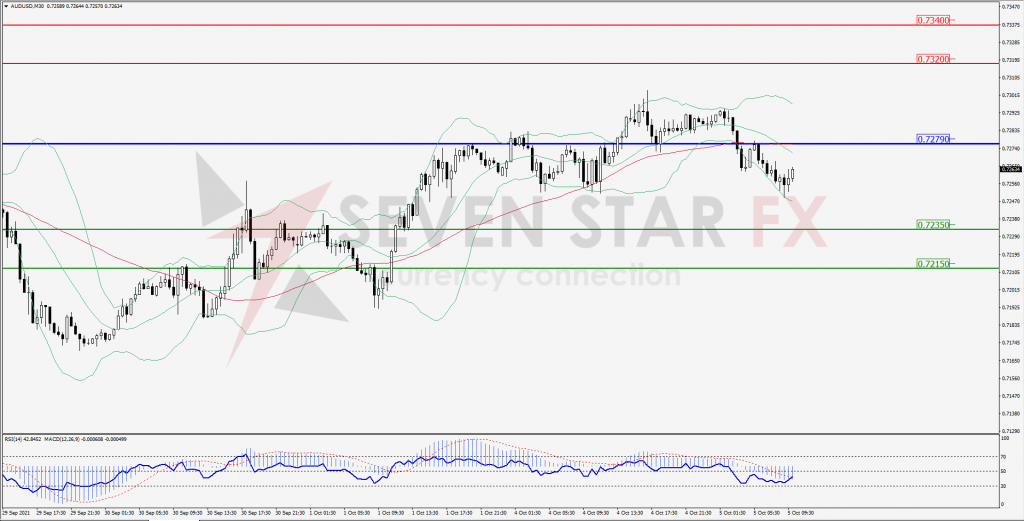
Green Lines Indicate Resistance Levels – Red Lines Indicates Support Levels
Light Blue is a Pivot Point – Black represents the price when the report was produced
CRUDEOIL Intraday: Strong trend on the upside
Our pivot point is at 76.73
Preferable Price Action: Above pivots buy Oil with 78.68 & 79.48 as targets.
Alternative Price Action: Sell crude below pivot with targets at 74.68 and 73.74 in extension.
Comment: Crude is above its 55MA and MACD in the positive territory.
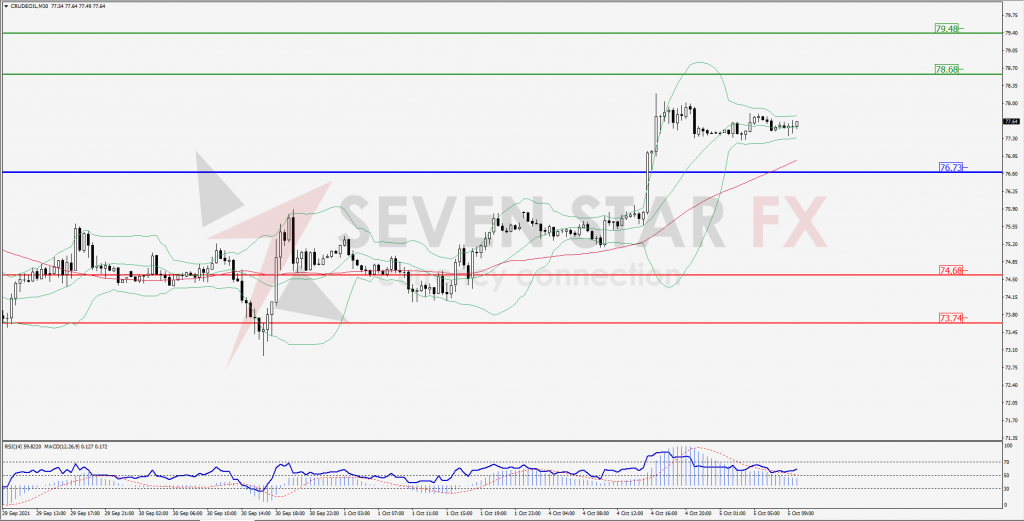
Green Lines Indicate Resistance Levels – Red Lines Indicates Support Levels
Light Blue is a Pivot Point – Black represents the price when the report was produced
XAU/USD Intraday: Resistance at 1766.60
Our pivot point is 1766.60
Preferable Price Action: Further downside to 1749.40 and 1739.30
Alternative Price Action: If the price gives a upside breakout of a pivot, then the price extends to 1783.60 and 1792.50.
Comment: MACD in negative territory and price below its 20MA & 55MA.
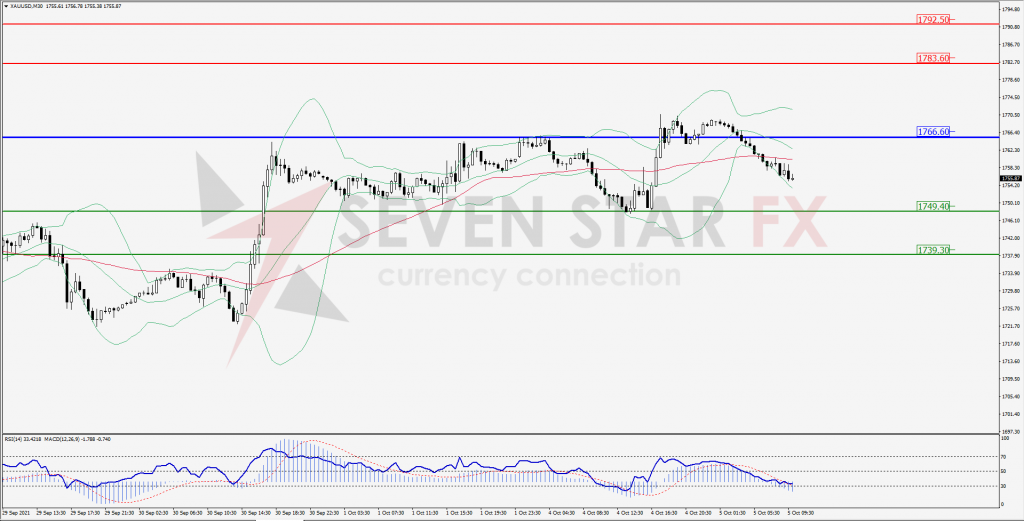
Green Lines Indicate Resistance Levels – Red Lines Indicates Support Levels
Light Blue is a Pivot Point – Black represents the price when the report was produced
Dow Jones Intraday: Trend may change to upside
Our pivot point is 33,876.00
Preferable Price Action: Take long positions above pivot with targets at 34,395.00 & 34,668.00.
Alternative Price Action: below 33,876.00 looks for further downside to 33,317.00 & 33,045.00.
Comment: Price above its 20MA and RSI at 50 levels.
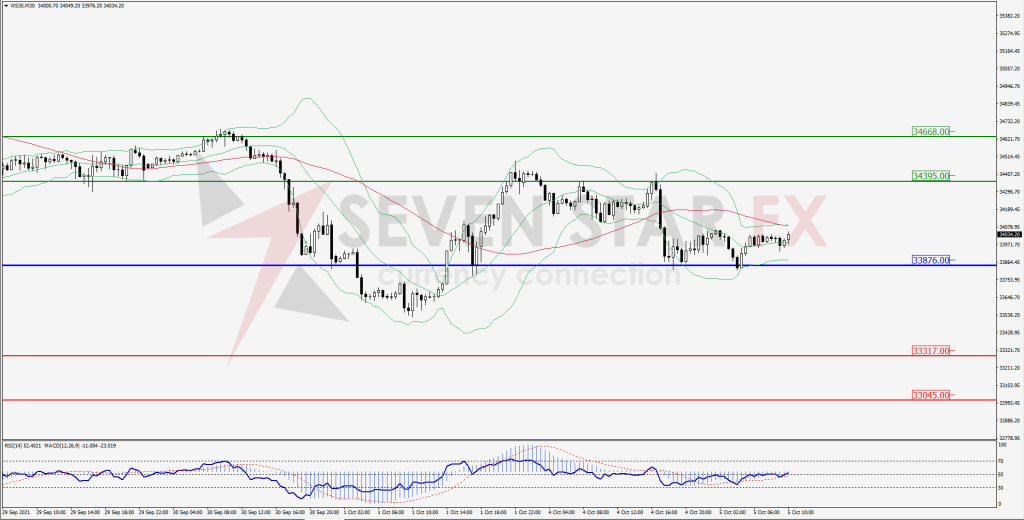
Green Lines Indicate Resistance Levels – Red Lines Indicates Support Levels
Light Blue is a Pivot Point – Black represents the price when the report was produced