Market Wrap: Stocks, Bonds, Commodities
Wall Street indexes bounced back from recent losses on Wednesday as concerns over a default by China’s Evergrande eased, with investors now awaiting policy cues from a Federal Reserve meeting later in the day.
The Dow Jones Industrial Average rose 475.84 points (1.40%) to 34,395.68, the S&P 500 gained 54.62 points (1.25%) to 4,408.73 and the Nasdaq Composite gained 169.77 points (1.16 %) to 14,916.92.
The Federal Reserve said on Wednesday it will likely begin reducing its monthly bond purchases as soon as November and signaled interest rate increases may follow more quickly than expected as the U.S. central bank’s turn from pandemic crisis policies gains momentum.
Asian shares made cautious gains on Thursday, supported by some positive news from cash-strapped developer China Evergrande Group, while the dollar held near a one-month top after the U.S. Federal Reserve took a hawkish tilt overnight.
MSCI’s index of Asia-Pacific stocks outside Japan gained 0.66% to 811.48 levels. Australian index gained 1.00% to 7,370.20. Japanese market closed today.
European stocks were higher on Thursday, with the Stoxx Europe 50 Index rose 0.82% to 4,184.15, Germany’s DAX gained 0.75% to 15,623.45, and France’s CAC up 0.75% to 6,686.52, and U.K.’s FTSE 100 up 0.36% to 7,108.75.
Benchmark 10-year U.S. Treasury rose as demand for safe assets grows again, today 10-year bond yields surged 0.39% to 1.336.
Oil prices rose on Thursday, extending strong gains overnight with fuel demand growing and crude stocks declining as production remains hampered in the U.S. Gulf of Mexico after two hurricanes.
Spot Brent crude oil rose 0.10% to $76.22 per barrel. US West Texas Intermediate crude flat to $72.25 a barrel.
The yellow metal traded lower 0.85% to 1763.85 dollars per ounce.
Market Wrap: Forex
The dollar hit its highest in a month on Thursday and pressed the euro towards major support levels, after the Federal Reserve set the stage for rate hikes next year — far sooner than its developed market peers are expected to move.
Today, the U.S. dollar index measures the greenback against a trade-weighted basket of six major currencies, which slipped 0.20% to 93.290.
The Euro US Dollar (EUR/USD) is a widely traded pair that up 0.21% today. This left the pairing trading around $1.17110.
The Japanese yen fell against the U.S. dollar on Thursday as the stock pushes higher. Today US/JPY rose 0.19%to 109.970 level.
Another commodity-related currency higher against the U.S dollar, AUD/USD gained 0.19% to 0.72580, and NZD/USD rose 0.17% to 0.70190 level.
EUR/USD Intraday: Support at 1.17020
Our pivot point is at 1.17020
Preferable Price Action: Take long positions above pivot level with targets at 1.17380 & 1.17590 in extension.
Alternative Price Action: Below pivot looks for a further downside to 1.16720 & 1.16530.
Comment: Pair above its 20MA & 55MA and RSI above 50 levels.
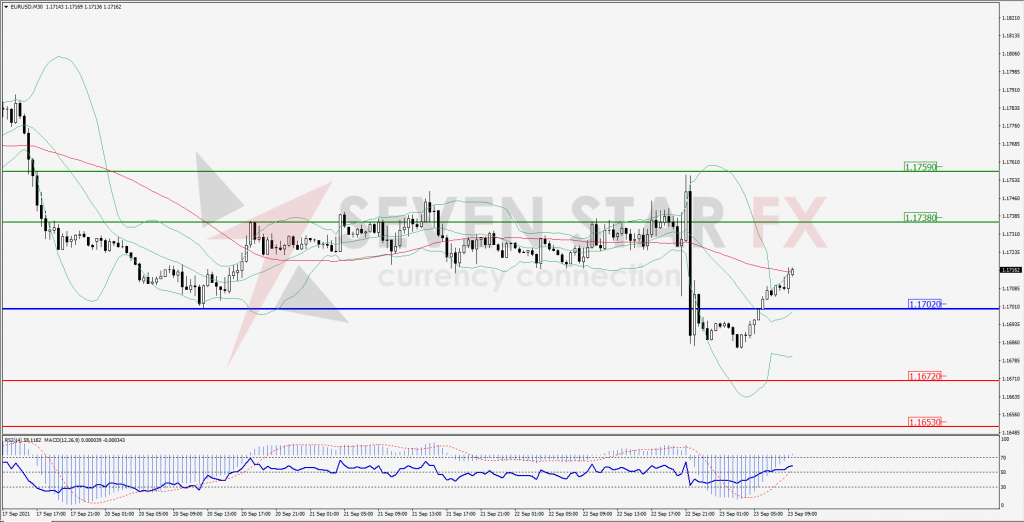
Green Lines Indicate Resistance Levels – Red Lines Indicates Support Levels
Light Blue is a Pivot Point – Black represents the price when the report was produced
GBP/USD Intraday: Support at 1.36200
Our pivot point is at 1.36200
Preferable Price Action: Buy positions above pivot with targets at 1.36980 & 1.37440 in extension.
Alternative Price Action: The price below pivot would call for further downside to 1.35440 & 1.35020.
Comment: Pair above its 55MA & 20MA and RSI above 50 levels.
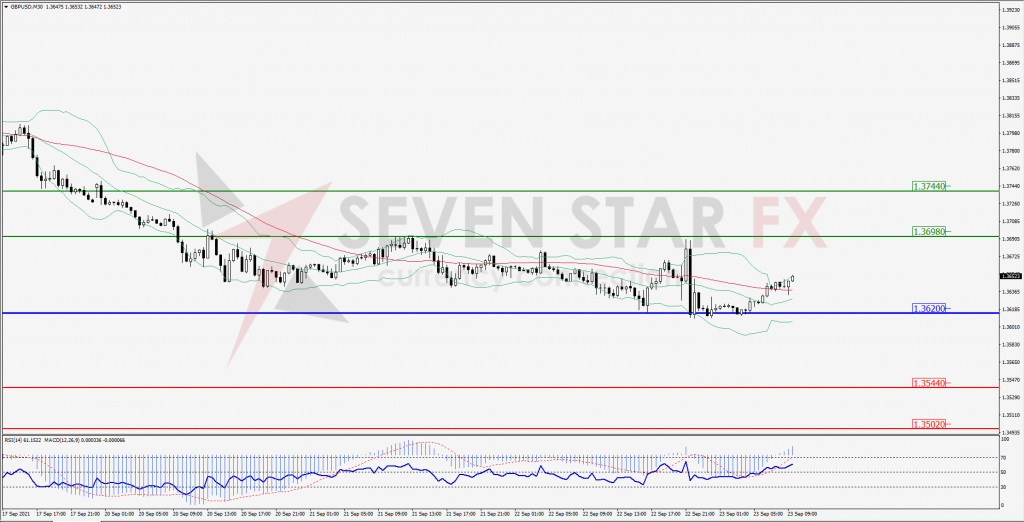
Green Lines Indicate Resistance Levels – Red Lines Indicates Support Levels
Light Blue is a Pivot Point – Black represents the price when the report was produced
USD/JPY Intraday: Break resistnace level
Our pivot point is at 109.730
Preferable Price Action: Buy position above pivot with the target at 110.010 and 110.140 in extension.
Alternative Price Action: The downside breakout of the pivot would call for 109.490 and 109.350.
Comment: Price above its 55MA & 20MA and MACD in positive territory.
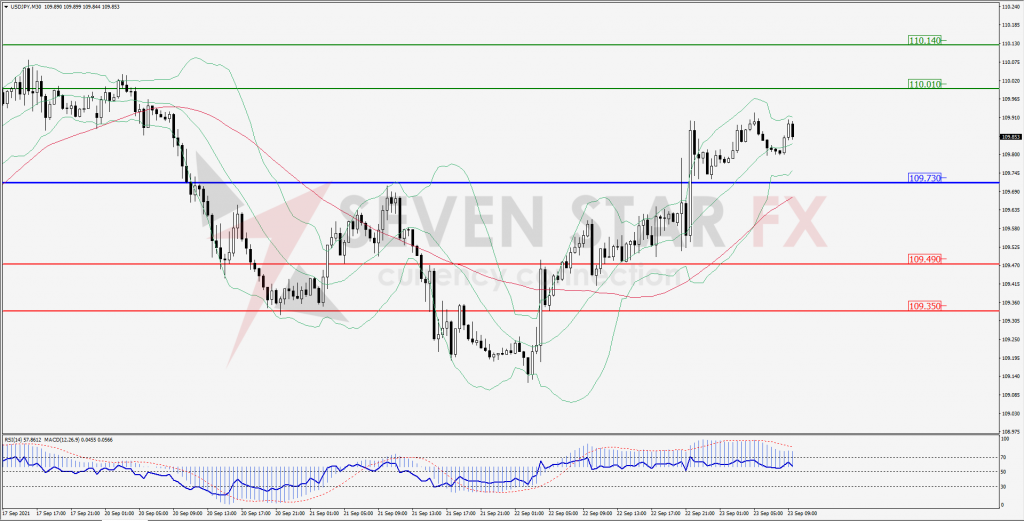
Green Lines Indicate Resistance Levels – Red Lines Indicates Support Levels
Light Blue is a Pivot Point – Black represents the price when the report was produced
AUD/USD Intraday: In a consolidation zone
Our pivot point is at 0.72330
Preferable Price Action: Buy Positions above pivot with targets at 0.72770 & 0.72990 in extension.
Alternative Price Action: Below pivot looks for a further downside with 0.71910 & 0.71690 as targets.
Comment: Pair above its 55MA & 20MA and RSI above 50 levels.
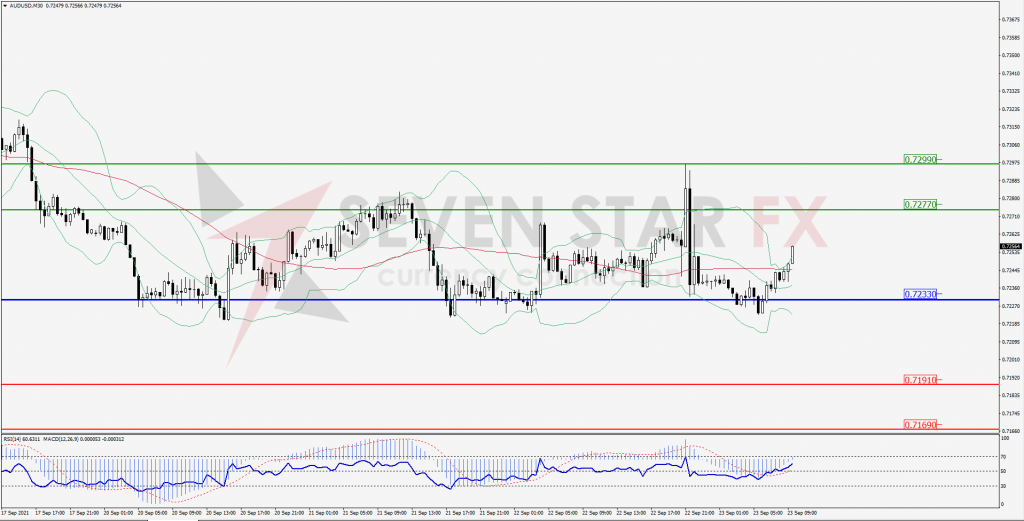
Green Lines Indicate Resistance Levels – Red Lines Indicates Support Levels
Light Blue is a Pivot Point – Black represents the price when the report was produced
CRUDEOIL Intraday: Break resistance level
Our pivot point is at 71.67
Preferable Price Action: Above pivots buy Oil with 72.77 & 73.30 as targets.
Alternative Price Action: Sell crude below pivot with targets at 70.61 and 70.05 in extension.
Comment: Crude is above its 55MA & 20MA and MACD in the positive territory.
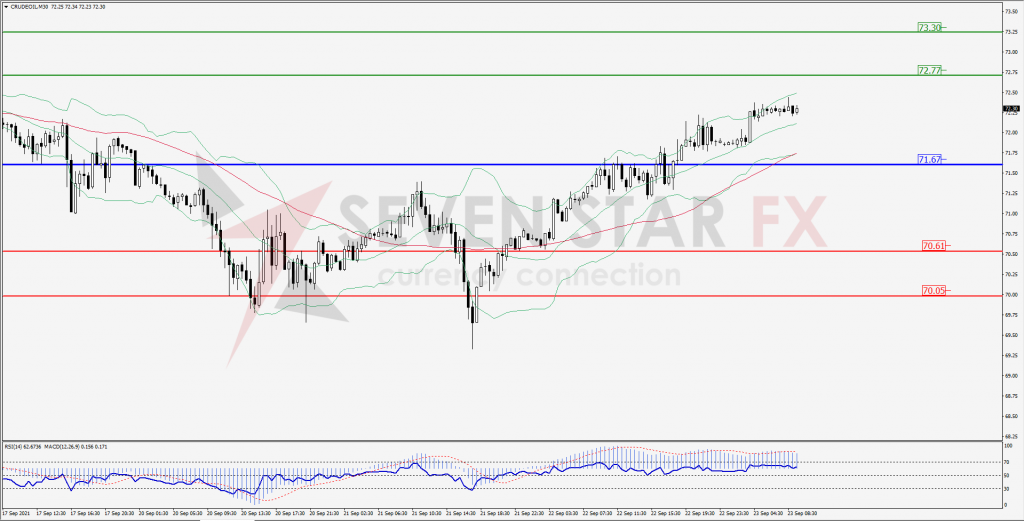
Green Lines Indicate Resistance Levels – Red Lines Indicates Support Levels
Light Blue is a Pivot Point – Black represents the price when the report was produced
XAU/USD Intraday: Break support level
Our pivot point is 1771.70
Preferable Price Action: Further downside to 1757.90 and 1751.80.
Alternative Price Action: If the price gives an upside breakout of a pivot, then the price extends to 1783.70 and 1789.20.
Comment: MACD in negative territory and price below its 20MA & 55MA.
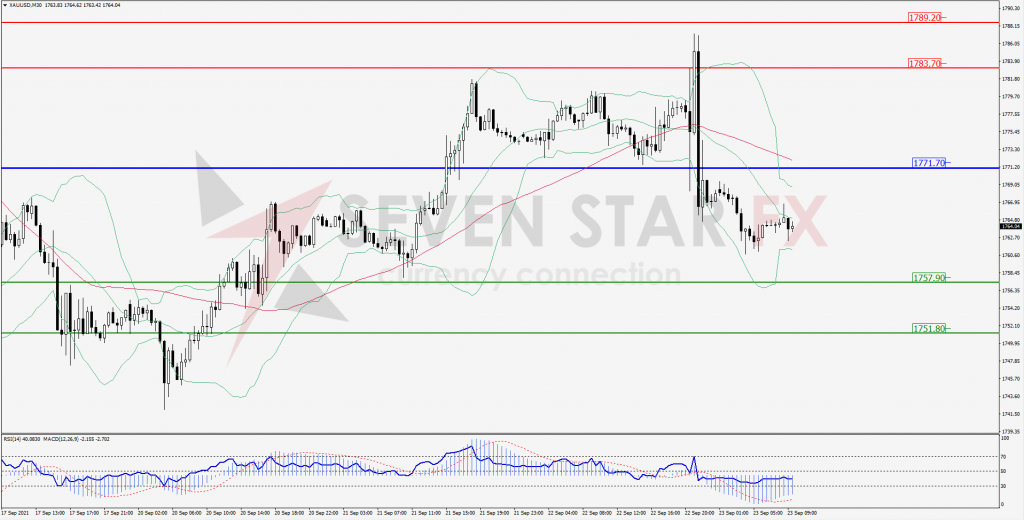
Green Lines Indicate Resistance Levels – Red Lines Indicates Support Levels
Light Blue is a Pivot Point – Black represents the price when the report was produced
Dow Jones Intraday: Break resistance level
Our pivot point is 34,200.00
Preferable Price Action: Take long positions above pivot with targets at 34,563.00 & 34,729.00.
Alternative Price Action: Below 34,200.00 looks for further downside to 33,852.00 & 33,692.00.
Comment: Price above it 55MA & 20MA and RSI above 50 levels.
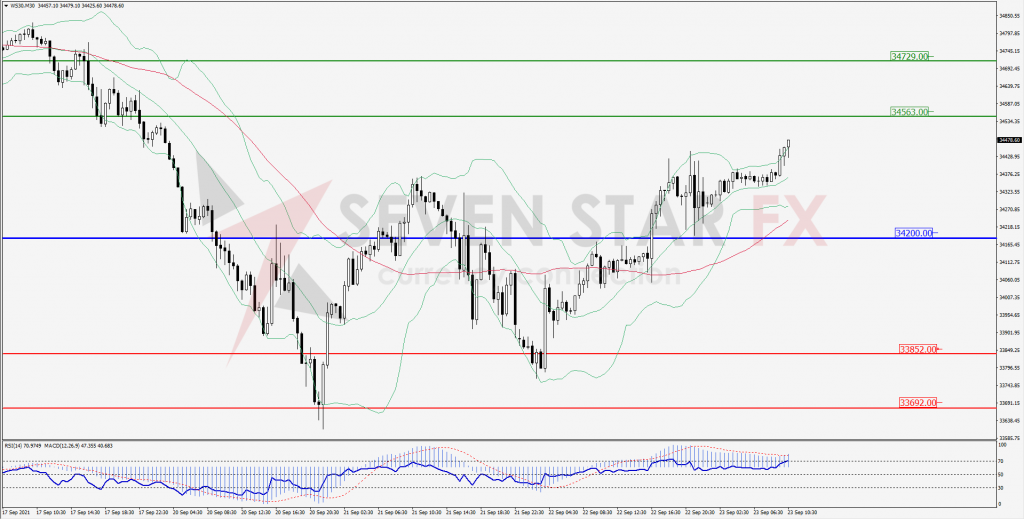
Green Lines Indicate Resistance Levels – Red Lines Indicates Support Levels
Light Blue is a Pivot Point – Black represents the price when the report was produced