Market Wrap: Stocks, Bonds, Commodities
US stocks ended near flat on Tuesday after a broad sell-off the day before, with worries over troubles at developer China Evergrande and caution ahead of Wednesday’s Federal Reserve policy news keeping a lid on the market.
The Dow Jones Industrial Average fell 50.63 points (0.15%) to 33,919.84, the S&P 500 lost 3.54 points (0.08%) to 4,354.19 and the Nasdaq Composite added 32.50 points (0.22%) to 14,746.40.
Asian stock markets made a cautious start on Wednesday and the dollar held firm amid lingering nerves about the fallout from a looming failure at developer China Evergrande and anticipation the Federal Reserve may move a step closer to tapering.
MSCI’s index of Asia-Pacific stocks outside Japan lost 0.50% to 804.27 levels. Australian index gained 0.32% to 7,296.90. Japanese market plunged 0.67% to 29,639.40.
European stocks were higher on Wednesday, with the Stoxx Europe 50 Index rose 0.63% to 4,123.36, Germany’s DAX gained 0.37% to 15,406.15, and France’s CAC up 0.90% to 6,611.50, and U.K.’s FTSE 100 up 0.87% to 7,042.66.
Benchmark 10-year U.S. Treasury rose as demand for safe assets grows again, today 10-year bond yields surged 0.66% to 1.333.
Oil prices rose around 1% on Wednesday, extending overnight gains, after industry data showed U.S. crude stocks fell more than expected last week in the wake of two hurricanes, highlighting tight supply as demand improves.
Spot Brent crude oil rose 1.29% to $75.33 per barrel. US West Texas Intermediate crude advance 1.48% to $71.53 a barrel.
The yellow metal traded higher 0.10% to 1779.50 dollars per ounce.
Market Wrap: Forex
The U.S. dollar eased slightly from a near one-month high as global markets firmed somewhat on Tuesday a day after a risk-off mood dominated by solvency uncertainty of China’s Evergrande, while investors awaited the results of the Federal Reserve’s two-day policy meeting.
Today, the U.S. dollar index measures the greenback against a trade-weighted basket of six major currencies, which flat to 93.225.
The Euro US Dollar (EUR/USD) is a widely traded pair that up 0.06% today. This left the pairing trading around $1.17250.
The Japanese yen fell against the U.S. dollar on Wednesday as the stock pushes lower. Today US/JPY rose 0.33%to 109.560 level.
Another commodity-related currency higher against the U.S dollar, AUD/USD gained 0.33% to 0.72520, and NZD/USD rose 0.28% to 0.70240 level.
EUR/USD Intraday: Support at 1.17150
Our pivot point is at 1.17150
Preferable Price Action: Take long positions above pivot level with targets at 1.17410 & 1.17560 in extension.
Alternative Price Action: Below pivot looks for a further downside to 1.16910 & 1.16770.
Comment: Pair above its 20MA and RSI at 50 levels.
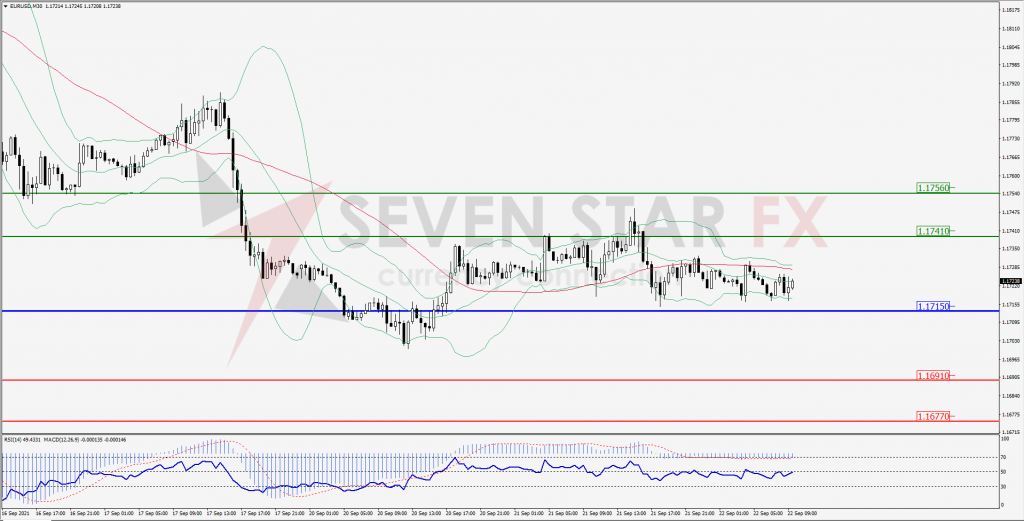
Green Lines Indicate Resistance Levels – Red Lines Indicates Support Levels
Light Blue is a Pivot Point – Black represents the price when the report was produced
GBP/USD Intraday: Resistance at 1.36930
Our pivot point is at 1.36930
Preferable Price Action: Sell positions below pivot with targets at 1.36320 & 1.35960 in extension.
Alternative Price Action: The price above pivot would call for further upside to 1.37550 & 1.37920.
Comment: Pair below its 55MA & 20MA and RSI below 50 levels.
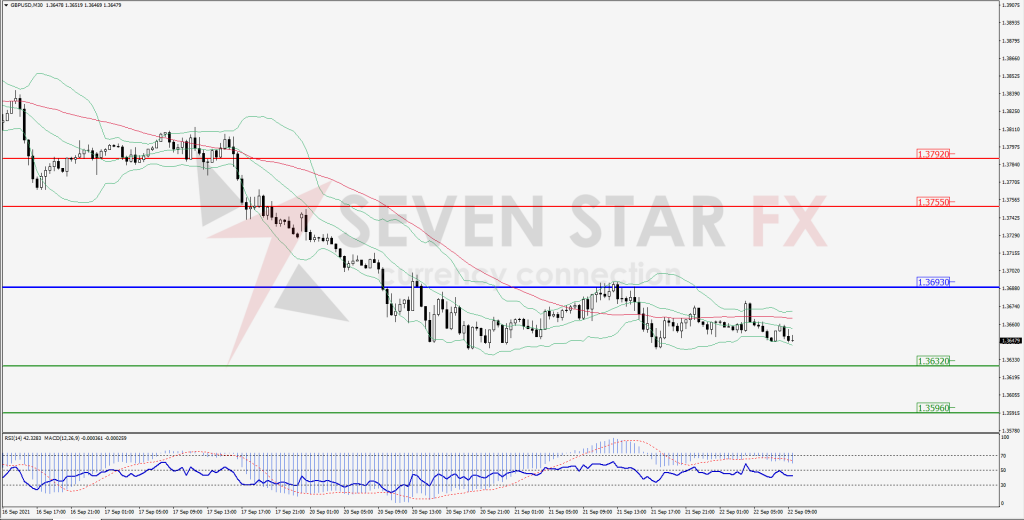
Green Lines Indicate Resistance Levels – Red Lines Indicates Support Levels
Light Blue is a Pivot Point – Black represents the price when the report was produced
USD/JPY Intraday: Support at 109.460
Our pivot point is at 109.460
Preferable Price Action: Buy position above pivot with the target at 109.710 and 109.840 in extension.
Alternative Price Action: The downside breakout of the pivot would call for 109.220 and 109.110.
Comment: Price above its 55MA & 20MA and MACD in positive territory.
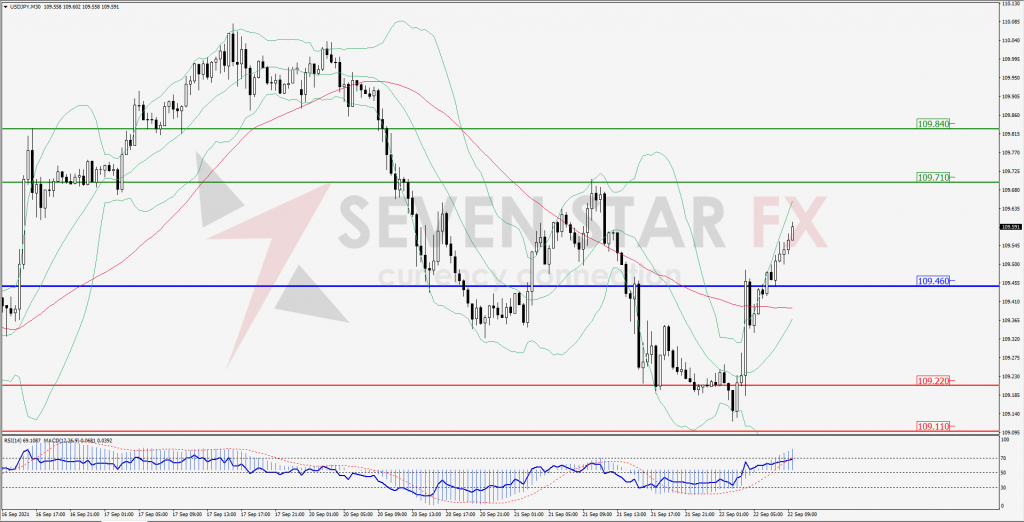
Green Lines Indicate Resistance Levels – Red Lines Indicates Support Levels
Light Blue is a Pivot Point – Black represents the price when the report was produced
AUD/USD Intraday: Support at 0.72360
Our pivot point is at 0.72360
Preferable Price Action: Buy Positions above pivot with targets at 0.72770 & 0.72990 in extension.
Alternative Price Action: Below pivot looks for a further downside with 0.71970 & 0.71750 as targets.
Comment: Pair above its 55MA & 20MA and RSI above 50 levels.
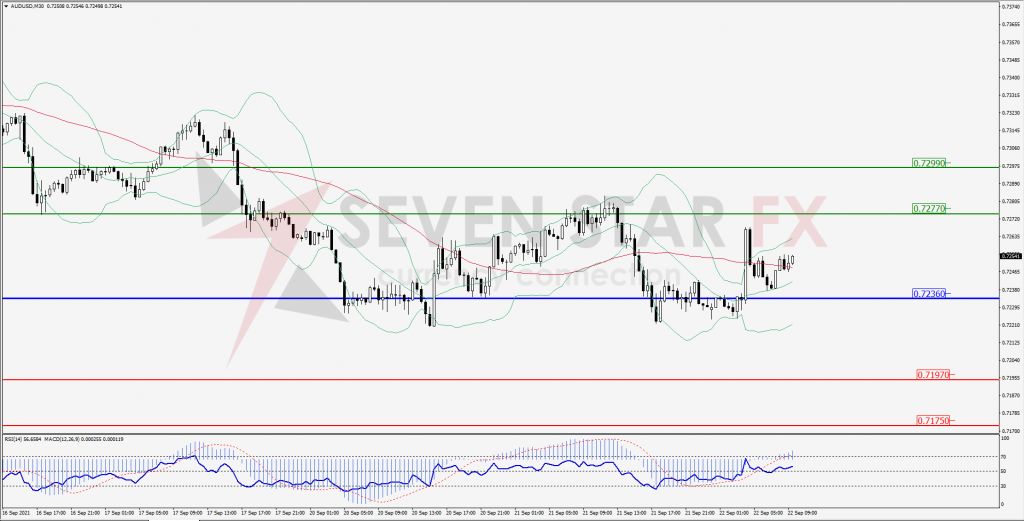
Green Lines Indicate Resistance Levels – Red Lines Indicates Support Levels
Light Blue is a Pivot Point – Black represents the price when the report was produced
CRUDEOIL Intraday: Break resistance level
Our pivot point is at 71.19
Preferable Price Action: Above pivots buy Oil with 72.04 & 72.44 as targets.
Alternative Price Action: Sell crude below pivot with targets at 70.46 and 0.06 in extension.
Comment: Crude is above its 55MA & 20MA and MACD in the positive territory.
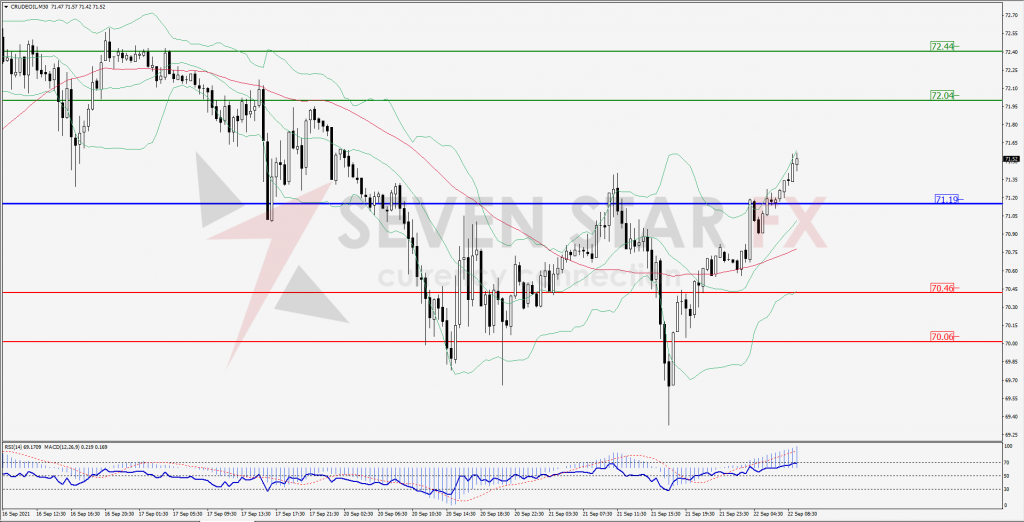
Green Lines Indicate Resistance Levels – Red Lines Indicates Support Levels
Light Blue is a Pivot Point – Black represents the price when the report was produced
XAU/USD Intraday: Support at 1773.90
Our pivot point is 1773.90
Preferable Price Action: Further upside to 1784.00 and 1789.70.
Alternative Price Action: If the price gives an downside breakout of a pivot, then the price extends to 1763.60 and 1757.80.
Comment: MACD in positive territory and price above its 20MA & 55MA.
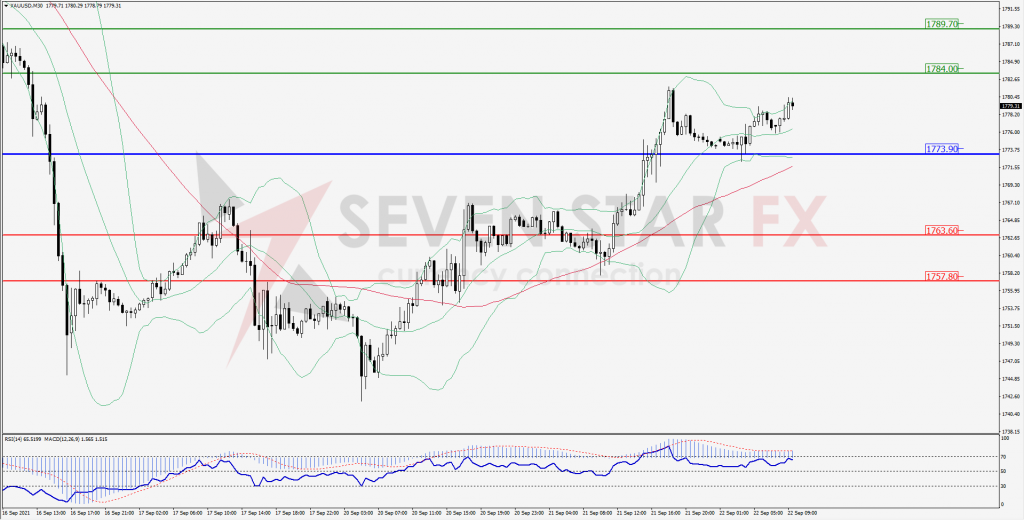
Green Lines Indicate Resistance Levels – Red Lines Indicates Support Levels
Light Blue is a Pivot Point – Black represents the price when the report was produced
Dow Jones Intraday: Break resistance level
Our pivot point is 34,038.00
Preferable Price Action: Take long positions above pivot with targets at 34,382.00 & 34,536.00.
Alternative Price Action: Below 34,038.00 looks for further downside to 33,719.00 & 33,565.00.
Comment: Price above it 55MA & 20MA and RSI above 50 levels.
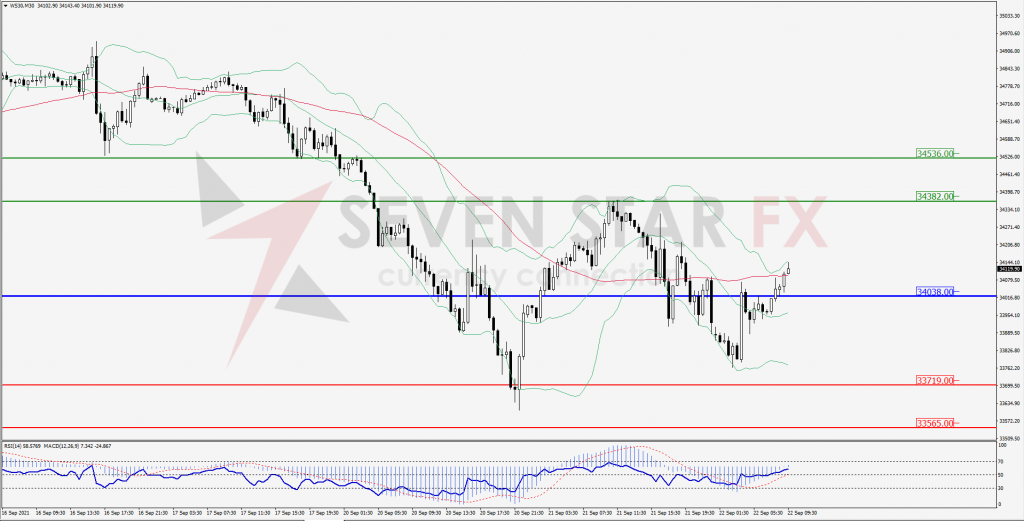
Green Lines Indicate Resistance Levels – Red Lines Indicates Support Levels
Light Blue is a Pivot Point – Black represents the price when the report was produced