Market Wrap: Stocks, Bonds, Commodities
The S&P 500 ended slightly lower on Thursday paring losses in late trading after unexpectedly strong retail sales data underscored the strength of the U.S. economic recovery.
The Dow Jones Industrial Average declined 62.22 points (0.18%) to 34,752.17, the S&P 500 index slipped 6.65 points (0.15%) to 4,474.05 and the Nasdaq Composite added 20.30 points (0.13%) to 15,181.83.
Asian shares steadied in early trading on Friday after losses earlier in the week, but China jitters and global growth concerns weighed on investors’ minds, while the dollar sat near a three-week high.
MSCI’s index of Asia-Pacific stocks outside Japan rose 0.30% to 818.04 levels. Australian index lost 0.76% to 7,403.70. Japanese Nikkei gained 0.58% to 30,500.05.
European stocks were higher on Friday, with the Stoxx Europe 50 Index rose 0.94% to 4,209.05, Germany’s DAX gained 0.77% to 15,773.05, and France’s CAC up 0.91% to 6,683.08, and U.K.’s FTSE 100 advance 0.70% to 7,076.35.
Benchmark 10-year U.S. Treasury rose as demand for safe assets grows again, today 10-year bond yields rose 0.39% to 1.336.
Oil prices fell on Friday as more supply came back online in the U.S. Gulf of Mexico following two hurricanes, but both benchmark contracts are on track to post weekly gains of around 4% as the recovery in output is seen lagging demand.
Spot Brent crude oil fell 0.40% to $75.37 per barrel. US West Texas Intermediate crude lost 0.45% to $72.23 a barrel.
The yellow metal traded higher 0.38% to 1763.35 dollars per ounce.
Market Wrap: Forex
The dollar held near three-week highs against a basket of major currencies on Friday after a raft of strong U.S. economic data rekindled expectations of an earlier policy tightening by the U.S. Federal Reserve.
Today, the U.S. dollar index measures the greenback against a trade-weighted basket of six major currencies, which lost 0.15% to 92.775.
The Euro US Dollar (EUR/USD) is a widely traded pair that rose 0.12% today. This left the pairing trading around $1.17770.
The Japanese yen fell against the U.S. dollar on Friday as the stock pushes higher. Today US/JPY up 0.15%to 109.850 level.
Another commodity-related currency higher against the U.S dollar, AUD/USD rose 0.33% to 0.73130, and NZD/USD gained 0.23% to 0.70770 level.
EUR/USD Intraday: Price may reverse to the upside
Our pivot point is at 1.17580
Preferable Price Action: Take long positions above pivot level with targets at 1.17940 & 1.18120 in extension.
Alternative Price Action: Below pivot looks for a further downside to 1.17270 & 1.17100.
Comment: Pair above its 55MA & 20MA and RSI above 50 levels.
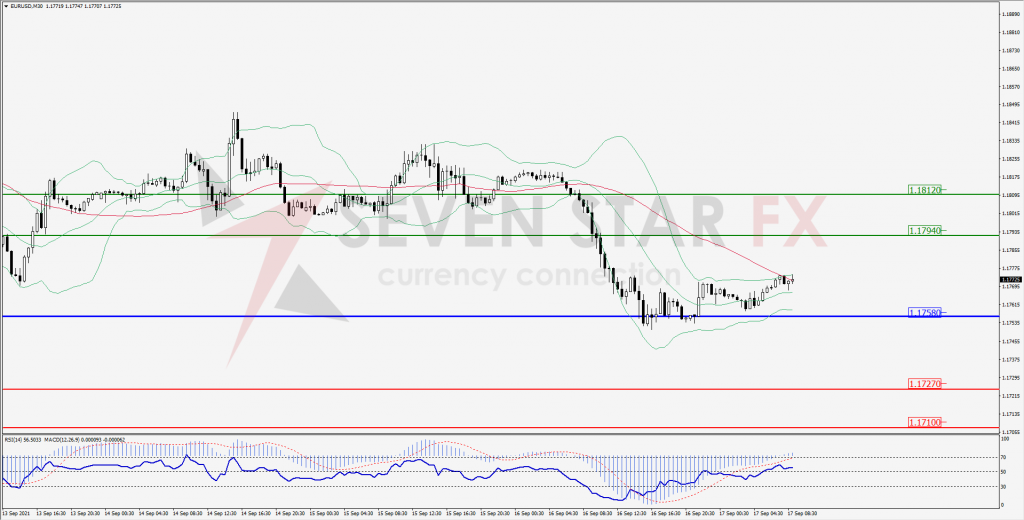
Green Lines Indicate Resistance Levels – Red Lines Indicates Support Levels
Light Blue is a Pivot Point – Black represents the price when the report was produced
GBP/USD Intraday: Support at 1.37850
Our pivot point is at 1.37850
Preferable Price Action: Buy positions above pivot with targets at 1.38400 & 1.38690 in extension.
Alternative Price Action: The price below pivot would call for further downside to 1.37320 & 1.37060.
Comment: Pair above its 55MA & 20MA and RSI above 50 levels.
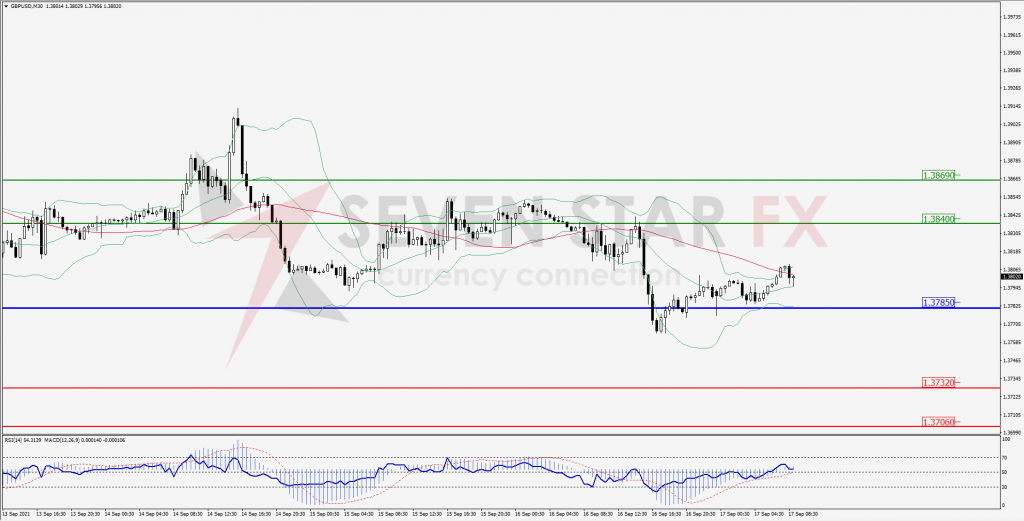
Green Lines Indicate Resistance Levels – Red Lines Indicates Support Levels
Light Blue is a Pivot Point – Black represents the price when the report was produced
USD/JPY Intraday: Trend on the upside
Our pivot point is at 109.690
Preferable Price Action: Buy position above pivot with the target at 110.080 and 110.290 in extension.
Alternative Price Action: The downside breakout of the pivot would call for 109.310 and 109.100.
Comment: Price above its 55MA & 20MA and MACD in positive territory.
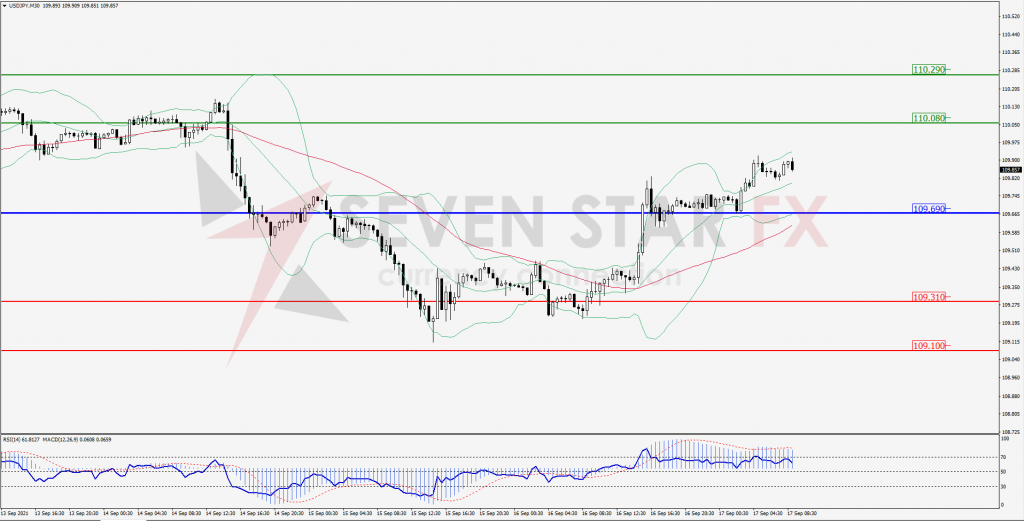
Green Lines Indicate Resistance Levels – Red Lines Indicates Support Levels
Light Blue is a Pivot Point – Black represents the price when the report was produced
AUD/USD Intraday: Support at 0.72950
Our pivot point is at 0.72950
Preferable Price Action: Buy Positions above pivot with targets at 0.73350 & 0.73550 in extension.
Alternative Price Action: Below pivot looks for a further downside with 0.72580 & 0.72380 as targets.
Comment: Pair above its 55MA & 20MA and RSI above 50 levels.
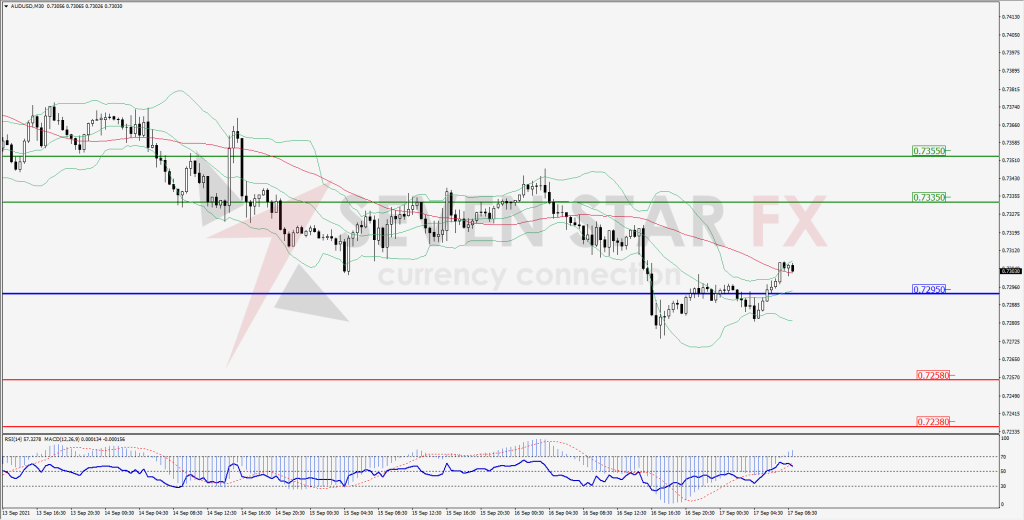
Green Lines Indicate Resistance Levels – Red Lines Indicates Support Levels
Light Blue is a Pivot Point – Black represents the price when the report was produced
CRUDEOIL Intraday: Trend on the upside
Our pivot point is at 71.73
Preferable Price Action: Above pivots buy Oil with 73.44 & 74.39 as targets.
Alternative Price Action: Sell crude below pivot with targets at 70.16 and 69.36 in extension.
Comment: Crude is above its 55MA & 20MA and MACD in the positive territory.
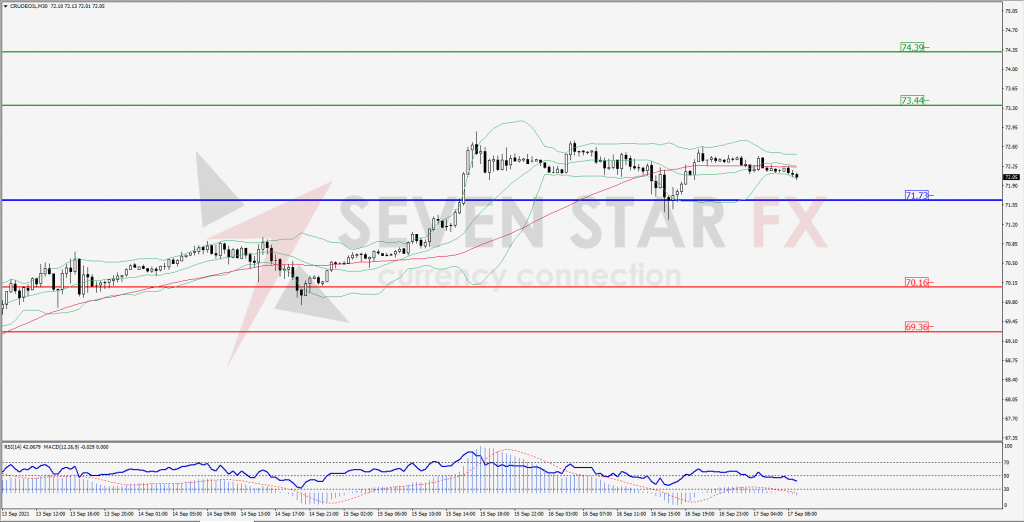
Green Lines Indicate Resistance Levels – Red Lines Indicates Support Levels
Light Blue is a Pivot Point – Black represents the price when the report was produced
XAU/USD Intraday: Trend on the downside
Our pivot point is 1773.60
Preferable Price Action: Further downside to 1751.80 and 1742.30.
Alternative Price Action: If the price gives an upside breakout of a pivot, then the price extends to 1795.00 and 1804.30.
Comment: MACD in negative territory and price below its 55MA.
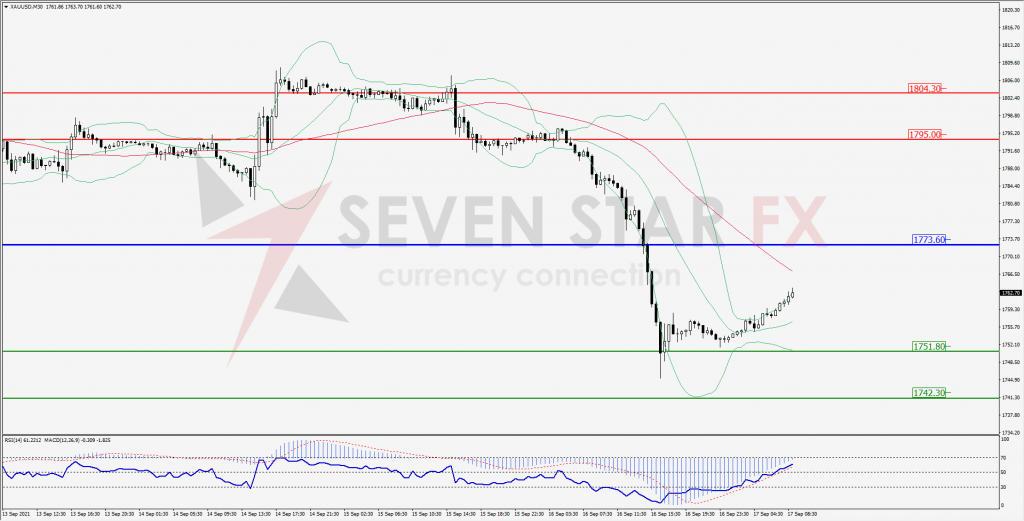
Green Lines Indicate Resistance Levels – Red Lines Indicates Support Levels
Light Blue is a Pivot Point – Black represents the price when the report was produced
Dow Jones Intraday: In a consolidation zone
Our pivot point is 34,710.00
Preferable Price Action: Take long positions above pivot with targets at 34,985.00 & 35,125.00.
Alternative Price Action: below 34,719.00 looks for further downside to 34,444.00 & 34,302.00.
Comment: Price above it 55MA & 20MA and RSI above 50 levels.
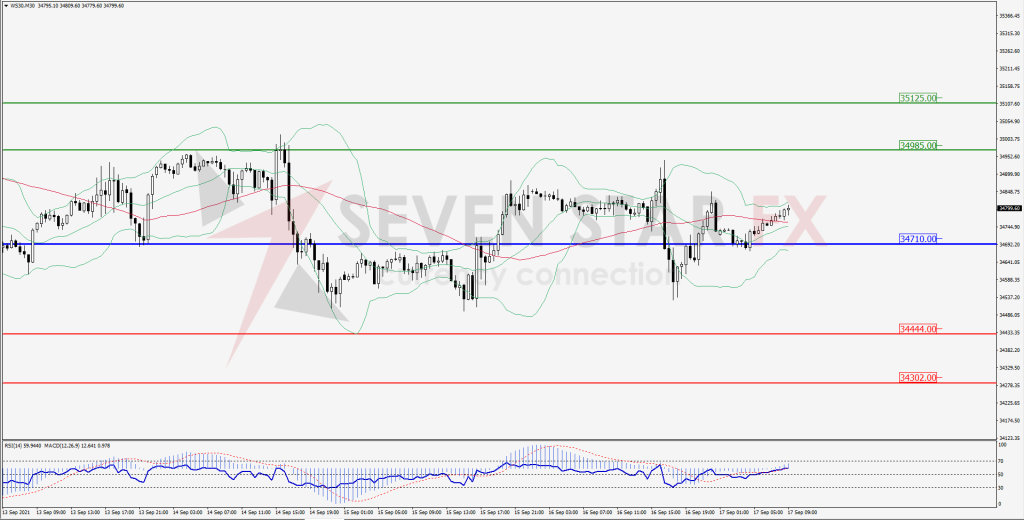
Green Lines Indicate Resistance Levels – Red Lines Indicates Support Levels
Light Blue is a Pivot Point – Black represents the price when the report was produced