Market Wrap: Stocks, Bonds, Commodities
The S&P 500 and Dow Jones indexes rose on Wednesday on mildly positive factory data and higher oil prices, although concerns over a slowing economic recovery and higher corporate taxes kept sentiment subdued.
The Dow Jones Industrial Average rose 92.87 points (0.27%) to 34,670.44, the S&P 500 gained 11.10 points (0.25%) to 4,454.15 and the Nasdaq Composite lost 9.66 points (0.06%) to 15,028.10.
Asian shares gave up early gains to fall again on Thursday, weighed by declines in China and Hong Kong, even after a strong lead-in from Wall Street which had also pushed the dollar to the lower end of its recent range.
MSCI’s index of Asia-Pacific stocks outside Japan plunged 1.17% to 813.93 levels. Australian index gained 0.58% to 7,460.20. Japanese Nikkei lost 0.62% to 30,323.34.
European stocks were higher on Thursday, with the Stoxx Europe 50 Index rose 0.66% to 4,173.25, Germany’s DAX gained 0.53% to 15,698.50, and France’s CAC up 0.69% to 6,628.63, and U.K.’s FTSE 100 advance 0.41% to 7,044.85.
Benchmark 10-year U.S. Treasury rose as demand for safe assets grows again, today 10-year bond yields rose 0.51% to 1.311.
Oil prices slipped on Thursday but kept most of the previous day’s gains after a larger-than-expected drawdown in crude oil stocks in the United States, the world’s largest oil consumer.
Spot Brent crude oil fell 0.05% to $75.42 per barrel. US West Texas Intermediate crude lost 0.07% to $72.56 a barrel.
The yellow metal traded lower 0.59% to 1784.20 dollars per ounce.
Market Wrap: Forex
The dollar slumped against major currencies on Wednesday after softer-than-expected U.S. inflation data released on Tuesday eased short-term expectations about tapering of asset purchases from the Federal Reserve.
Today, the U.S. dollar index measures the greenback against a trade-weighted basket of six major currencies, which gained 0.12% to 92.642.
The Euro US Dollar (EUR/USD) is a widely traded pair that fell 0.20% today. This left the pairing trading around $1.17090.
The Japanese yen gained against the U.S. dollar on Wednesday as the stock pushes higher. Today US/JPY flat to 109.330 level.
Another commodity-related currency mixed against the U.S dollar, AUD/USD fell 0.18% to 0.73200, and NZD/USD rose 0.15% to 0.71130 level.
EUR/USD Intraday: Break support level
Our pivot point is at 1.18080
Preferable Price Action: Take short positions below pivot level with targets at 1.17800 & 1.17660 in extension.
Alternative Price Action: Above pivot looks for a further upside to 1.18360 & 1.18500.
Comment: Pair below its 55MA and RSI below 50 levels.
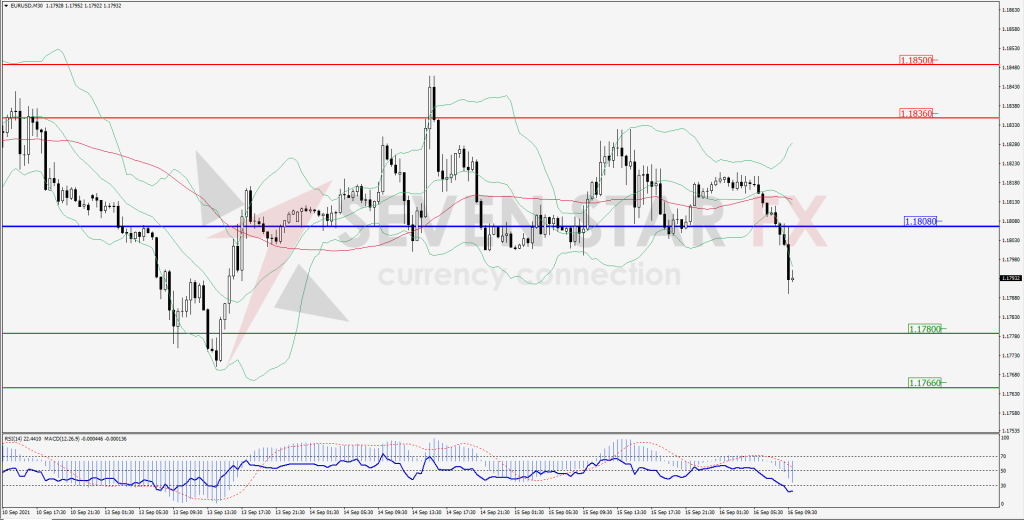
Green Lines Indicate Resistance Levels – Red Lines Indicates Support Levels
Light Blue is a Pivot Point – Black represents the price when the report was produced
GBP/USD Intraday: Resistance at 1.38470
Our pivot point is at 1.38470
Preferable Price Action: Sell positions below pivot with targets at 1.37930 & 1.37660 in extension.
Alternative Price Action: The price above pivot would call for further upside to 1.39000 & 1.39270.
Comment: Pair below its 55MA & 20MA and RSI below 50 levels.
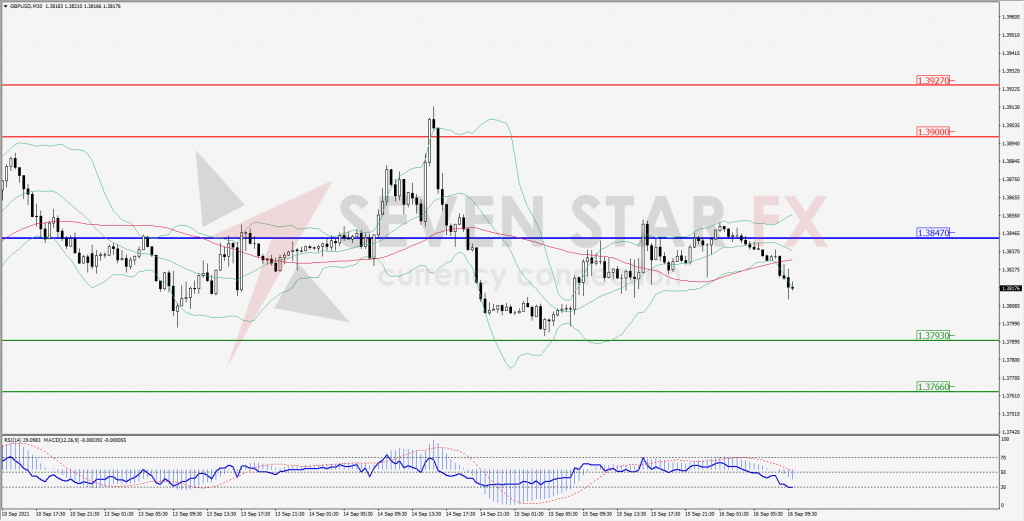
Green Lines Indicate Resistance Levels – Red Lines Indicates Support Levels
Light Blue is a Pivot Point – Black represents the price when the report was produced
USD/JPY Intraday: Trend on the downside
Our pivot point is at 109.520
Preferable Price Action: Sell position below pivot with the target at 109.130 and 109.920 in extension.
Alternative Price Action: The upside breakout of the pivot would call for 110.910 and 110.130.
Comment: Price below its 55MA and MACD in negative territory.
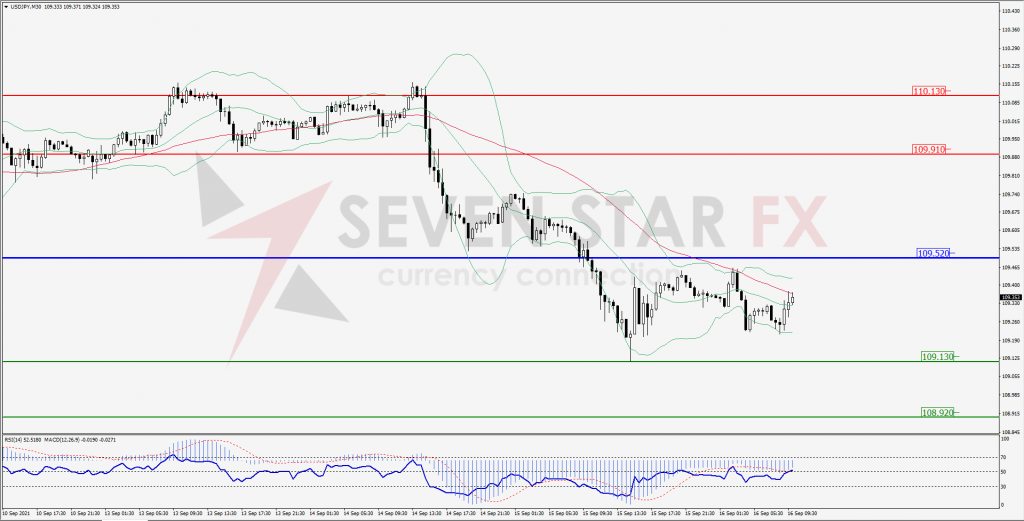
Green Lines Indicate Resistance Levels – Red Lines Indicates Support Levels
Light Blue is a Pivot Point – Black represents the price when the report was produced
AUD/USD Intraday: Resistance at 0.73410
Our pivot point is at 0.73410
Preferable Price Action: Sell Positions below pivot with targets at 0.72990 & 0.72750 in extension.
Alternative Price Action: Above pivot looks for a further upside with 0.73820 & 0.74060 as targets.
Comment: Pair below its 55MA & 20MA and RSI below 50 levels.
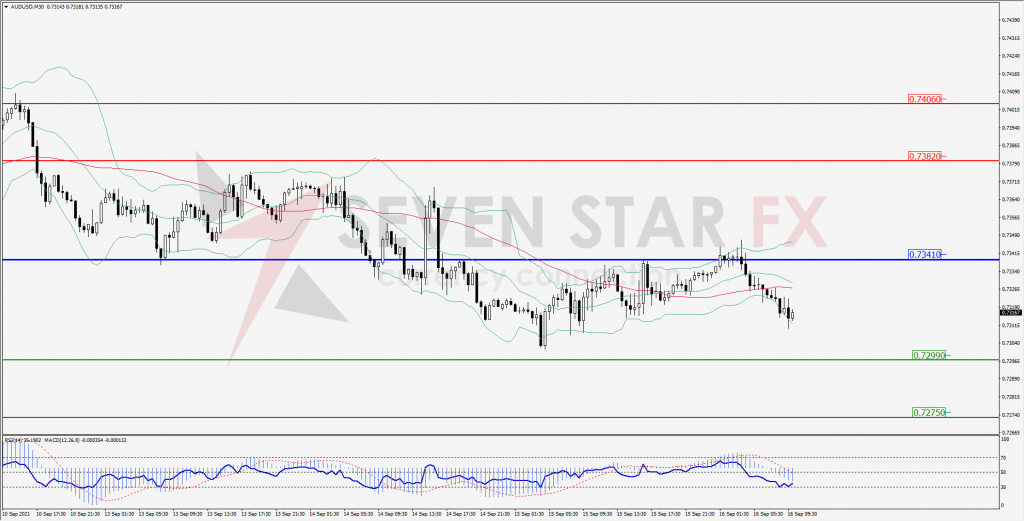
Green Lines Indicate Resistance Levels – Red Lines Indicates Support Levels
Light Blue is a Pivot Point – Black represents the price when the report was produced
CRUDEOIL Intraday: Strong Trend on the upside
Our pivot point is at 71.46
Preferable Price Action: Above pivots buy Oil with 73.45 & 74.41 as targets.
Alternative Price Action: Sell crude below pivot with targets at 69.52 and 68.62 in extension.
Comment: Crude is above its 55MA & 20MA and MACD in the positive territory.
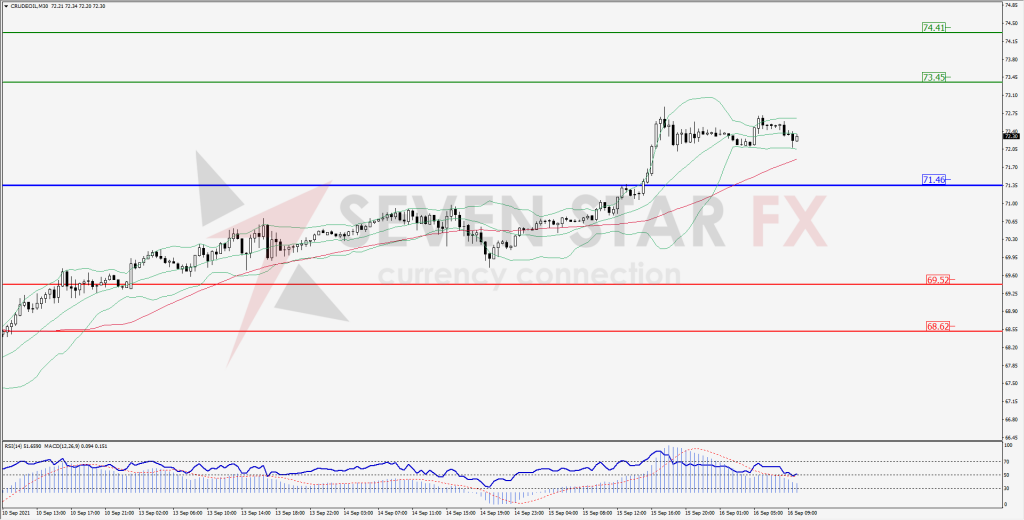
Green Lines Indicate Resistance Levels – Red Lines Indicates Support Levels
Light Blue is a Pivot Point – Black represents the price when the report was produced
XAU/USD Intraday: Resistance level at 1791.20
Our pivot point is 1791.20
Preferable Price Action: Further downside to 1779.80 and 1773.70.
Alternative Price Action: If the price gives a upside breakout of a pivot, then the price extends to 1803.20 and 1808.90.
Comment: MACD in negative territory and price below its 55MA.
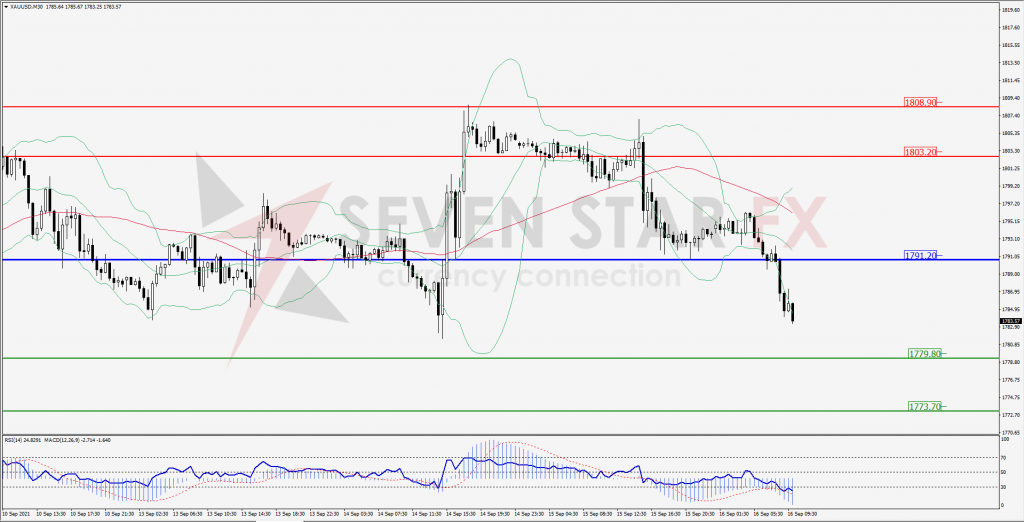
Green Lines Indicate Resistance Levels – Red Lines Indicates Support Levels
Light Blue is a Pivot Point – Black represents the price when the report was produced
Dow Jones Intraday: In a consolidation zone
Our pivot point is 34,719.00
Preferable Price Action: Take long positions above pivot with targets at 34,992.00 & 35,117.00.
Alternative Price Action: below 34,719.00 looks for further downside to 34,477.00 & 34,360.00.
Comment: Price above it 55MA & 20MA and RSI above 50 levels.
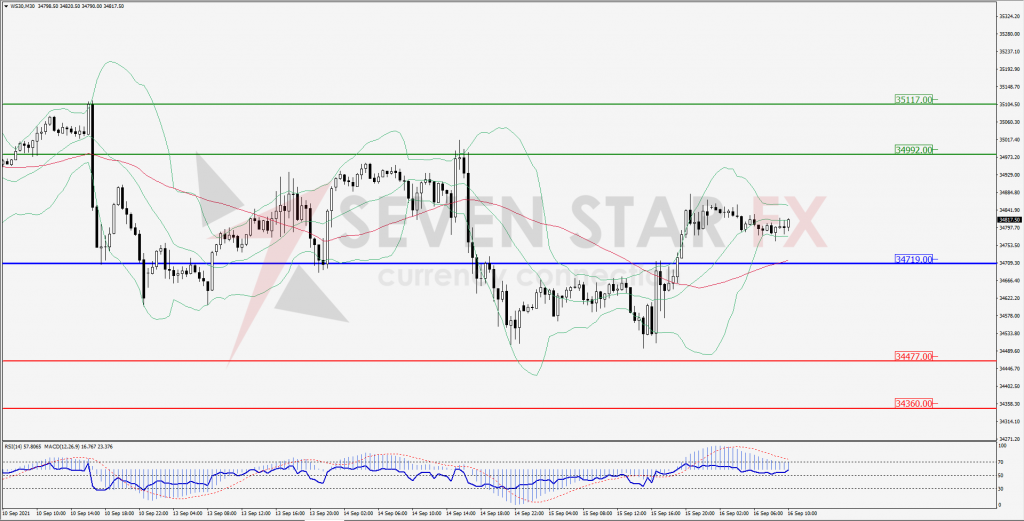
Green Lines Indicate Resistance Levels – Red Lines Indicates Support Levels
Light Blue is a Pivot Point – Black represents the price when the report was produced