Market Wrap: Stocks, Bonds, Commodities
Wall Street ended lower on Wednesday, spooked by worries that the Delta coronavirus variant could blunt the economy’s recovery and on uncertainty about when the US Federal Reserve may pull back its accommodative policies.
The Dow Jones Industrial Average fell 0.20% to end at 35,031.07 points, while the S&P 500 lost 0.13% to 4,514.07. The Nasdaq Composite dropped 0.57% to 15,286.64.
Asian shares dropped Thursday, while the dollar held firm, in line with a cautious global mood as investors worried about the combination of slowing global growth and the potential tapering of central bank stimulus.
MSCI’s index of Asia-Pacific stocks outside Japan lost 1.18% to 835.47 levels. Australian index fell 1.90% to 7,369.50. Japanese Nikkei slipped 0.57% to 30,008.19.
European stocks were lower on Thursday, with the Stoxx Europe 50 Index fell 0.89% to 4,140.35, Germany’s DAX lost 0.88% to 15,472.15, and France’s CAC down 0.83% to 6,614.54, and U.K.’s FTSE 100 slipped 1.15% to 7,014.25.
Benchmark 10-year U.S. Treasury rose as demand for safe assets grows again, today 10-year bond yields down 0.56% to 1.332.
Oil prices jumped on Wednesday and settled up more than 1% as U.S. Gulf of Mexico producers made slow progress in restoring output after Hurricane Ida.
Spot Brent crude oil advance 0.10% to $72.64 per barrel. US West Texas Intermediate crude lost 0.10% to $69.23 a barrel.
The yellow metal traded lower 0.11% to 1791.55 dollars per ounce.
Market Wrap: Forex
The dollar was supported on Thursday as doubts over the global economy’s strength subdued risk sentiment, while the euro steadied ahead of a European Central Bank policy meeting later in the day that is expected result in a reduction in stimulus.
Today, the U.S. dollar index measures the greenback against a trade-weighted basket of six major currencies, which rose 0.05% to 92.677.
The Euro US Dollar (EUR/USD) is a widely traded pair rose 0.07% today. This left the pairing trading around $1.18200.
The Japanese yen gained against the U.S. dollar on Thursday as the stock pushes higher. Today US/JPY lost 0.23% to 109.970 level.
Another commodity-related currency higher against the U.S dollar, AUD/USD flat to 0.73630, and NZD/USD gained 0.06% to 0.70960 level.
EUR/USD Intraday: Support at 1.18160
Our pivot point is at 1.18160
Preferable Price Action: Take short positions below pivot level with targets at 1.17670 & 1.17370 in extension.
Alternative Price Action: Above pivot looks for a further upside to 1.18640 & 1.18950.
Comment: Pair above its 20MA and RSI at 50 levels.
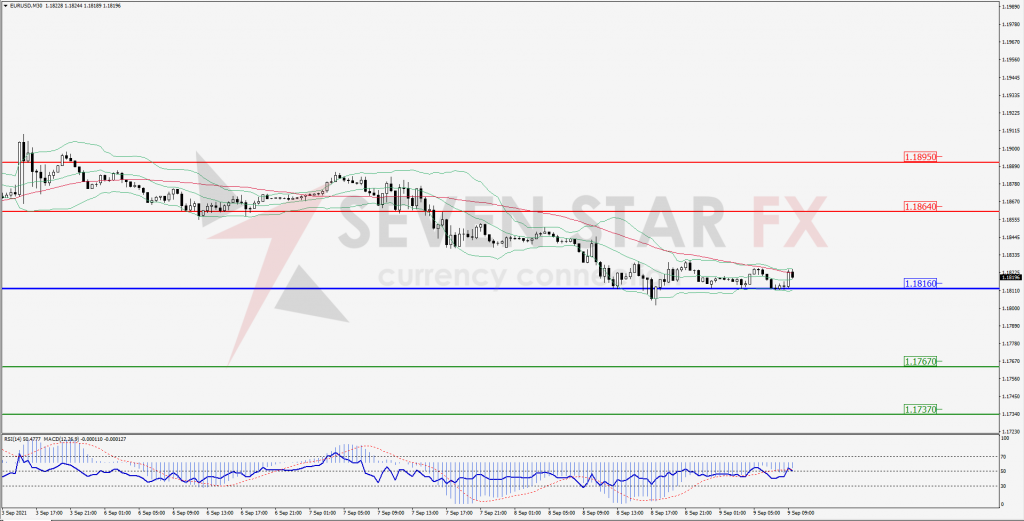
Green Lines Indicate Resistance Levels – Red Lines Indicates Support Levels
Light Blue is a Pivot Point – Black represents the price when the report was produced
GBP/USD Intraday: Trend may reverse to upside
Our pivot point is at 1.37550
Preferable Price Action: Buy positions above pivot with targets at 1.38090 & 1.38410 in extension.
Alternative Price Action: The price below pivot would call for further downside to 1.37050 & 1.36730.
Comment: Pair below its 55MA & 20MA and RSI below 50 levels.
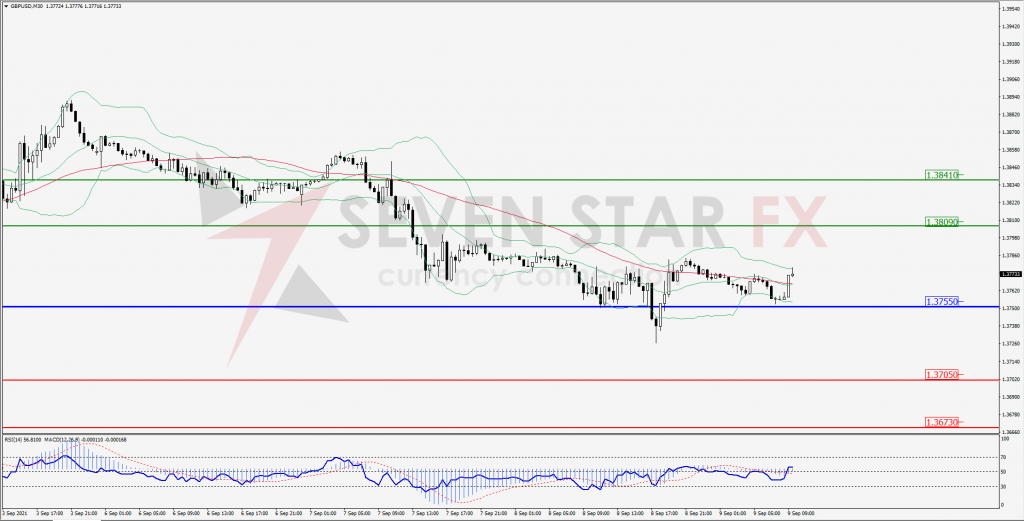
Green Lines Indicate Resistance Levels – Red Lines Indicates Support Levels
Light Blue is a Pivot Point – Black represents the price when the report was produced
USD/JPY Intraday: Resistance at 110.270 level
Our pivot point is at 110.270
Preferable Price Action: Sell position below pivot with the target at 109.950 and 109.740 in extension.
Alternative Price Action: The upside breakout of the pivot would call for 110.580 and 110.780.
Comment: Price below its 20MA & 55MA and MACD in negative territory.
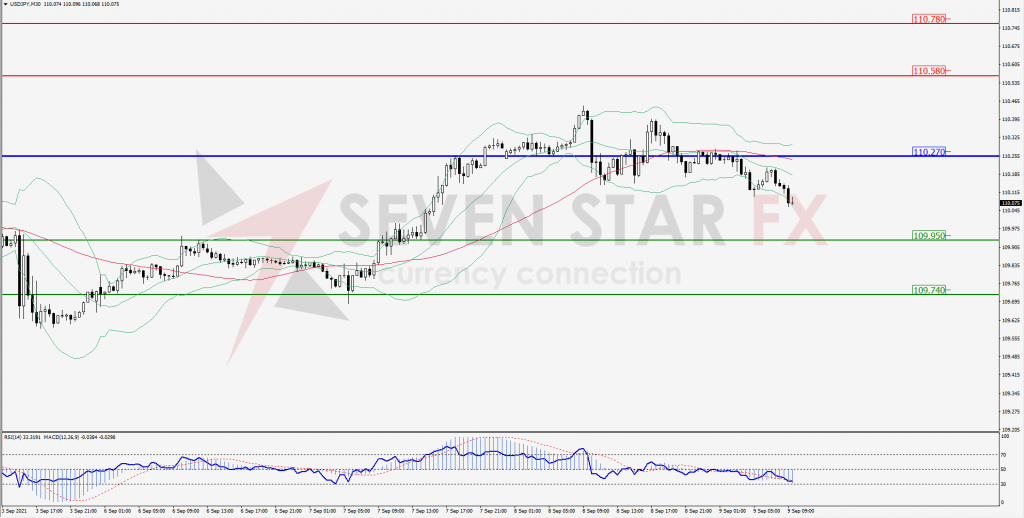
Green Lines Indicate Resistance Levels – Red Lines Indicates Support Levels
Light Blue is a Pivot Point – Black represents the price when the report was produced
AUD/USD Intraday: Trend on the downside
Our pivot point is at 0.73960
Preferable Price Action: Sell Positions below pivot with targets at 0.73340 & 0.73000 in extension.
Alternative Price Action: Above pivot looks for a further upside with 0.74570 & 0.74910 as targets.
Comment: Pair below its 55MA and RSI below 50 levels.
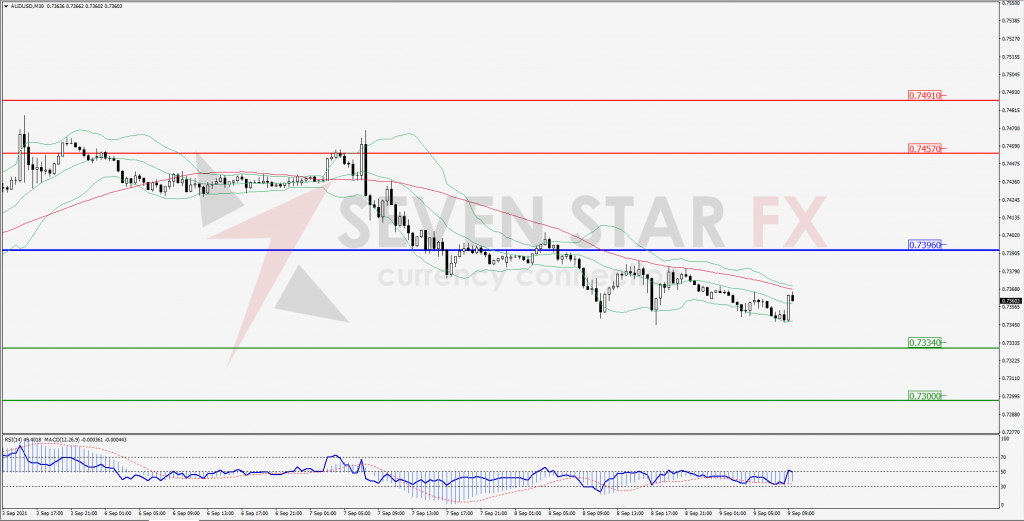
Green Lines Indicate Resistance Levels – Red Lines Indicates Support Levels
Light Blue is a Pivot Point – Black represents the price when the report was produced
CRUDEOIL Intraday: In a consolidation zone
Our pivot point is at 68.74
Preferable Price Action: Above pivots buy Oil with 69.96 & 70.65 as targets.
Alternative Price Action: Sell crude below pivot with targets at 67.56 and 66.90 in extension.
Comment: Crude is above its 55MA & 20MA and MACD in the positive territory.
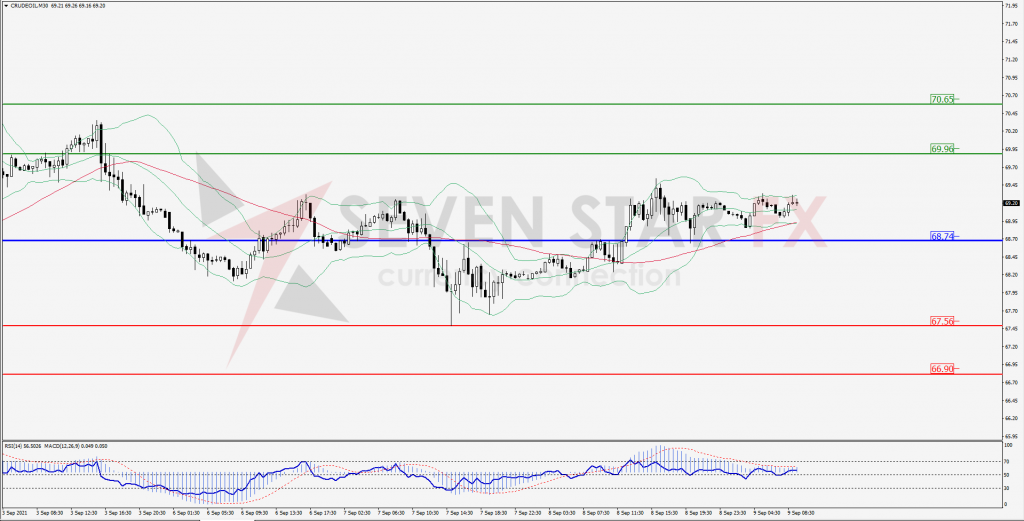
Green Lines Indicate Resistance Levels – Red Lines Indicates Support Levels
Light Blue is a Pivot Point – Black represents the price when the report was produced
XAU/USD Intraday: Strong trend on the downside
Our pivot point is 1805.30
Preferable Price Action: Further downside to 1792.20 and 1785.60.
Alternative Price Action: If the price gives a upside breakout of a pivot, then the price extends to 1819.70 and 1826.70.
Comment: MACD in negative territory and price below its 20MA & 55MA.
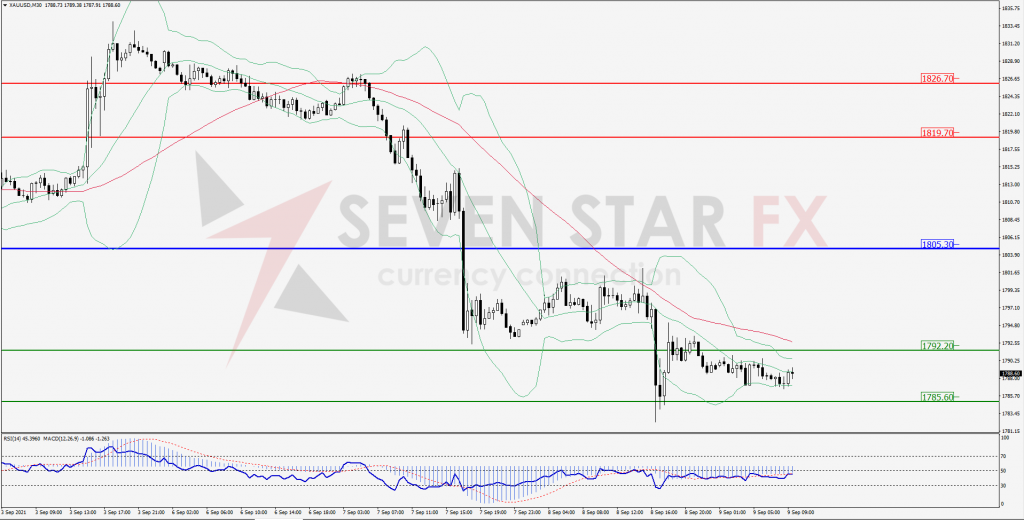
Green Lines Indicate Resistance Levels – Red Lines Indicates Support Levels
Light Blue is a Pivot Point – Black represents the price when the report was produced
Dow Jones Intraday: Resistance at 35,038.00
Our pivot point is 35,038.00
Preferable Price Action: Take short positions below pivot with targets at 34,802.00 & 34,671.00.
Alternative Price Action: above 35,038.00 looks for further upside to 35,264.00 & 35,403.00.
Comment: Price below it 20MA & 55MA and RSI below 50 levels.
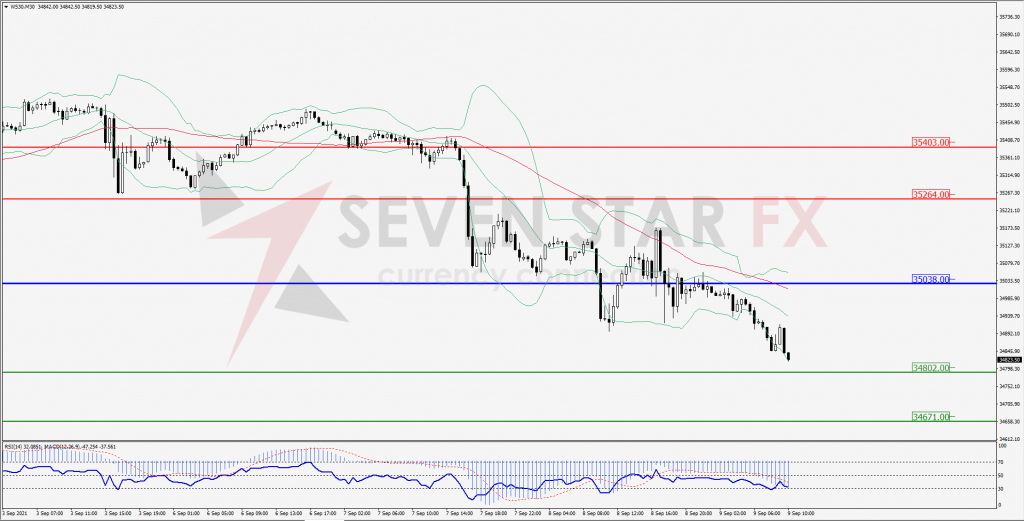
Green Lines Indicate Resistance Levels – Red Lines Indicates Support Levels
Light Blue is a Pivot Point – Black represents the price when the report was produced