Market Wrap: Stocks, Bonds, Commodities
American stock market closed on Monday because of labor day in the USA.
Global stocks inched higher on Tuesday to a record high for the eighth straight sessions as investors wagered the U.S. Federal Reserve is likely to delay the start of tapering its asset purchases after the soft U.S. jobs data.
MSCI’s index of Asia-Pacific stocks outside Japan rose 0.10% to 850.68 levels. Australian index flat to 7,530.30. Japanese Nikkei jumped 0.86% to 29,916.14.
European stocks were higher on Monday, with the Stoxx Europe 50 Index fell 0.10% to 4,228.80, Germany’s DAX rose 0.07% to 15,851.40, and France’s CAC lost 0.25% to 6,746.16, and U.K.’s FTSE 100 up 0.17% to 7,175.18.
Benchmark 10-year U.S. Treasury rose as demand for safe assets grows again, today 10-year bond yields advance 2.07% to 1.349.
Oil prices were wobbly on Tuesday as investors grappled with demand concerns after Saudi Arabia’s sharp cuts to crude contract prices for Asia.
Spot Brent crude oil advance 0.55% to $72.60 per barrel. US West Texas Intermediate crude fell 0.10% to $69.23 a barrel.
The yellow metal traded lower 0.88% to 1817.60 dollars per ounce.
Market Wrap: Forex
The dollar erased all losses sustained after last week’s poor U.S. jobs report and extended broad gains on Monday as concerns about slowing global growth boosted its safe-haven appeal in holiday-calmed trade.
Today, the U.S. dollar index measures the greenback against a trade-weighted basket of six major currencies, which rose 0.26% to 92.273.
The Euro US Dollar (EUR/USD) is a widely traded pair fell 0.05% today. This left the pairing trading around $1.18650.
The Japanese yen fell against the U.S. dollar on Tuesday as the stock pushes higher. Today US/JPY gained 0.10% to 109.930 level.
Another commodity-related currency lower against the U.S dollar, AUD/USD lost 0.36% to 0.74120, and NZD/USD fell 0.34% to 0.71130 level.
EUR/USD Intraday: Resistance at 1.18820
Our pivot point is at 1.18820
Preferable Price Action: Take short positions below pivot level with targets at 1.18530 & 1.18350 in extension.
Alternative Price Action: Above pivot looks for a further upside to 1.19150 & 1.19330.
Comment: Pair below its 55MA & 20MA and RSI below 50 levels.
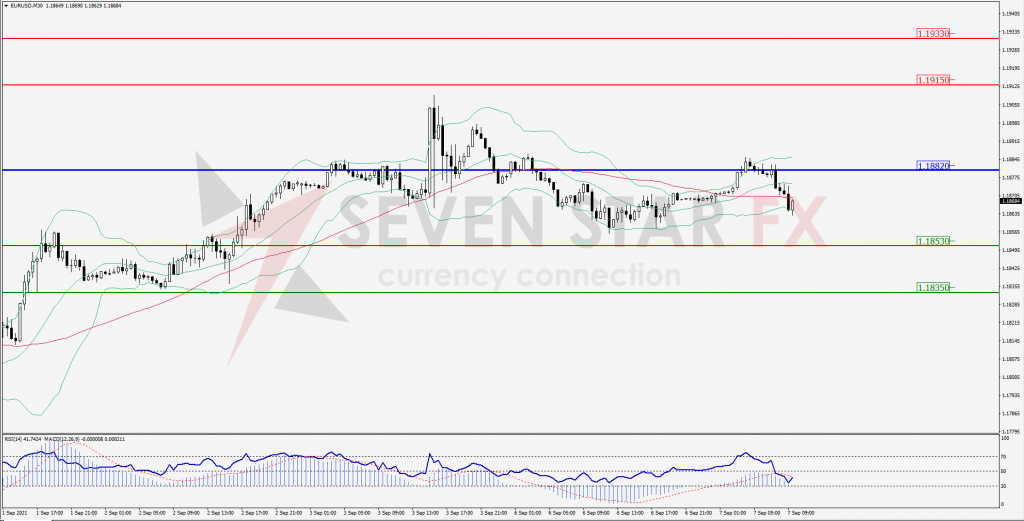
Green Lines Indicate Resistance Levels – Red Lines Indicates Support Levels
Light Blue is a Pivot Point – Black represents the price when the report was produced
GBP/USD Intraday: Trend on the upside
Our pivot point is at 1.38500
Preferable Price Action: Sell positions below pivot with targets at 1.38130 & 1.37950 in extension.
Alternative Price Action: The price above pivot would call for further upside to 1.38820 & 1.39000.
Comment: Pair below its 55MA and RSI below 50 levels.
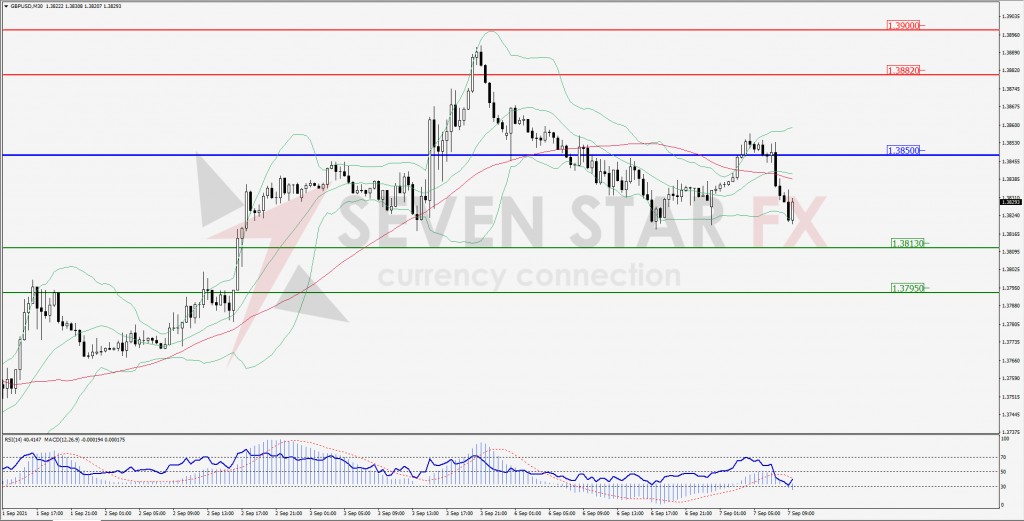
Green Lines Indicate Resistance Levels – Red Lines Indicates Support Levels
Light Blue is a Pivot Point – Black represents the price when the report was produced
USD/JPY Intraday: In a consolidation zone
Our pivot point is at 109.780
Preferable Price Action: Buy position above pivot with the target at 110.080 and 110.270 in extension.
Alternative Price Action: The downside breakout of the pivot would call for 109.480 and 109.300.
Comment: Price above its 55MA & 20MA and MACD in positive territory.
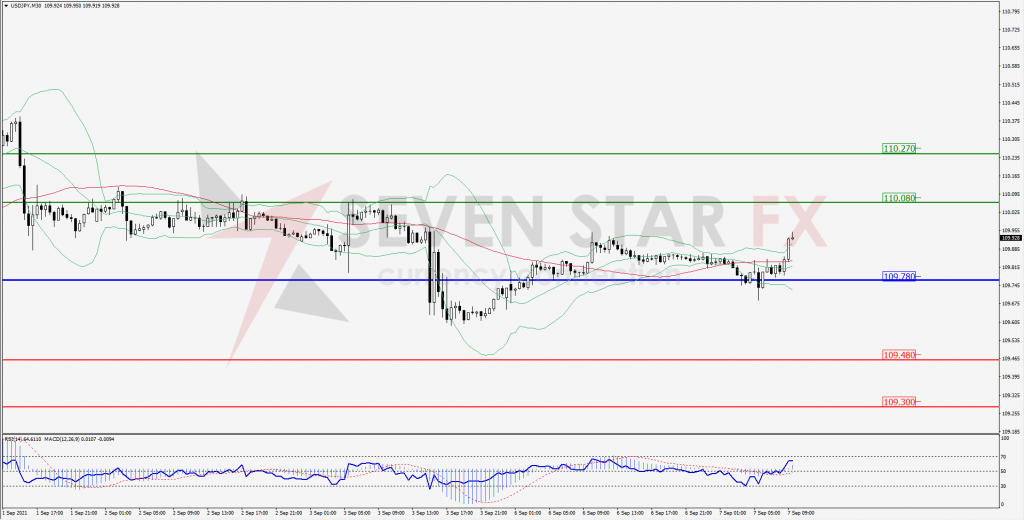
Green Lines Indicate Resistance Levels – Red Lines Indicates Support Levels
Light Blue is a Pivot Point – Black represents the price when the report was produced
AUD/USD Intraday: Break support level
Our pivot point is at 0.74380
Preferable Price Action: Sell Positions below pivot with targets at 0.73980 & 0.73750 in extension.
Alternative Price Action: Above pivot looks for a further upside with 0.74760 & 0.74960 as targets.
Comment: Pair below its 20MA & 55MA and RSI below 50 levels.
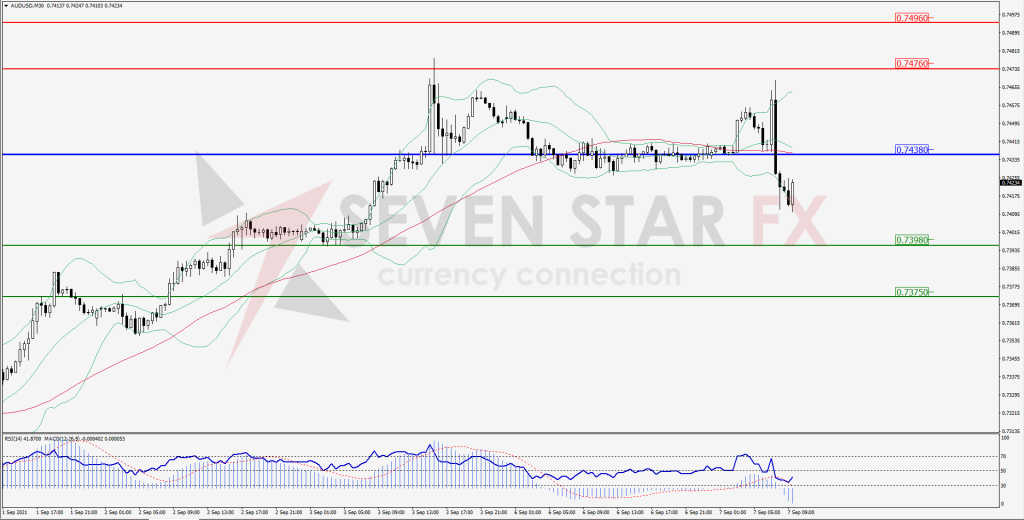
Green Lines Indicate Resistance Levels – Red Lines Indicates Support Levels
Light Blue is a Pivot Point – Black represents the price when the report was produced
CRUDEOIL Intraday: Support at 68.68
Our pivot point is at 68.68
Preferable Price Action: Above pivots buy Oil with 70.05 & 70.80 as targets.
Alternative Price Action: Sell crude below pivot with targets at 67.33 and 66.53 in extension.
Comment: Crude is above its 55MA & 20MA and MACD in the positive territory.
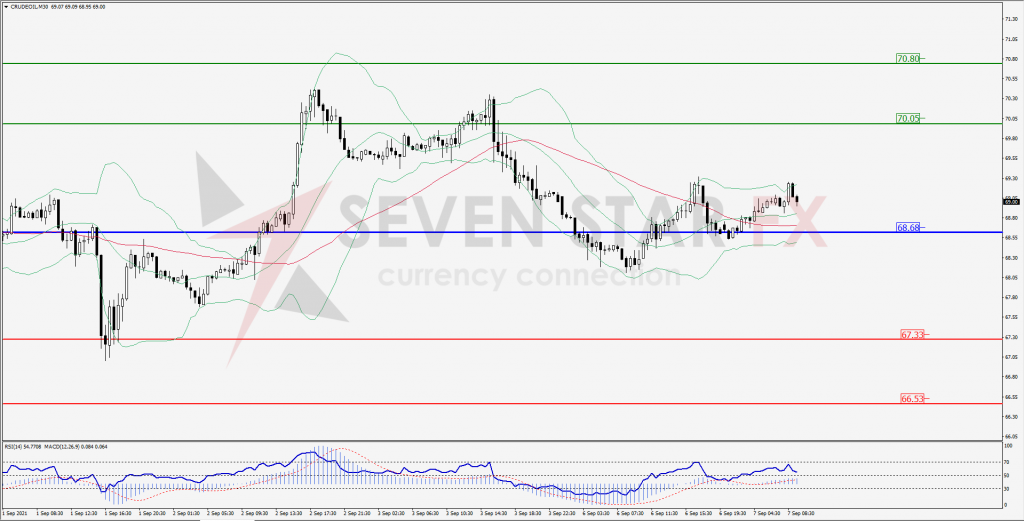
Green Lines Indicate Resistance Levels – Red Lines Indicates Support Levels
Light Blue is a Pivot Point – Black represents the price when the report was produced
XAU/USD Intraday: Resistance at 1821.40
Our pivot point is 1821.40
Preferable Price Action: Further downside to 1813.00 and 1808.40.
Alternative Price Action: If the price gives a upside breakout of a pivot, then the price extends to 1829.20 and 1833.20.
Comment: MACD in negative territory and price below its 55MA & 20MA.
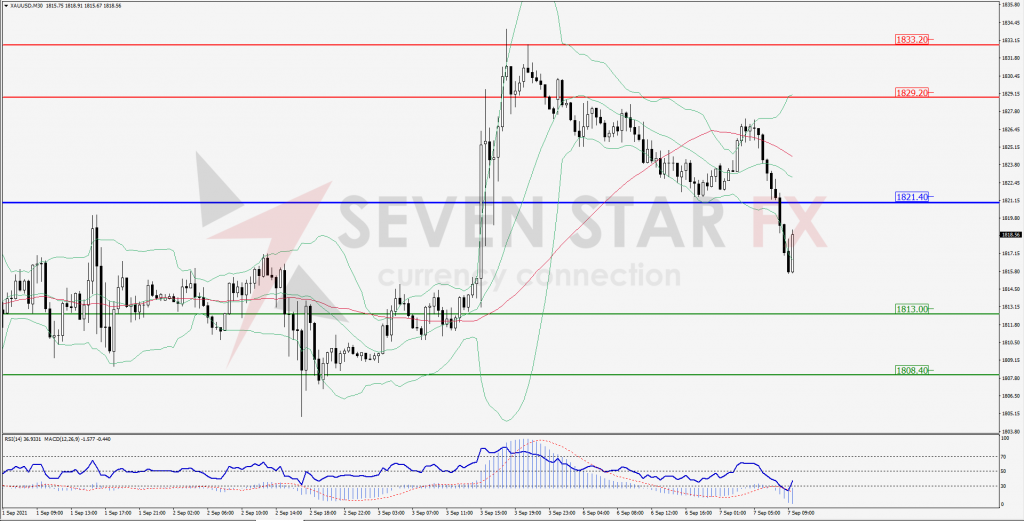
Green Lines Indicate Resistance Levels – Red Lines Indicates Support Levels
Light Blue is a Pivot Point – Black represents the price when the report was produced
Dow Jones Intraday: In a consolidation zone
Our pivot point is 35,434.00
Preferable Price Action: Take short positions below pivot with targets at 35,354.00 & 35,303.00.
Alternative Price Action: above 35,434.00 looks for further upside to 35,510.00 & 35,553.00.
Comment: Price below it 20MA & 55MA and RSI below 50 levels.
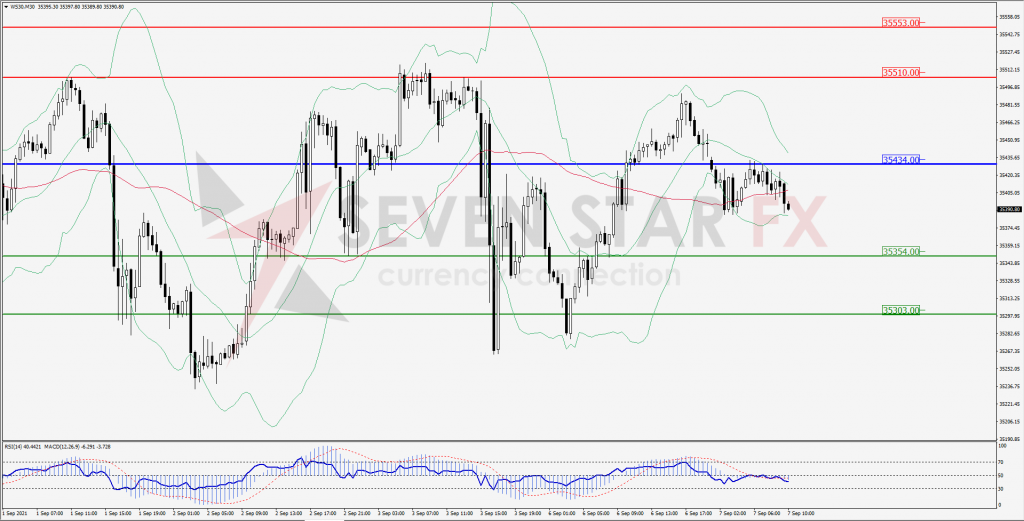
Green Lines Indicate Resistance Levels – Red Lines Indicates Support Levels
Light Blue is a Pivot Point – Black represents the price when the report was produced