Market Wrap: Stocks, Bonds, Commodities
Wall Street’s main indexes hovered near record highs on Tuesday despite weakness in technology stocks, with the S&P 500 heading for a seventh straight month of gains as fears ebbed over near-term policy tightening by the Federal Reserve.
The Dow Jones Industrial Average rose 37.18 points (0.11%) to 35,437.02, the S&P 500 flat to 4,528.54, and the Nasdaq Composite lost 18.41 points (0.12%) to 15,247.48.
Asian shares gave up some of their recent gains in cautious trading on Wednesday while the dollar inched back from three-week lows, as worries about slowing global growth in several markets returned to weigh on traders’ minds.
MSCI’s index of Asia-Pacific stocks outside Japan gained 0.24% to 839.65 levels. Australian index lost 0.10% to 7,527.10. Japanese Nikkei traded 1.29% higher to 28,451.10.
European stocks were higher on Wednesday, with the Stoxx Europe 50 Index advance 1.22% to 4,247.61, Germany’s DAX rose 0.73% to 15,951.35, and France’s CAC gained 1.39% to 6,773.24, and U.K.’s FTSE 100 up 0.95% to 7,187.05.
Benchmark 10-year U.S. Treasury rose as demand for safe assets grows again, today 10-year bond yields gained 1.56% to 1.322.
Oil prices recovered on Wednesday after a U.S. industry report showed crude inventories fell more than expected last week, steadying after overnight losses from the impact of Hurricane Ida on U.S. refineries.
Spot Brent crude oil advance 0.80% to $72.20 per barrel. US West Texas Intermediate crude gained 0.80% to $69.06 a barrel.
The yellow metal traded higher 0.05% to 1819.00 dollars per ounce.
Market Wrap: Forex
The dollar traded near its lowest point in nearly three weeks versus major peers on Wednesday, with investors focused on a key U.S. jobs report due on Friday for clues on when the Federal Reserve might begin paring stimulus.
Today, the U.S. dollar index measures the greenback against a trade-weighted basket of six major currencies, which gained 0.05% to 92.688.
The Euro US Dollar (EUR/USD) is a widely traded pair that advanced rose 0.05% today. This left the pairing trading around $1.18100.
The Japanese yen fell against the U.S. dollar on Wednesday as the stock pushes higher. Today US/JPY gained 0.18% to 110.200 level.
Another commodity-related currency higher against the U.S dollar, AUD/USD rose 0.26% to 0.73340, and NZD/USD gained 0.19% to 0.70570 level.
EUR/USD Intraday: Resistance at 1.18110
Our pivot point is at 1.18110
Preferable Price Action: Take short positions below pivot level with targets at 1.17830 & 1.17690 in extension.
Alternative Price Action: Above pivot looks for a further upside to 1.18370 & 1.18510.
Comment: Pair above its 55MA and RSI above 50 levels.
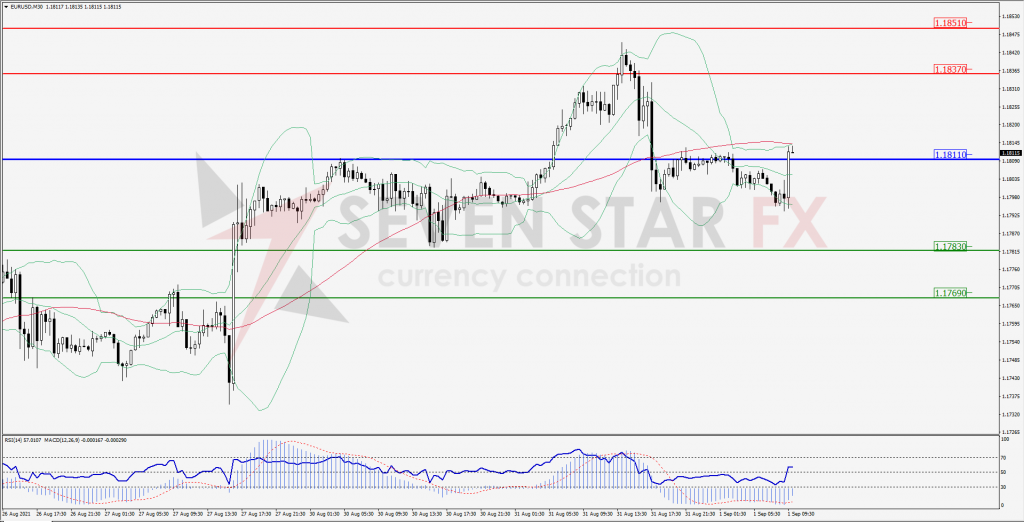
Green Lines Indicate Resistance Levels – Red Lines Indicates Support Levels
Light Blue is a Pivot Point – Black represents the price when the report was produced
GBP/USD Intraday: Support at 1.37310
Our pivot point is at 1.37310
Preferable Price Action: Buy positions above pivot with targets at 1.37770 & 1.38070 in extension.
Alternative Price Action: The price below pivot would call for further downside to 1.36860 & 1.36570.
Comment: Pair above its 55MA and RSI above 50 levels.
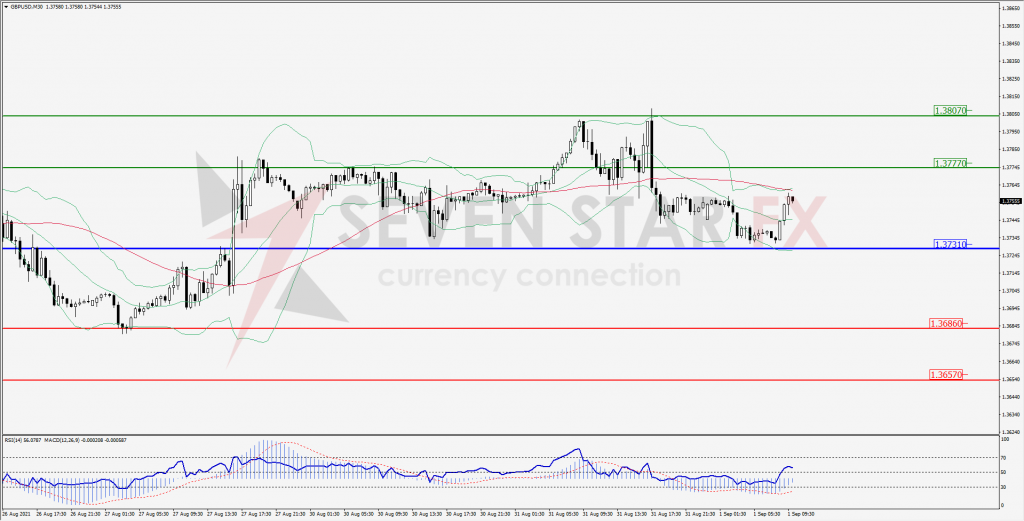
Green Lines Indicate Resistance Levels – Red Lines Indicates Support Levels
Light Blue is a Pivot Point – Black represents the price when the report was produced
USD/JPY Intraday: Break resistance level
Our pivot point is at 110.130
Preferable Price Action: Buy position above pivot with the target at 110.400 and 110.560 in extension.
Alternative Price Action: The downside breakout of the pivot would call for 109.820 and 109.670.
Comment: Price above its 55MA & 20MA and MACD in positive territory.
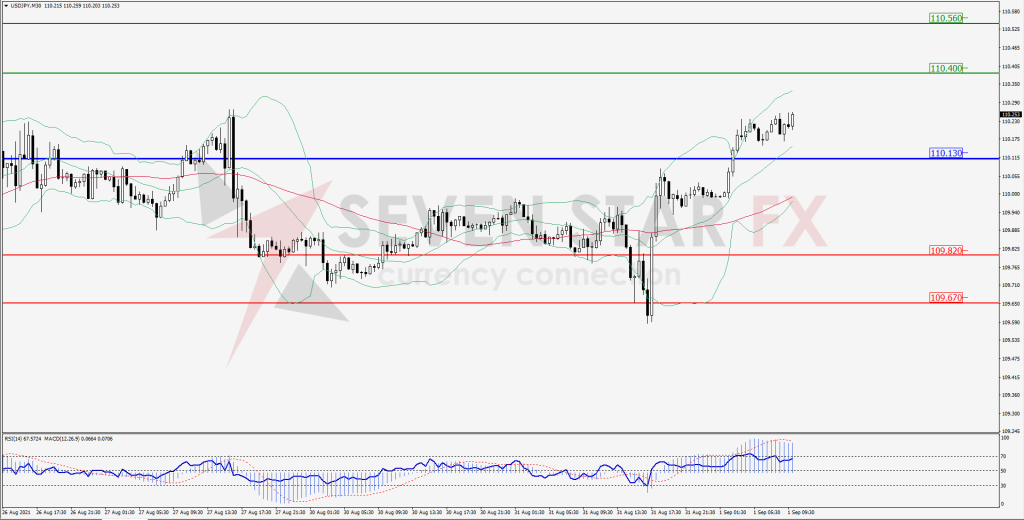
Green Lines Indicate Resistance Levels – Red Lines Indicates Support Levels
Light Blue is a Pivot Point – Black represents the price when the report was produced
AUD/USD Intraday: Trend on the upside
Our pivot point is at 0.73030
Preferable Price Action: Buy Positions above pivot with targets at 0.73560 & 0.73800 in extension.
Alternative Price Action: Below pivot looks for a further downside with 0.72530 & 0.72280 as targets.
Comment: Pair above its 20MA & 55MA and RSI above 50 levels.
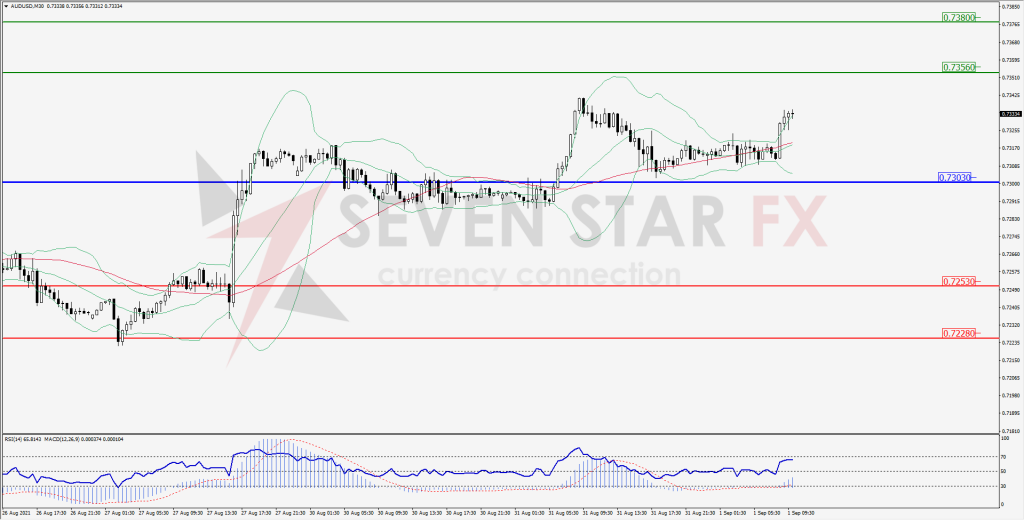
Green Lines Indicate Resistance Levels – Red Lines Indicates Support Levels
Light Blue is a Pivot Point – Black represents the price when the report was produced
CRUDEOIL Intraday: In a consolidation zone
Our pivot point is at 68.21
Preferable Price Action: Above pivots buy Oil with 69.77 & 70.71 as targets.
Alternative Price Action: Sell crude below pivot with targets at 66.69 and 65.74 in extension.
Comment: Crude is above its 55MA & 20MA and MACD in the positive territory.
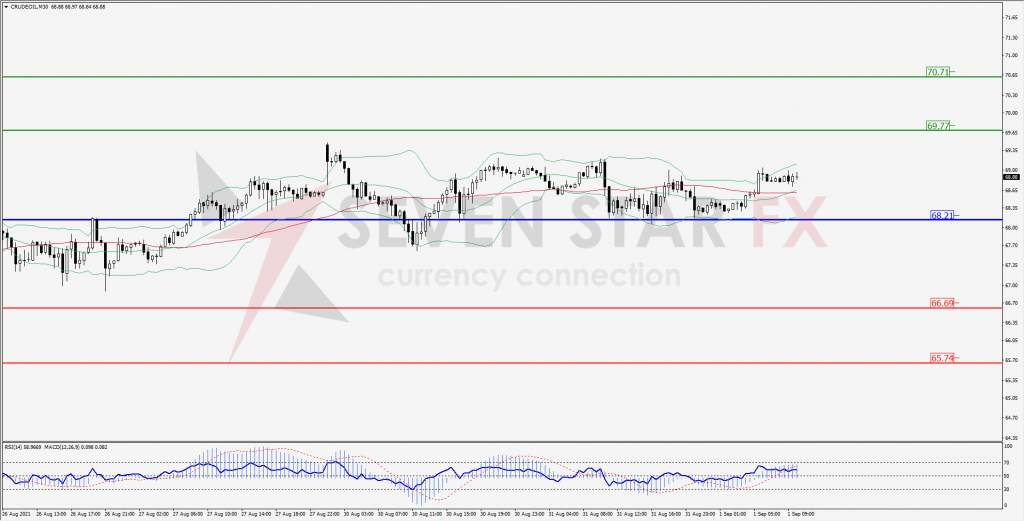
Green Lines Indicate Resistance Levels – Red Lines Indicates Support Levels
Light Blue is a Pivot Point – Black represents the price when the report was produced
XAU/USD Intraday: Support at 1809.10
Our pivot point is 1809.10
Preferable Price Action: Further upside to 1821.80 & 1827.80.
Alternative Price Action: If the price gives a downside breakout of a pivot, then the price extends to 1795.90 and 1789.30.
Comment: MACD in positive territory and price above its 55MA & 20MA.
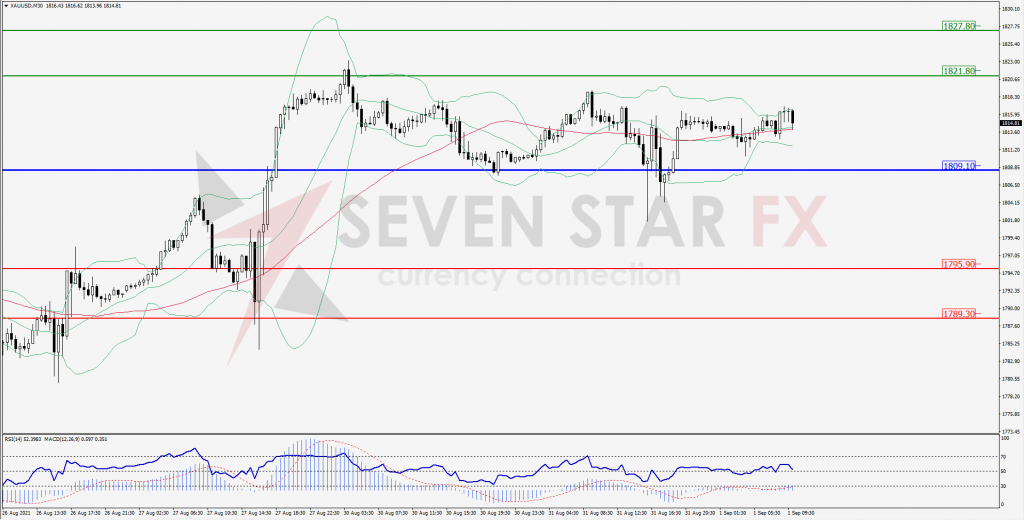
Green Lines Indicate Resistance Levels – Red Lines Indicates Support Levels
Light Blue is a Pivot Point – Black represents the price when the report was produced
Dow Jones Intraday: In a consolidation zone
Our pivot point is 35,395.00
Preferable Price Action: Take long positions above pivot with targets at 35,533.00 & 35,599.00.
Alternative Price Action: below 35,395.00 looks for further downside to 35,253.00 & 35,182.00.
Comment: Price above its 20MA & 55MA and RSI above 50 levels.
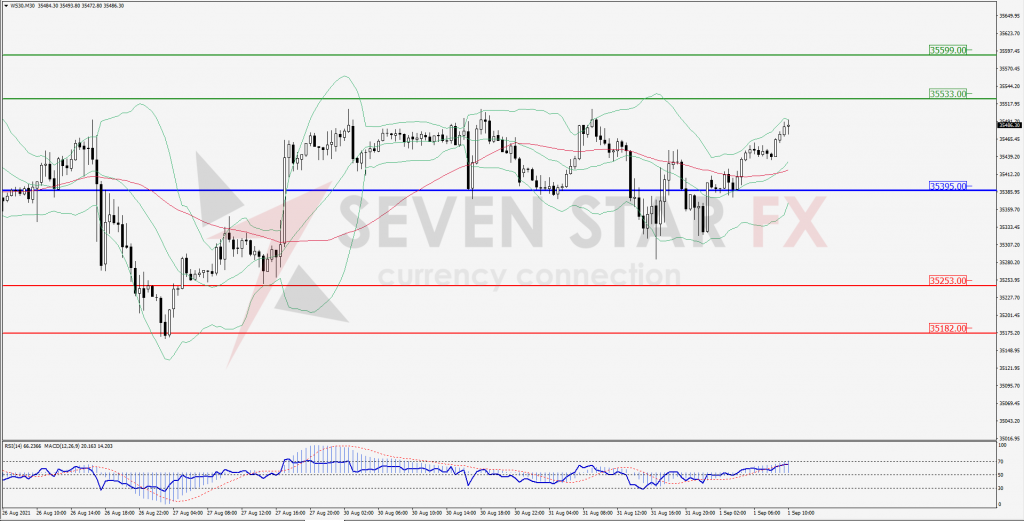
Green Lines Indicate Resistance Levels – Red Lines Indicates Support Levels
Light Blue is a Pivot Point – Black represents the price when the report was produced