Market Wrap: Stocks, Bonds, Commodities
Wall Street rallied to close sharply higher at the close of a tumultuous week on waning concerns over whether the US Federal Reserve could begin tightening its dovish monetary policy sooner than expected.
The Dow Jones Industrial Average rose 222.15 points (0.64%) to 35,116.27, the S&P 500 gained 35.79 points (0.81%) to 4,441.59 and the Nasdaq Composite added 169.95 points (1.17%) to 14,711.73.
Asian share markets were trying to pick up the pieces on Monday following last week’s thrashing as coronavirus concerns showed little sign of abating, while safe-haven flows benefited the dollar ahead of a key update on U.S. monetary policy.
MSCI’s index of Asia-Pacific stocks outside Japan gained 1.37% to 793.45 levels. Australian index rose 0.39% to 7,489.90. Japanese Nikkei traded 1.79% higher to 27,497.00.
European stocks were higher on Monday, with the Stoxx Europe 50 Index advance 0.77% to 4,179.15, Germany’s DAX rose 0.61% to 15,905.30, and France’s CAC gained 0.90% to 6,685.50, and U.K.’s FTSE 100 up 0.86% to 6,679.15.
Benchmark 10-year U.S. Treasury rose as demand for safe assets grows again, today 10-year bond yields up 0.80% to 1.270.
Oil prices rose on Monday, recovering from a seven-day losing streak as investors hunted for bargains and a softer dollar lent support, though persistent anxiety over surging cases of the Delta coronavirus variant kept sentiment cautious.
Spot Brent crude oil jumped 2.12% to $66.12 per barrel. US West Texas Intermediate crude advance 2.04% to $63.39 a barrel.
The yellow metal traded 0.18% higher to 1787.20 dollars per ounce.
Market Wrap: Forex
The safe-haven dollar traded near its highest in more than nine months against major peers on Monday, while commodity currencies like the Aussie languished amid worries that the Delta coronavirus variant could derail the global economic recovery.
Today, the U.S. dollar index measures the greenback against a trade-weighted basket of six major currencies, which fell 0.20% to 93.332.
The Euro US Dollar (EUR/USD) is a widely traded pair that advanced 0.20% today. This left the pairing trading around $1.17150.
The Japanese yen lost against the U.S. dollar on Monday as the stock pushes higher. Today US/JPY gained 0.15% to 109.950 level.
Another commodity-related currency higher against the U.S dollar, AUD/USD up 0.36% to 0.71580, and NZD/USD rose 0.31% to 0.68440 level.
EUR/USD Intraday: Support at 1.16990
Our pivot point is at 1.16990
Preferable Price Action: Take long positions above pivot level with targets at 1.17370 & 1.17570 in extension.
Alternative Price Action: Below pivot looks for a further downside to 1.16620 & 1.16420.
Comment: Pair above its 55MA & 20MA and RSI above 50 levels.
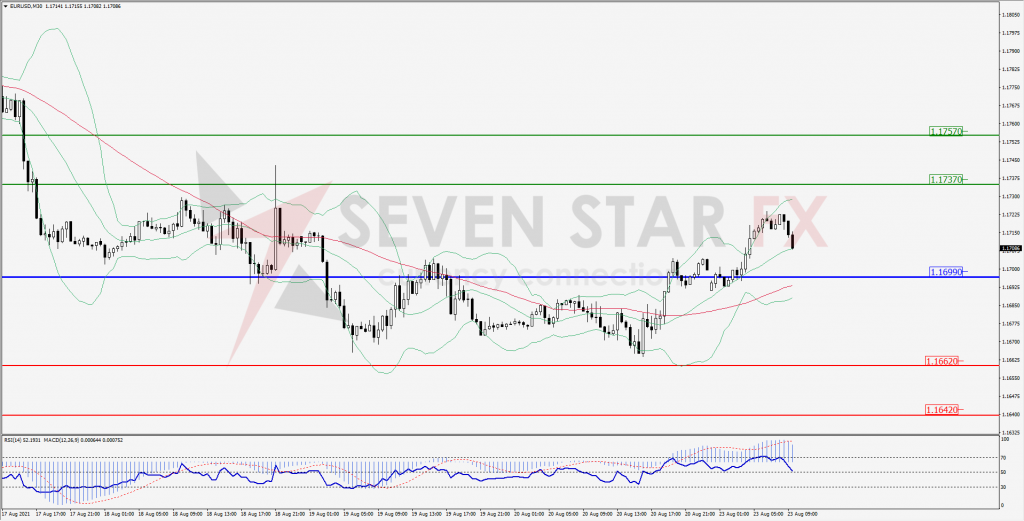
Green Lines Indicate Resistance Levels – Red Lines Indicates Support Levels
Light Blue is a Pivot Point – Black represents the price when the report was produced
GBP/USD Intraday: Break consolidation area
Our pivot point is at 1.36260
Preferable Price Action: Buy positions above pivot with targets at 1.36940 & 1.37380 in extension.
Alternative Price Action: The price below pivot would call for further downside to 1.35660 & 1.35260.
Comment: Pair above its 55MA & 20MA and RSI above 50 levels.
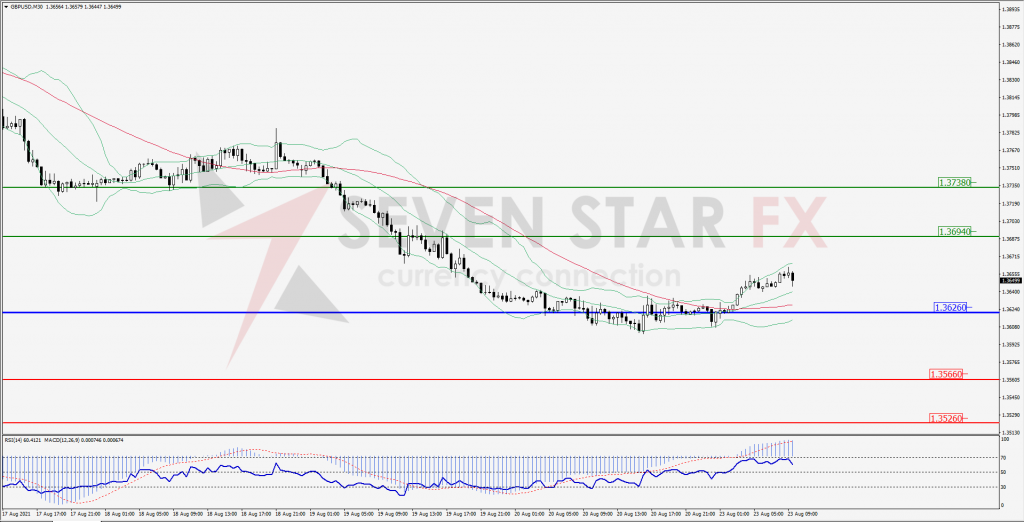
Green Lines Indicate Resistance Levels – Red Lines Indicates Support Levels
Light Blue is a Pivot Point – Black represents the price when the report was produced
USD/JPY Intraday: Support at 109.770
Our pivot point is at 109.770
Preferable Price Action: Buy position above pivot with the target at 110.170 and 110.400 in extension.
Alternative Price Action: The downside breakout of the pivot would call for 109.340 and 109.080.
Comment: Price above its 20MA & 55MA and MACD in positive territory.
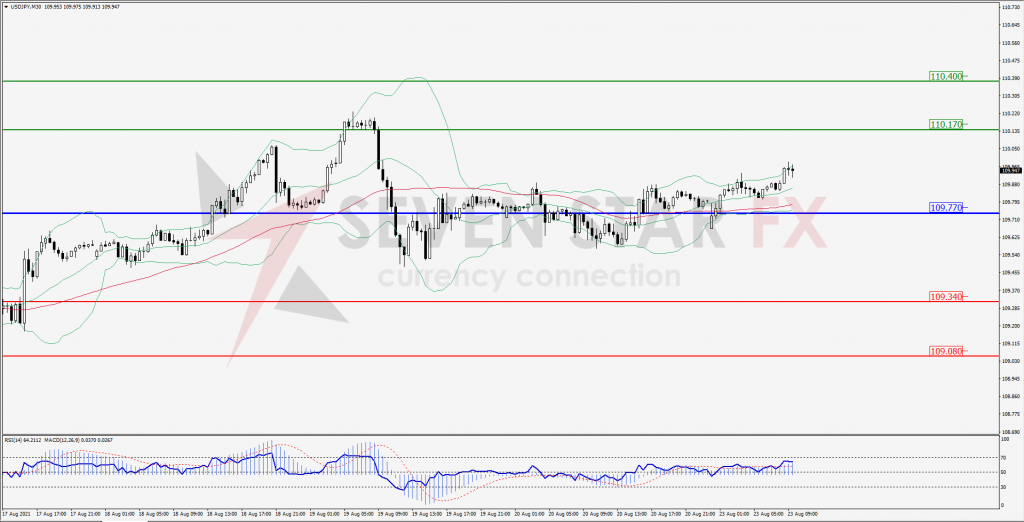
Green Lines Indicate Resistance Levels – Red Lines Indicates Support Levels
Light Blue is a Pivot Point – Black represents the price when the report was produced
AUD/USD Intraday: Trend may reverse to upside
Our pivot point is at 0.71350
Preferable Price Action: Buy Positions above pivot with targets at 0.72060 & 0.72440 in extension.
Alternative Price Action: Below pivot looks for a further downside with 0.70630 & 0.70270 as targets.
Comment: Pair above its 20MA & 55MA and RSI above 50 levels.
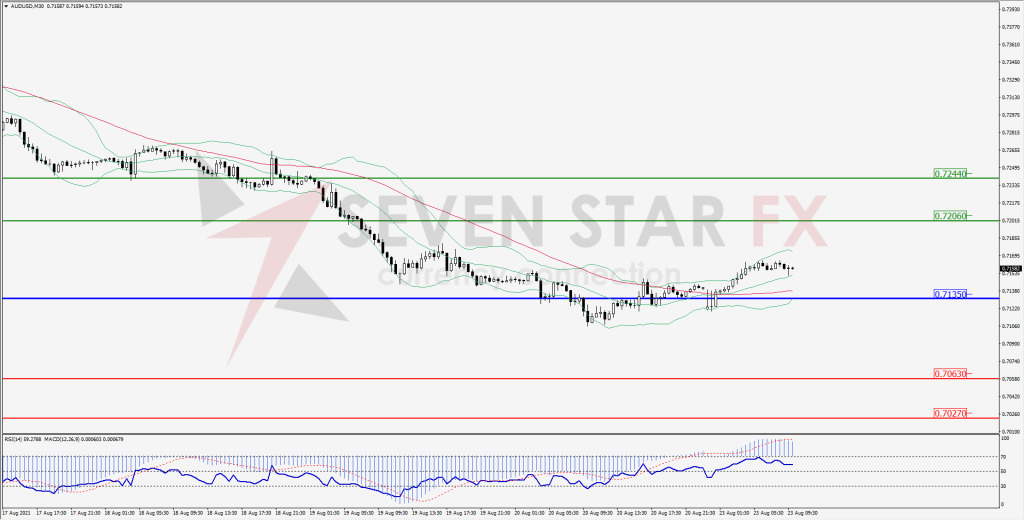
Green Lines Indicate Resistance Levels – Red Lines Indicates Support Levels
Light Blue is a Pivot Point – Black represents the price when the report was produced
CRUDEOIL Intraday: Support at 62.51
Our pivot point is at 62.51
Preferable Price Action: Above pivots buy Oil with 64.48 & 65.71 as targets.
Alternative Price Action: Sell crude below pivot with targets at 60.54 and 59.29 in extension.
Comment: Crude is above its 55MA & 20MA and MACD in the positive territory.
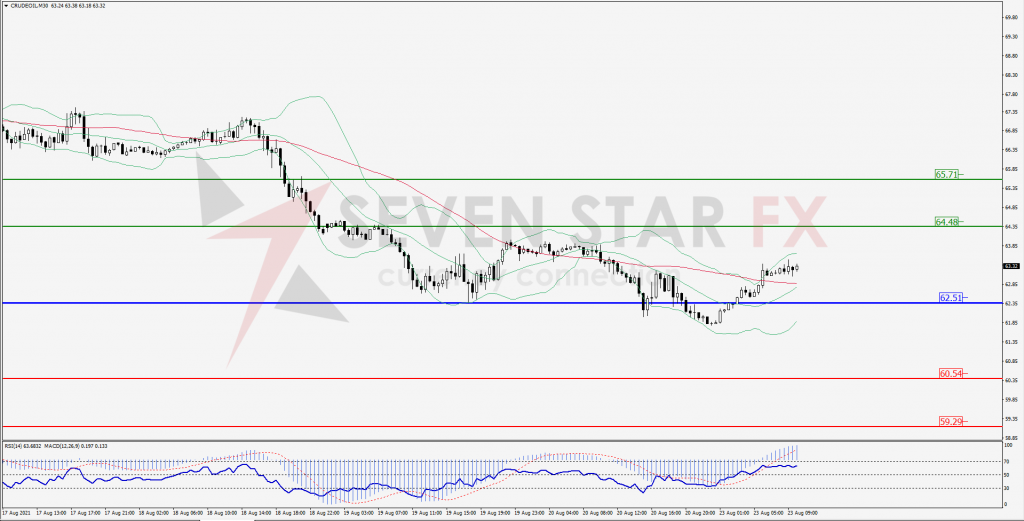
Green Lines Indicate Resistance Levels – Red Lines Indicates Support Levels
Light Blue is a Pivot Point – Black represents the price when the report was produced
XAU/USD Intraday: In a consolidation zone
Our pivot point is 1779.40
Preferable Price Action: Further upside to 1793.40 & 1800.90.
Alternative Price Action: If the price gives a downside breakout of a pivot, then the price extends to 1766.20 and 1758.90.
Comment: MACD in positive territory and price above its 55MA & 20MA.
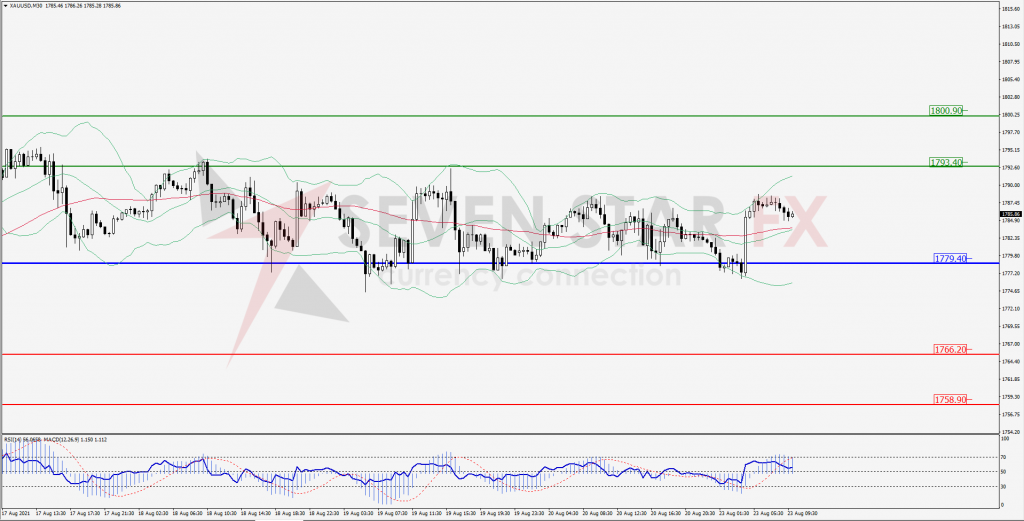
Green Lines Indicate Resistance Levels – Red Lines Indicates Support Levels
Light Blue is a Pivot Point – Black represents the price when the report was produced
Dow Jones Intraday: Support at 35,144.00
Our pivot point is 35,144.00
Preferable Price Action: Take long positions above pivot with targets at 34,469.00 & 35,646.00.
Alternative Price Action: below 35,144.00 looks for further downside to 34,841.00 & 34,679.00.
Comment: Price above its 20MA & 55MA and RSI at overbought levels.
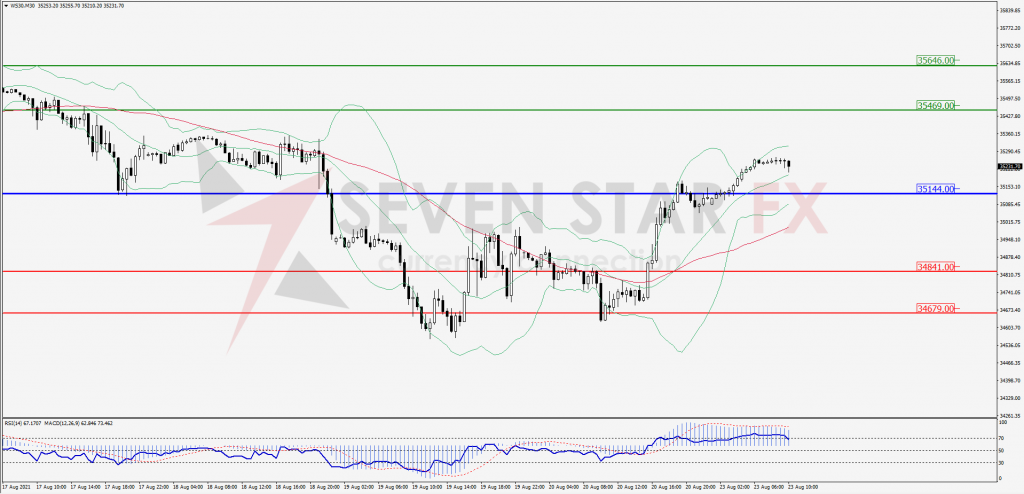
Green Lines Indicate Resistance Levels – Red Lines Indicates Support Levels
Light Blue is a Pivot Point – Black represents the price when the report was produced