Market Wrap: Stocks, Bonds, Commodities
Wall Street rose on Tuesday, with both the blue-chip Dow and benchmark S&P 500 closing at record highs, as economically sensitive value stocks gained with the U.S. Senate’s passage of a $1 trillion bipartisan infrastructure package.
The Dow Jones Industrial Average rose 162.82 points (0.46%) to 35,264.67, the S&P 500 gained 4.40 points (0.10%) to 4,436.75 and the Nasdaq Composite droped 72.1 points (0.49%) to 14,788.10.
Asia Pacific stocks were mostly up on Wednesday morning. Gains remained modest as investors continued to assess the impact of rising COVID-19 cases and central bank asset tapering on the global economy.
MSCI’s index of Asia-Pacific stocks outside Japan lost 0.36% to 833.19 levels. Australian index gained 0.29% to 7,584.30. Japanese Nikkei traded 0.65% higher to 28,080.50.
European stocks were higher on Wednesday, with the Stoxx Europe 50 Index gained 0.10% to 4,192.13, Germany’s DAX rose 0.05% to 15,773.30, and France’s CAC up 0.18% to 6,832.50, and U.K.’s FTSE 100 up 0.27% to 7,180.50.
Benchmark 10-year U.S. Treasury rose as demand for safe assets grows again, today 10-year bond yields gained 2.28% to 1.373.
Oil prices dipped on Wednesday as analysts cut their forecasts for fuel demand in China following mobility curbs from the spread of the highly infectious Delta variant of the coronavirus, offsetting a bullish outlook for U.S. fuel demand.
Spot Brent crude oil advance 0.10% to $70.72 per barrel. US West Texas Intermediate crude gained 0.06% to $68.33 a barrel.
The yellow metal traded 0.06% higher to 1732.85 dollars per ounce.
Market Wrap: Forex
The dollar and U.S. yields extended gains in Asia on Wednesday, spurred by tapering talk, while Asian shares traded sideways on fears about the spread of the coronavirus despite a record close on Wall Street.
Today, the U.S. dollar index measures the greenback against a trade-weighted basket of six major currencies, gained 0.10% to 93.148.
The Euro US Dollar (EUR/USD) is a widely traded pair that lost 0.03% today. This left the pairing trading around $1.17130
The Japanese yen fell against the U.S. dollar on Wednesday as the stock pushes higher. Today US/JPY rose 0.21% to 110.770 level.
Another commodity-related currency lower against the U.S dollar, AUD/USD lost 0.30% to 0.73280, and NZD/USD slipped 0.11% to 0.69970.
EUR/USD Intraday: Trend on the downside
Our pivot point is at 1.17360
Preferable Price Action: Take short positions below pivot level with targets at 1.16930 & 1.16680 in extension.
Alternative Price Action: Above pivot looks for a further upside to 1.17780 & 1.18040.
Comment: Pair below its 55MA & 20MA and RSI below 50 levels.
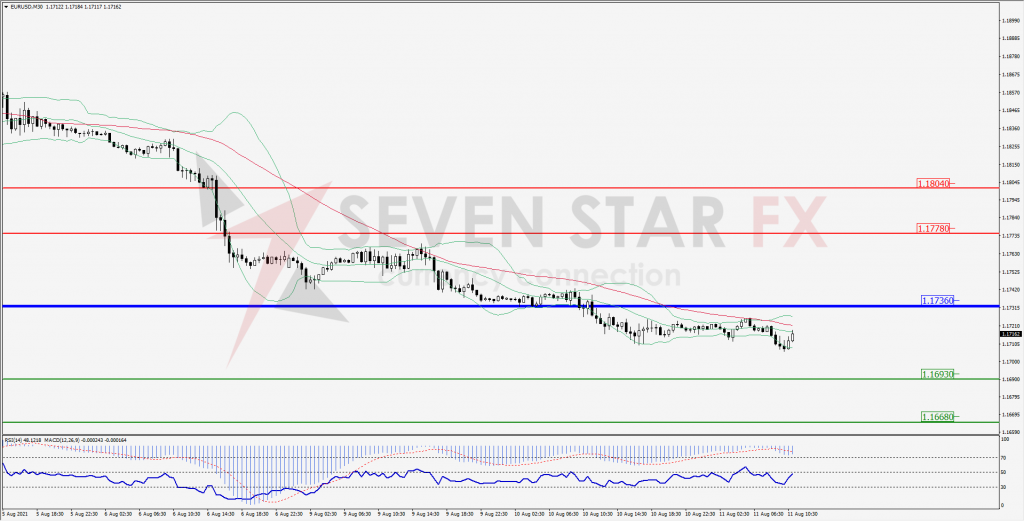
Green Lines Indicate Resistance Levels – Red Lines Indicates Support Levels
Light Blue is a Pivot Point – Black represents the price when the report was produced
GBP/USD Intraday: Break support level
Our pivot point is at 1.38500
Preferable Price Action: Sell positions below pivot with targets at 1.37910 & 1.37570 in extension.
Alternative Price Action: The price above pivot would call for further upside to 1.39100 & 1.39460.
Comment: Price below its 20MA & 55MA and RSI below 50 levels.
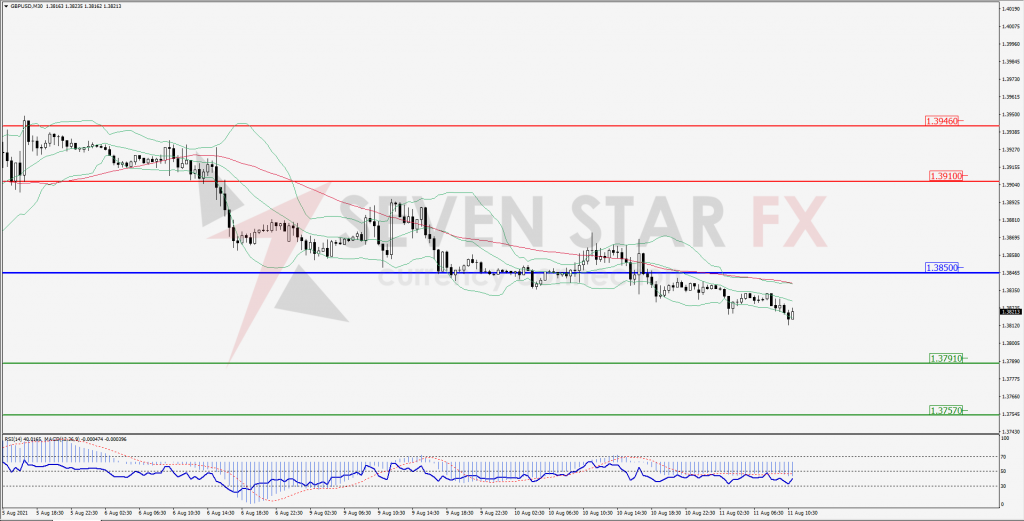
Green Lines Indicate Resistance Levels – Red Lines Indicates Support Levels
Light Blue is a Pivot Point – Black represents the price when the report was produced
USD/JPY Intraday: Trend on the upside
Our pivot point is at 110.550
Preferable Price Action: Buy position above pivot with the target at 111.070 and 111.350 in extension.
Alternative Price Action: The downside breakout of the pivot would call for 110.030 and 109.730.
Comment: price above its 20MA & 55MA and MACD in positive territory.
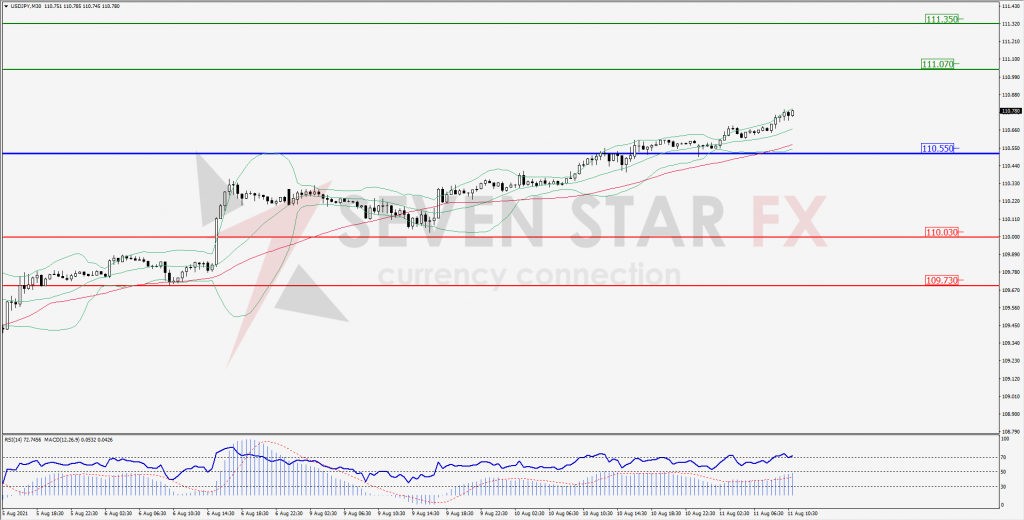
Green Lines Indicate Resistance Levels – Red Lines Indicates Support Levels
Light Blue is a Pivot Point – Black represents the price when the report was produced
AUD/USD Intraday: Resistance at 0.73510
Our pivot point is at 0.73510
Preferable Price Action: Sell Positions below pivot with targets at 0.73080 & 0.72840 in extension.
Alternative Price Action: above pivot looks for a further upside with 0.73940 & 0.74200 as targets.
Comment: Pair below its 55MA & 20MA and RSI below 50 levels.
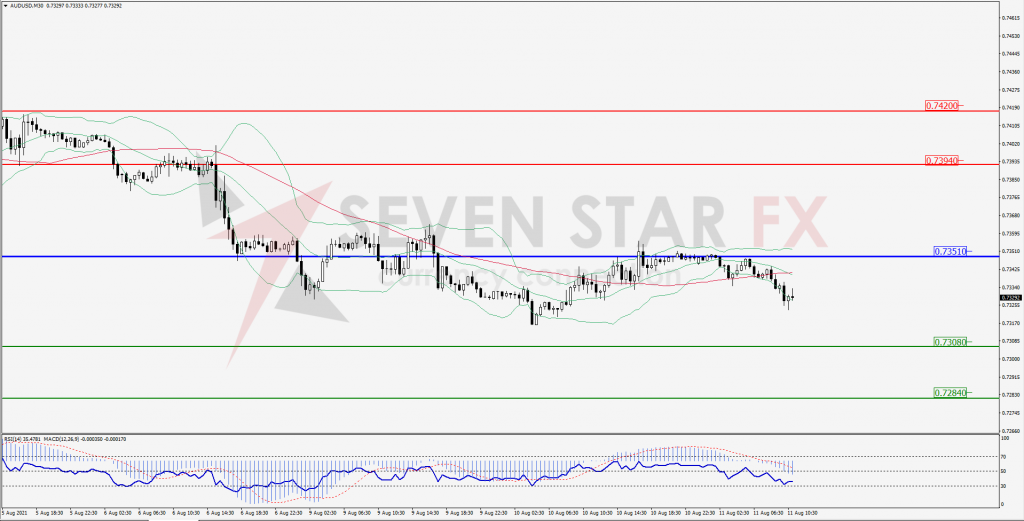
Green Lines Indicate Resistance Levels – Red Lines Indicates Support Levels
Light Blue is a Pivot Point – Black represents the price when the report was produced
CRUDEOIL Intraday: Trend on the upside
Our pivot point is at 67.66
Preferable Price Action: Above pivots buy Oil with 69.04 & 69.63 as targets.
Alternative Price Action: Sell crude below pivot with targets at 66.31 and 65.72 in extension.
Comment: Crude is above its 55MA & 20MA and MACD in the positive territory.
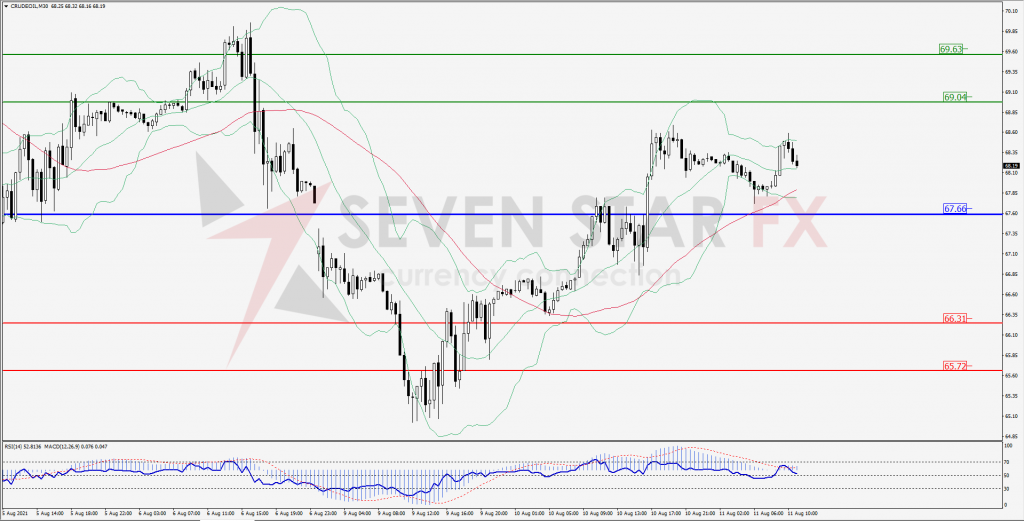
Green Lines Indicate Resistance Levels – Red Lines Indicates Support Levels
Light Blue is a Pivot Point – Black represents the price when the report was produced
XAU/USD Intraday: Support at 1724.80
Our pivot point is 1724.80
Preferable Price Action: Further upside to 1756.60 & 1775.60.
Alternative Price Action: If the price gives a downside breakout of a pivot, then the price extends to 1690.20 and 1671.40.
Comment: MACD in positive territory and price above it’s 20MA.
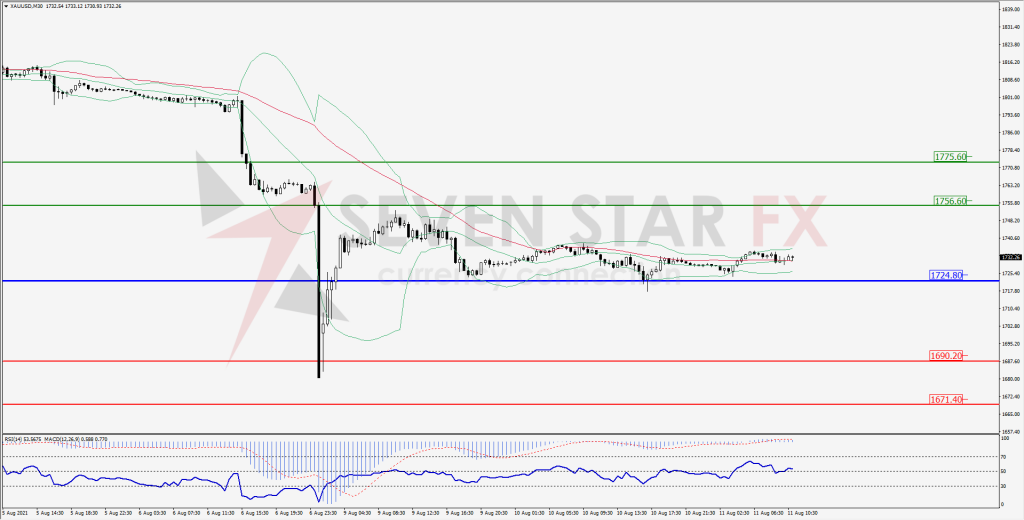
Green Lines Indicate Resistance Levels – Red Lines Indicates Support Levels
Light Blue is a Pivot Point – Black represents the price when the report was produced
Dow Jones Intraday: Support at 35,179.00
Our pivot point is 35,179.00
Preferable Price Action: Take long positions above pivot with targets at 35,307.00 & 35,392.00.
Alternative Price Action: below 35,179.00 looks for further downside to 35,036.00 & 34,959.00.
Comment: Price above its 55MA and RSI above 50 levels.
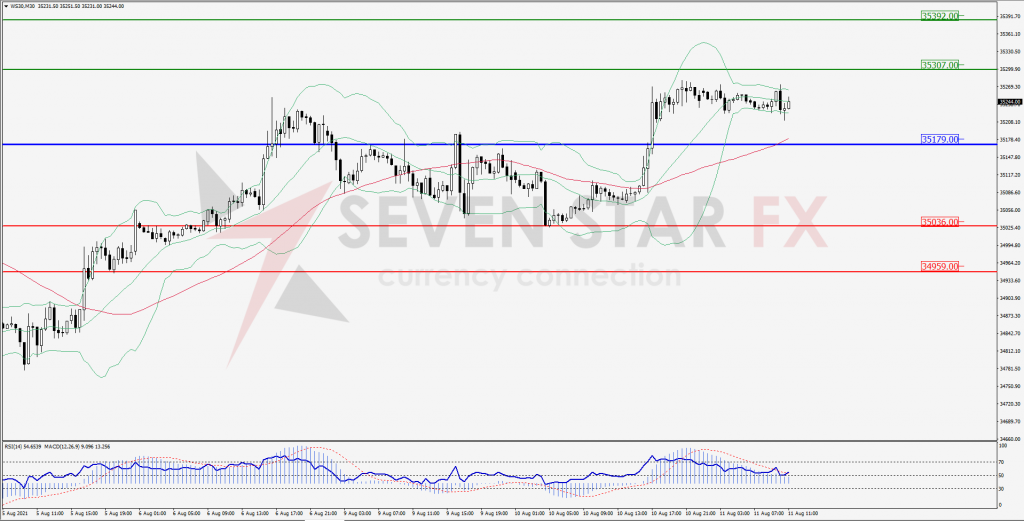
Green Lines Indicate Resistance Levels – Red Lines Indicates Support Levels
Light Blue is a Pivot Point – Black represents the price when the report was produced