EURO DAILY MARKET ANALYSIS REPORT
📈 DAILY EUR/USD MARKET ANALYSIS – FEBRUARY 19, 2025
🔹 OVERVIEW: EURO REMAINS RANGE-BOUND AMID ECONOMIC UNCERTAINTY
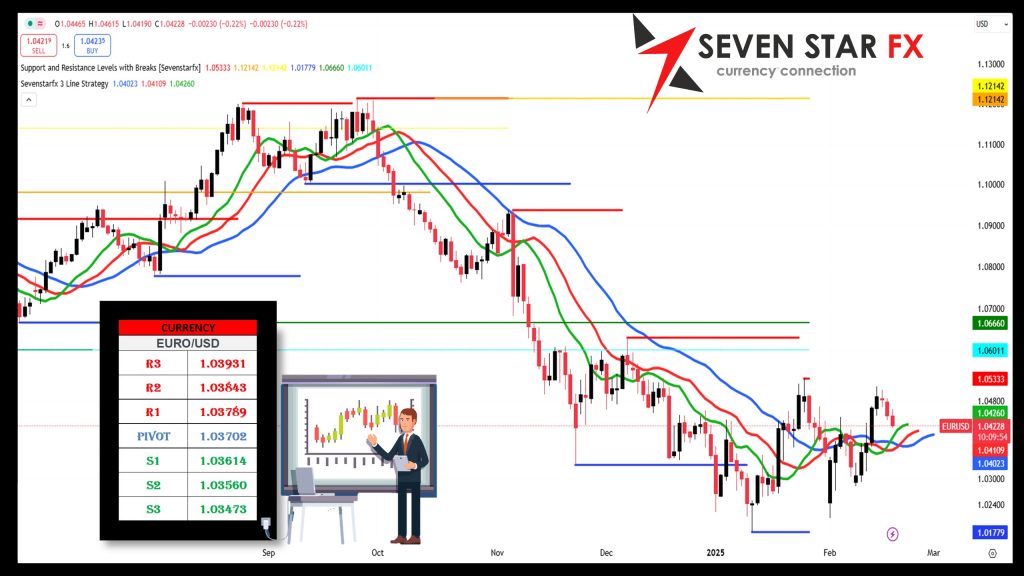
The EUR/USD pair is experiencing a sideways movement around the 1.0370 pivot level, reflecting market caution ahead of key economic events. Inflation data, Federal Reserve signals, and European economic sentiment are the primary driving forces behind the current price action.
- Current Price: 1.03702 (Pivot)
- Daily Range: 1.03473 – 1.03931
📊 Resistance & Support Levels:
✅ R3: 1.03931 | R2: 1.03843 | R1: 1.03789
✅ Pivot Point: 1.03702
✅ S1: 1.03614 | S2: 1.03560 | S3: 1.03473
🔍 FUNDAMENTAL ANALYSIS
🇺🇸 US ECONOMIC FACTORS IMPACTING EUR/USD
📌 Federal Reserve’s Rate Outlook: Investors await the FOMC meeting minutes, which may reinforce the Fed’s cautious stance on rate cuts. Markets currently price in a 25bps rate cut in Q3 2025, keeping the US Dollar supported and limiting EUR/USD upside.
📌 US Treasury Yields & Inflation: The 10-year yield has risen to 4.56%, strengthening the USD and pressuring the Euro. If yields rise further, EUR/USD may test S2 (1.03560) and S3 (1.03473).
📌 Risk Sentiment & Market Volatility: Uncertainty around US tariffs on European exports (especially autos & pharmaceuticals) has dampened investor sentiment, limiting upside for the Euro.
🇪🇺 EUROPEAN ECONOMIC FACTORS IMPACTING EUR/USD
📌 Eurozone GDP & Growth Concerns: The Eurozone’s economic growth remains sluggish, with Germany’s industrial output declining by 0.8% in January. A weak outlook may push EUR/USD toward the S1 (1.03614) level.
📌 ECB Policy Stance: The European Central Bank (ECB) has maintained a wait-and-see approach regarding rate cuts. ECB officials are signaling no rate cuts before mid-2025, providing some support for the Euro.
📌 Geopolitical Risks: Rising tensions in Eastern Europe and weaker demand from China are dampening Euro demand, making it vulnerable to further downside pressure.
📉 TECHNICAL ANALYSIS: EUR/USD SETTING UP FOR BREAKOUT?
🔹 Fibonacci Retracement Levels (Based on Recent Highs & Lows)
- 23.6% – 1.03650 (Minor Support)
- 38.2% – 1.03720 (Key Intraday Pivot)
- 50.0% – 1.03780 (Critical Resistance)
- 61.8% – 1.03840 (Breakout Level)
- 78.6% – 1.03900 (Upside Target)
📌 A move above 1.03840 (61.8% Fib) could trigger a bullish breakout toward 1.03931 (R3).
📌 Failure to hold 1.03650 (23.6% Fib) may push EUR/USD toward 1.03560 (S2).
📐 GANN THEORY ANALYSIS
According to Gann’s Square of 9 Levels, EUR/USD is near a key time cycle pivot, suggesting a potential trend reversal if 1.03840 is broken.
📌 Key Gann Angles:
- Bullish Scenario: If EUR/USD breaks 1.03840 (61.8% Fib & R2), it could signal an uptrend targeting 1.0400-1.0420.
- Bearish Scenario: If EUR/USD fails to hold 1.03614 (S1), it could decline toward 1.03470 (S3).
📊 ELLIOTT WAVE ANALYSIS: EUR/USD IN A CORRECTIVE WAVE?
Current price action suggests EUR/USD is in a Wave 4 correction phase before a possible Wave 5 decline toward 1.03470 (S3).
📌 Wave Count:
1️⃣ Wave 1: Strong push toward 1.03850
2️⃣ Wave 2: Retracement to 1.03650 (23.6% Fib)
3️⃣ Wave 3: Rally attempt near 1.03900 (78.6% Fib)
4️⃣ Wave 4: Consolidation around 1.03702 (Pivot)
5️⃣ Wave 5 (Pending): Possible drop toward 1.03560 (S2) or lower
📌 TRADING STRATEGY & OUTLOOK
🔹 Bullish Case (Above 1.03840 – 61.8% Fib)
✅ Buy EUR/USD if it breaks 1.03840, targeting 1.03931 (R3) and 1.04100.
✅ Stop Loss: Below 1.03650 (23.6% Fib).
🔹 Bearish Case (Below 1.03614 – S1 Level)
❌ Sell EUR/USD below 1.03614, targeting 1.03560 (S2) and 1.03470 (S3).
❌ Stop Loss: Above 1.03800.
🏆 FINAL OUTLOOK: NEUTRAL TO BEARISH BIAS
📉 Short-term Bias: Neutral-to-bearish as long as EUR/USD trades below 1.03840.
📉 Medium-term Trend: Vulnerable to downside toward 1.03560, unless a breakout above 1.03931 occurs.
📌 Key Watch: FOMC minutes & ECB statements for further market direction.
👉 Traders should watch for a breakout confirmation above 1.03840 or a rejection below 1.03614 for the next major move. 🚀📊
Disclaimer
This analysis is for educational purposes only. Forex trading is highly volatile and carries significant risks. Always use proper risk and money management strategies as trading without them can lead to substantial financial loss.
GBP/USD DAILY MARKET ANALYSIS REPORT
Disclaimer
This analysis is for educational purposes only. Forex trading is highly volatile and carries significant risks. Always use proper risk and money management strategies as trading without them can lead to substantial financial loss.
USD/JPY DAILY MARKET ANALYSIS REPORT
📈 DAILY USD/JPY MARKET ANALYSIS – FEBRUARY 19, 2025
🔹 OVERVIEW: USD/JPY HITS RESISTANCE AS YIELDS REMAIN HIGH
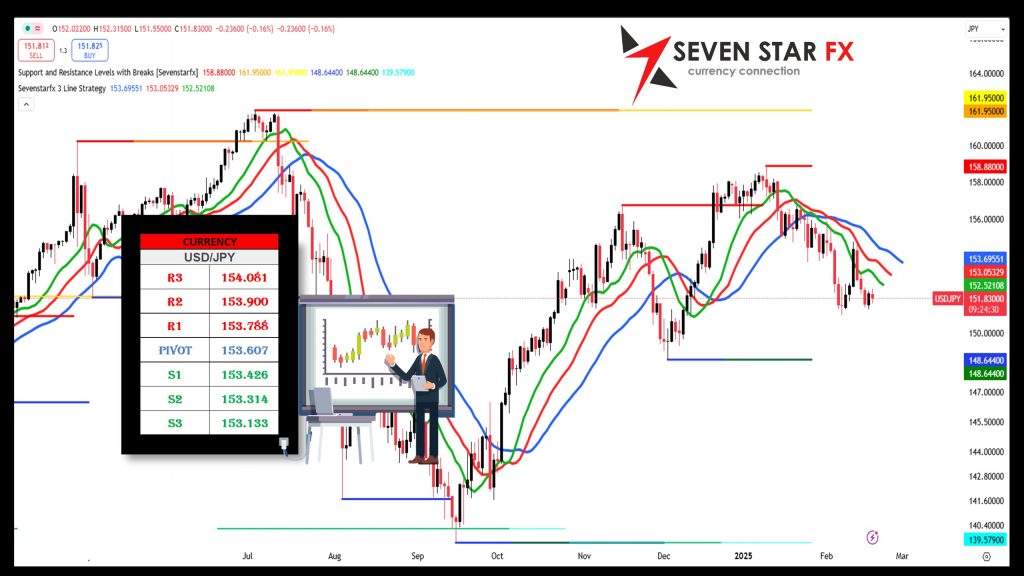
The USD/JPY pair is trading near the 153.607 pivot level, reflecting strong USD demand amid rising US Treasury yields and Japan’s cautious monetary policy stance. The pair remains in an uptrend, with a potential breakout above 154.081 (R3) if bullish momentum persists.
- Current Price: 153.607 (Pivot)
- Daily Range: 153.133 – 154.081
📊 Resistance & Support Levels:
✅ R3: 154.081 | R2: 153.900 | R1: 153.788
✅ Pivot Point: 153.607
✅ S1: 153.426 | S2: 153.314 | S3: 153.133
🔍 FUNDAMENTAL ANALYSIS
🇺🇸 US ECONOMIC FACTORS IMPACTING USD/JPY
📌 Federal Reserve Policy & Interest Rate Outlook:
- The FOMC minutes release is expected to confirm the Fed’s cautious approach to rate cuts.
- Markets price in the first Fed rate cut for Q3 2025, keeping US Dollar demand strong.
📌 US Treasury Yields & Inflation:
- The 10-year Treasury yield has risen to 4.56%, reinforcing USD strength.
- If yields continue to rise, USD/JPY could push above 154.000 toward R3 (154.081).
📌 Risk Sentiment & Safe-Haven Demand:
- The US Dollar remains the preferred safe-haven currency, limiting JPY demand amid geopolitical tensions.
🇯🇵 JAPANESE ECONOMIC FACTORS IMPACTING USD/JPY
📌 Bank of Japan (BoJ) Policy Outlook:
- The BoJ remains cautious about tightening monetary policy, keeping JPY under pressure.
- If the BoJ hints at potential policy normalization, JPY could strengthen, pushing USD/JPY lower.
📌 Japan’s Economic Data:
- Japan’s inflation & wage growth remain subdued, reducing pressure on the BoJ to tighten rates.
- Weak GDP growth suggests the BoJ may maintain an ultra-loose policy, keeping JPY weak.
📉 TECHNICAL ANALYSIS: USD/JPY EYES BREAKOUT ABOVE 154.000
🔹 Fibonacci Retracement Levels (Based on Recent Highs & Lows)
- 23.6% – 153.500 (Minor Support)
- 38.2% – 153.600 (Key Pivot Zone)
- 50.0% – 153.700 (Critical Resistance)
- 61.8% – 153.800 (Breakout Level)
- 78.6% – 153.950 (Upside Target)
📌 A move above 153.800 (61.8% Fib) could trigger a bullish breakout toward 154.081 (R3).
📌 Failure to hold 153.500 (23.6% Fib) may push USD/JPY toward 153.314 (S2).
📐 GANN THEORY ANALYSIS
Gann analysis suggests that USD/JPY is near a critical resistance level, where a break above 153.900 may signal a new bullish trend continuation.
📌 Key Gann Angles:
- Bullish Scenario: If USD/JPY breaks 153.900, it could rally toward 154.500.
- Bearish Scenario: A rejection at 153.788 (R1) may push the pair back toward 153.426 (S1).
📊 ELLIOTT WAVE ANALYSIS: USD/JPY IN WAVE 5 EXPANSION?
USD/JPY appears to be in a Wave 5 extension, signaling further upside potential.
📌 Wave Count:
1️⃣ Wave 1: Rally toward 153.900
2️⃣ Wave 2: Pullback to 153.600 (Pivot)
3️⃣ Wave 3: Surge to 154.081 (R3)
4️⃣ Wave 4: Minor correction to 153.700
5️⃣ Wave 5 (Pending): Possible move above 154.500 if momentum holds.
📌 TRADING STRATEGY & OUTLOOK
🔹 Bullish Case (Above 153.900 – R2 Level)
✅ Buy USD/JPY if it breaks above 153.900, targeting 154.081 (R3) and 154.500.
✅ Stop Loss: Below 153.600 (Pivot Level).
🔹 Bearish Case (Below 153.600 – Pivot Level)
❌ Sell USD/JPY below 153.600, targeting 153.426 (S1) and 153.314 (S2).
❌ Stop Loss: Above 153.800.
🏆 FINAL OUTLOOK: BULLISH BIAS
📈 Short-term Bias: Bullish as long as USD/JPY trades above 153.600.
📈 Medium-term Trend: If USD/JPY breaks 153.900, expect a move toward 154.500.
📌 Key Watch: BoJ & Fed policy statements for further direction.
👉 Traders should monitor a breakout above 153.900 for bullish confirmation or a drop below 153.600 for a reversal signal. 🚀📊
Disclaimer
This analysis is for educational purposes only. Forex trading is highly volatile and carries significant risks. Always use proper risk and money management strategies, as trading without them can result in substantial financial loss.
AUSTRALIAN DOLLAR DAILY MARKET ANALYSIS REPORT
📈 DAILY AUD/USD MARKET ANALYSIS – FEBRUARY 19, 2025
🔹 OVERVIEW: AUD/USD STRUGGLES NEAR PIVOT AS USD STRENGTH DOMINATES
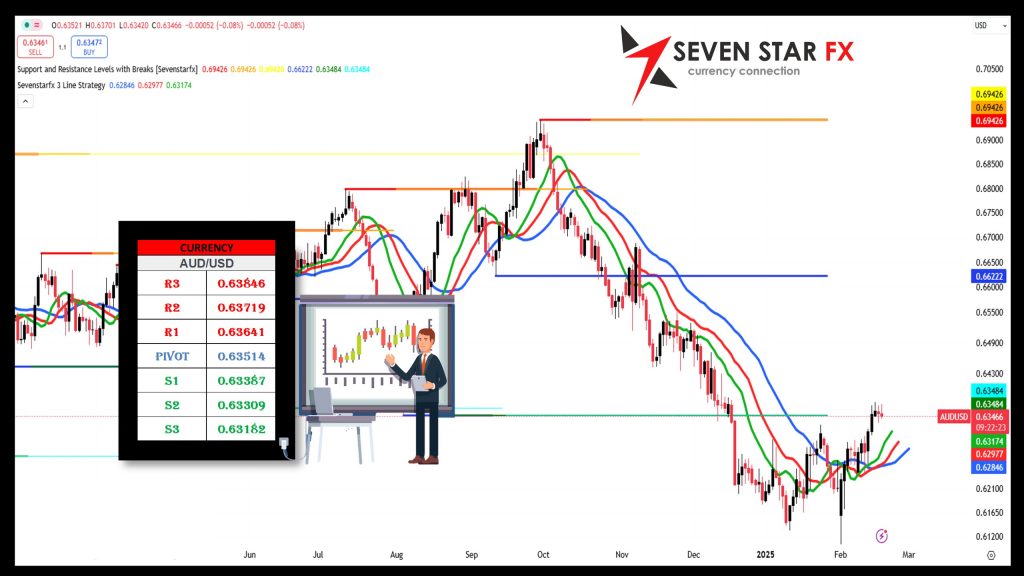
The AUD/USD pair is trading near the 0.63514 pivot level, as strong US Dollar demand and falling commodity prices weigh on the Australian Dollar. Investors are closely watching US Federal Reserve signals, China’s economic performance, and Australian labor market data for further direction.
- Current Price: 0.63514 (Pivot)
- Daily Range: 0.63182 – 0.63846
📊 Resistance & Support Levels:
✅ R3: 0.63846 | R2: 0.63719 | R1: 0.63641
✅ Pivot Point: 0.63514
✅ S1: 0.63387 | S2: 0.63309 | S3: 0.63182
🔍 FUNDAMENTAL ANALYSIS
🇺🇸 US ECONOMIC FACTORS IMPACTING AUD/USD
📌 Federal Reserve Policy & Interest Rate Expectations:
- The FOMC minutes release is expected to confirm the Fed’s cautious stance on rate cuts.
- Markets anticipate the first rate cut in Q3 2025, keeping the US Dollar strong and limiting AUD/USD upside.
📌 US Treasury Yields & Inflation:
- The 10-year Treasury yield at 4.56% continues to support USD strength, applying downside pressure on AUD/USD.
📌 Risk Sentiment & Equity Market Performance:
- Equity markets remain volatile, with China’s economic weakness weighing on global risk appetite.
- As a risk-sensitive currency, AUD remains vulnerable to further downside moves.
🇦🇺 AUSTRALIAN ECONOMIC FACTORS IMPACTING AUD/USD
📌 RBA Monetary Policy & Interest Rates:
- The Reserve Bank of Australia (RBA) remains in wait-and-see mode, monitoring inflation and labor market conditions.
- Markets are pricing in a potential RBA rate cut in late 2025, which could pressure AUD further.
📌 Australian Labor Market & Economic Data:
- Upcoming jobs report could impact AUD if employment figures disappoint.
- Weaker Chinese demand for Australian exports (especially iron ore) is a key risk factor.
📌 China’s Economic Slowdown & AUD Impact:
- China is Australia’s largest trading partner, and its slowing economy could negatively impact AUD demand.
📉 TECHNICAL ANALYSIS: AUD/USD TESTING KEY SUPPORT LEVELS
🔹 Fibonacci Retracement Levels (Based on Recent Highs & Lows)
- 23.6% – 0.63450 (Minor Support)
- 38.2% – 0.63500 (Key Pivot Zone)
- 50.0% – 0.63580 (Critical Resistance)
- 61.8% – 0.63660 (Breakout Level)
- 78.6% – 0.63750 (Upside Target)
📌 A move above 0.63660 (61.8% Fib) could trigger a bullish breakout toward 0.63846 (R3).
📌 Failure to hold 0.63450 (23.6% Fib) may push AUD/USD toward 0.63309 (S2).
📐 GANN THEORY ANALYSIS
Gann’s price/time analysis suggests AUD/USD is near a key reversal zone, where a break below 0.63387 may signal further downside toward 0.63182.
📌 Key Gann Angles:
- Bullish Scenario: If AUD/USD breaks 0.63641, it could rally toward 0.63850.
- Bearish Scenario: A failure to hold 0.63450 may push the pair toward 0.63182 (S3).
📊 ELLIOTT WAVE ANALYSIS: AUD/USD IN A CORRECTIVE PHASE
The AUD/USD pair appears to be in a corrective Wave 4 phase, suggesting potential Wave 5 weakness toward lower support levels.
📌 Wave Count:
1️⃣ Wave 1: Drop to 0.63387 (S1)
2️⃣ Wave 2: Recovery toward 0.63600
3️⃣ Wave 3: Rejection near 0.63719 (R2)
4️⃣ Wave 4: Sideways consolidation around 0.63514 (Pivot)
5️⃣ Wave 5 (Pending): Possible drop toward 0.63182 (S3) if selling pressure increases.
📌 TRADING STRATEGY & OUTLOOK
🔹 Bullish Case (Above 0.63660 – 61.8% Fib)
✅ Buy AUD/USD if it breaks above 0.63660, targeting 0.63846 (R3).
✅ Stop Loss: Below 0.63450 (23.6% Fib).
🔹 Bearish Case (Below 0.63450 – Support Breakdown)
❌ Sell AUD/USD below 0.63450, targeting 0.63309 (S2) and 0.63182 (S3).
❌ Stop Loss: Above 0.63600.
🏆 FINAL OUTLOOK: SLIGHTLY BEARISH BIAS
📉 Short-term Bias: Bearish if AUD/USD trades below 0.63514 (Pivot).
📉 Medium-term Trend: If AUD/USD breaks 0.63387, expect a move toward 0.63182.
📌 Key Watch: US economic data & RBA rate expectations for further direction.
👉 Traders should monitor a breakout above 0.63660 for bullish confirmation or a drop below 0.63450 for a bearish continuation. 🚀📊
Disclaimer
This analysis is for educational purposes only. Trading Crude Oil is highly volatile and carries significant risks. Always use proper risk and money management strategies, as trading without them can result in substantial financial loss.
CRUDE OIL DAILY MARKET ANALYSIS REPORT
📈 DAILY CRUDE OIL (WTI) MARKET ANALYSIS – FEBRUARY 19, 2025
🔹 OVERVIEW: CRUDE OIL PRICES REMAIN RANGE-BOUND AMID DEMAND CONCERNS
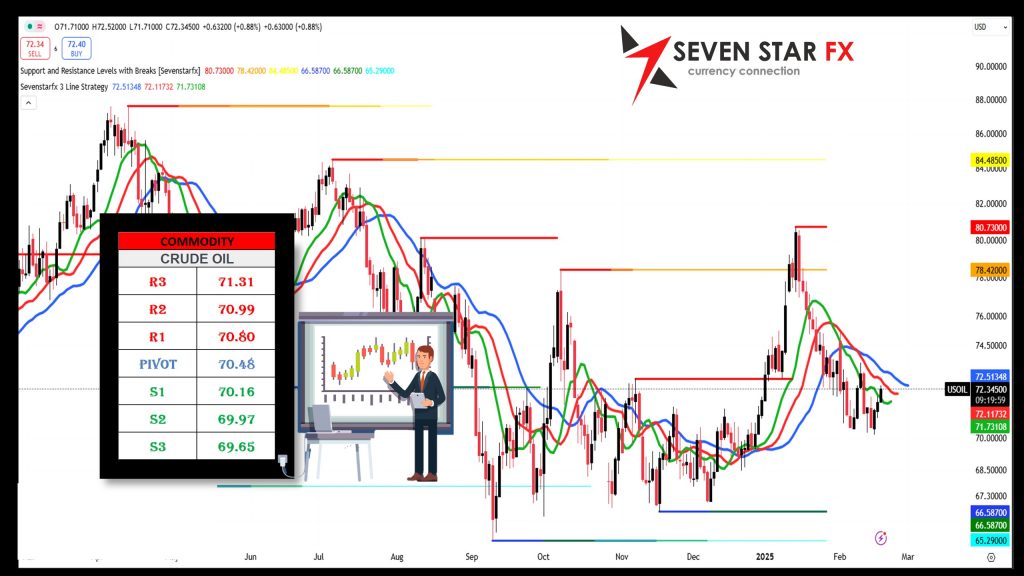
Crude oil (WTI – West Texas Intermediate) is trading around the $70.48 pivot level, as investors assess global demand trends, OPEC+ production decisions, and macroeconomic factors. The recent fluctuations in oil prices reflect a balancing act between supply constraints and economic uncertainty.
- Current Price: $70.48 (Pivot)
- Daily Range: $69.65 – $71.31
📊 Resistance & Support Levels:
✅ R3: $71.31 | R2: $70.99 | R1: $70.80
✅ Pivot Point: $70.48
✅ S1: $70.16 | S2: $69.97 | S3: $69.65
🔍 FUNDAMENTAL ANALYSIS
🌎 GLOBAL FACTORS IMPACTING CRUDE OIL PRICES
📌 OPEC+ Supply Adjustments & Production Cuts
- OPEC+ has maintained production cuts to support prices, but non-OPEC producers (US shale output) continue to weigh on supply.
- Any changes in OPEC+ policy could trigger a strong reaction in oil prices.
📌 US Crude Oil Inventories & Demand Trends
- The latest API and EIA crude stockpile reports show higher-than-expected inventory levels, signaling weaker demand.
- If inventories continue to build, it may put downward pressure on WTI prices.
📌 Macroeconomic Factors & Inflation Data
- The Federal Reserve’s policy stance on interest rates is crucial for oil demand, as higher rates slow down economic activity and fuel demand.
- Global economic growth expectations remain mixed, impacting crude oil price stability.
📌 Geopolitical Risks & Supply Disruptions
- Tensions in the Middle East could disrupt oil supply chains, providing short-term price support.
- If geopolitical risks ease, crude prices may face a corrective pullback.
📌 Impact on Euro (EUR/USD)
- Rising oil prices increase inflationary pressure in the Eurozone, potentially delaying ECB rate cuts.
- If oil prices decline, the EUR/USD pair may see some relief as inflation pressures ease.
📉 TECHNICAL ANALYSIS: CRUDE OIL TESTING KEY LEVELS
🔹 Fibonacci Retracement Levels (Based on Recent Highs & Lows)
- 23.6% – $70.10 (Minor Support)
- 38.2% – $70.30 (Key Pivot Zone)
- 50.0% – $70.55 (Mid-Level Resistance)
- 61.8% – $70.75 (Breakout Level)
- 78.6% – $71.00 (Upside Target)
📌 A move above $70.75 (61.8% Fib) could trigger a bullish breakout toward $71.31 (R3).
📌 Failure to hold $70.10 (23.6% Fib) may push WTI toward $69.65 (S3).
📐 GANN THEORY ANALYSIS
According to Gann’s price/time cycle analysis, crude oil is nearing a breakout phase, where a move above $70.80 (R1) could signal further upside momentum.
📌 Key Gann Angles:
- Bullish Scenario: If WTI breaks $70.80, it could rally toward $71.50+.
- Bearish Scenario: A failure to hold $70.16 (S1) may lead to a decline toward $69.65 (S3).
📊 ELLIOTT WAVE ANALYSIS: OIL IN A CORRECTIVE WAVE?
WTI crude appears to be in a Wave 4 correction, signaling potential Wave 5 strength if it holds above $70.16.
📌 Wave Count:
1️⃣ Wave 1: Rally toward $70.99 (R2)
2️⃣ Wave 2: Retracement to $70.16 (S1)
3️⃣ Wave 3: Attempt to test $71.31 (R3)
4️⃣ Wave 4: Consolidation near $70.48 (Pivot)
5️⃣ Wave 5 (Pending): Possible breakout toward $72.00+ if momentum builds.
📌 TRADING STRATEGY & OUTLOOK
🔹 Bullish Case (Above $70.75 – 61.8% Fib)
✅ Buy WTI above $70.75, targeting $71.31 (R3) and $72.00.
✅ Stop Loss: Below $70.10 (23.6% Fib).
🔹 Bearish Case (Below $70.16 – S1 Level)
❌ Sell WTI below $70.16, targeting $69.97 (S2) and $69.65 (S3).
❌ Stop Loss: Above $70.55.
🏆 FINAL OUTLOOK: NEUTRAL TO SLIGHTLY BULLISH
📈 Short-term Bias: Neutral, with a slight bullish inclination if WTI stays above $70.48.
📉 Medium-term Trend: If WTI breaks below $70.16, expect a move toward $69.65.
📌 Key Watch: US oil inventories, OPEC+ statements, and global demand trends for further direction.
👉 Traders should monitor a breakout above $70.75 for bullish confirmation or a drop below $70.16 for a bearish continuation. 🚀📊
Disclaimer
This analysis is for educational purposes only. Trading Crude Oil is highly volatile and carries significant risks. Always use proper risk and money management strategies, as trading without them can result in substantial financial loss.
XAU/USD DAILY MARKET ANALYSIS REPORT
📈 DAILY XAU/USD (GOLD) MARKET ANALYSIS – FEBRUARY 19, 2025
🔹 OVERVIEW: GOLD HOVERS NEAR PIVOT AS INVESTORS WEIGH FED OUTLOOK
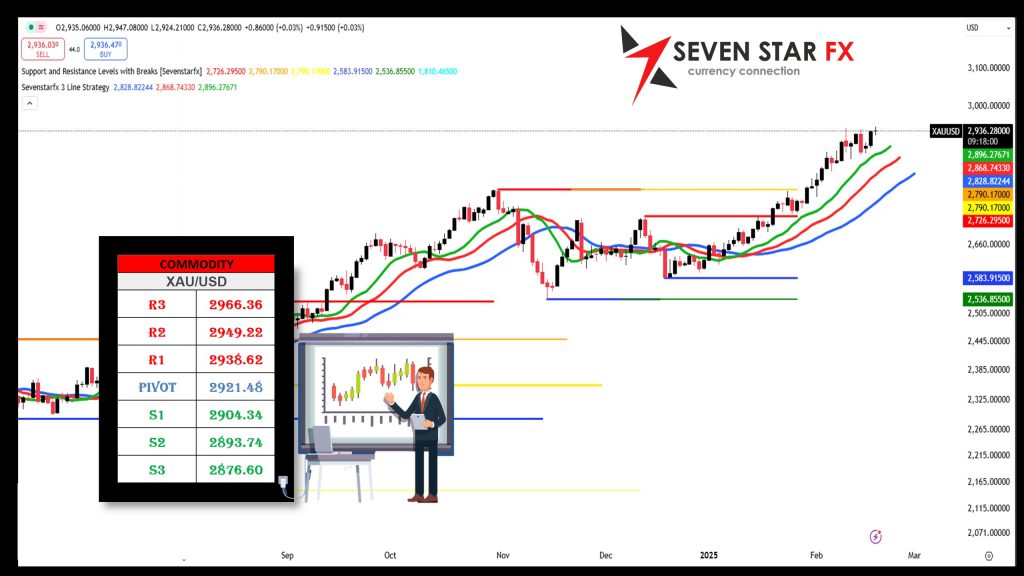
Gold (XAU/USD) is trading around the $2921.48 pivot level, facing pressure from rising US Treasury yields and a strong US Dollar. However, safe-haven demand and central bank gold purchases continue to provide support, preventing a deeper correction.
- Current Price: $2921.48 (Pivot)
- Daily Range: $2876.60 – $2966.36
📊 Resistance & Support Levels:
✅ R3: $2966.36 | R2: $2949.22 | R1: $2938.62
✅ Pivot Point: $2921.48
✅ S1: $2904.34 | S2: $2893.74 | S3: $2876.60
🔍 FUNDAMENTAL ANALYSIS
🇺🇸 US ECONOMIC FACTORS IMPACTING GOLD (XAU/USD)
📌 Federal Reserve Policy & Interest Rate Expectations:
- The FOMC minutes are set for release, and investors are looking for clues on when the Fed will cut interest rates.
- A delay in rate cuts could strengthen the US Dollar (USD) and push Gold lower.
📌 US Treasury Yields & Inflation Data:
- The 10-year Treasury yield at 4.56% increases the opportunity cost of holding gold, pressuring prices.
- If yields rise further, Gold may drop below $2900, testing S2 ($2893.74) and S3 ($2876.60).
📌 Risk Sentiment & Market Volatility:
- Geopolitical risks in the Middle East & Ukraine continue to support safe-haven demand for Gold.
- Uncertainty around US-China trade relations is another factor influencing Gold prices.
🌍 GLOBAL GOLD MARKET FACTORS
📌 Central Bank Gold Purchases:
- China & India’s central banks continue buying gold, providing long-term support.
📌 Physical Demand for Gold:
- Indian jewelry demand remains steady despite high prices.
- ETF inflows have been mixed, indicating investor uncertainty.
📉 TECHNICAL ANALYSIS: GOLD TESTING CRITICAL LEVELS
🔹 Fibonacci Retracement Levels (Based on Recent Highs & Lows)
- 23.6% – $2908.00 (Minor Support)
- 38.2% – $2920.00 (Key Pivot Zone)
- 50.0% – $2935.00 (Critical Resistance)
- 61.8% – $2945.00 (Breakout Level)
- 78.6% – $2958.00 (Upside Target)
📌 A move above $2945 (61.8% Fib) could trigger a bullish breakout toward $2966.36 (R3).
📌 Failure to hold $2908 (23.6% Fib) may push Gold toward $2893.74 (S2).
📐 GANN THEORY ANALYSIS
Gann’s price/time analysis suggests Gold is near a decision point, with a possible breakout above $2945 or a correction below $2904.
📌 Key Gann Angles:
- Bullish Scenario: If Gold breaks $2945, it could rally toward $2966 and beyond.
- Bearish Scenario: A failure to hold $2904 could lead to a drop toward $2876 (S3).
📊 ELLIOTT WAVE ANALYSIS: GOLD IN A CORRECTIVE PHASE
Gold appears to be in a Wave 4 correction, signaling potential Wave 5 strength if the pivot level holds.
📌 Wave Count:
1️⃣ Wave 1: Rally toward $2949.22 (R2)
2️⃣ Wave 2: Retracement to $2920
3️⃣ Wave 3: Attempt to test $2966.36 (R3)
4️⃣ Wave 4: Consolidation near $2921.48 (Pivot)
5️⃣ Wave 5 (Pending): Potential breakout toward $2980+ if momentum builds.
📌 TRADING STRATEGY & OUTLOOK
🔹 Bullish Case (Above $2945 – 61.8% Fib)
✅ Buy Gold above $2945, targeting $2966 (R3) and $2980.
✅ Stop Loss: Below $2920 (Pivot Level).
🔹 Bearish Case (Below $2904 – Support Breakdown)
❌ Sell Gold below $2904, targeting $2893 (S2) and $2876 (S3).
❌ Stop Loss: Above $2935.
🏆 FINAL OUTLOOK: NEUTRAL TO SLIGHTLY BULLISH
📈 Short-term Bias: Neutral, with a slight bullish inclination if Gold stays above $2920.
📉 Medium-term Trend: If Gold breaks below $2904, expect a move toward $2876.
📌 Key Watch: US economic data, Fed policy signals, and geopolitical risks for further direction.
👉 Traders should monitor a breakout above $2945 for bullish confirmation or a drop below $2904 for a bearish continuation. 🚀📊
Disclaimer
This analysis is for educational purposes only. Gold trading is highly volatile and carries significant risks. Always use proper risk and money management strategies, as trading without them can result in substantial financial loss.
DOW JONES DAILY MARKET ANALYSIS REPORT
📈 DAILY DOW JONES (DJIA) MARKET ANALYSIS – FEBRUARY 19, 2025
🔹 OVERVIEW: DOW JONES HOLDS STEADY AS INVESTORS AWAIT FED CLARITY
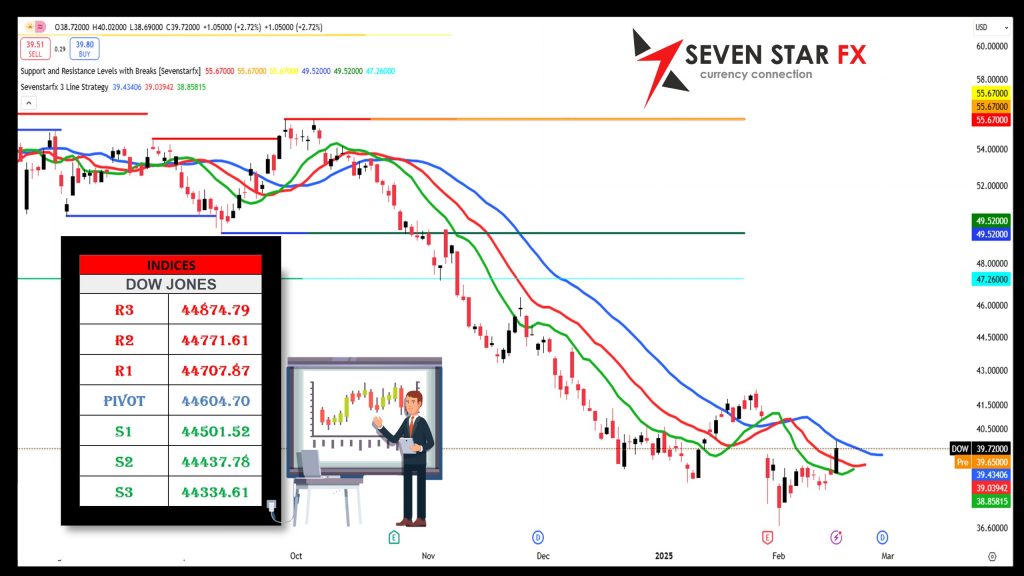
The Dow Jones Industrial Average (DJIA) is trading around the 44,604.70 pivot level, with investors closely monitoring Federal Reserve policy signals, corporate earnings, and bond yields. The market remains in a consolidation phase, awaiting a catalyst for the next breakout.
- Current Price: 44,604.70 (Pivot)
- Daily Range: 44,334.61 – 44,874.79
📊 Resistance & Support Levels:
✅ R3: 44,874.79 | R2: 44,771.61 | R1: 44,707.87
✅ Pivot Point: 44,604.70
✅ S1: 44,501.52 | S2: 44,437.78 | S3: 44,334.61
🔍 FUNDAMENTAL ANALYSIS
🇺🇸 US ECONOMIC FACTORS IMPACTING DOW JONES (DJIA)
📌 Federal Reserve Policy & Interest Rate Outlook:
- The FOMC minutes release is expected to provide further clues on rate cut timing, with markets currently pricing in a potential first cut in Q3 2025.
- If the Fed signals a delay, stocks may face downward pressure, pushing the Dow toward S1 (44,501.52).
📌 US Treasury Yields & Inflation Data:
- The 10-year Treasury yield at 4.56% remains a key factor in stock market movement.
- If yields rise further, equities could see selling pressure, particularly in high-growth tech stocks.
📌 Corporate Earnings & Market Sentiment:
- Several major Dow components are set to report earnings, which could impact index performance.
- Stronger-than-expected earnings may drive the Dow toward 44,874.79 (R3).
🌍 GLOBAL MARKET FACTORS IMPACTING DJIA
📌 Geopolitical Risks & Trade Uncertainty:
- Concerns over US-China trade tensions and geopolitical instability in Eastern Europe remain key market risks.
📌 Commodities & Oil Prices:
- Rising oil prices could put pressure on industrial stocks, while strong commodity demand may benefit energy & materials sectors.
📌 US Labor Market & Consumer Spending:
- Retail sales & job market strength will influence market sentiment, with any slowdown raising concerns over economic growth.
📉 TECHNICAL ANALYSIS: DOW JONES TESTING CRITICAL LEVELS
🔹 Fibonacci Retracement Levels (Based on Recent Highs & Lows)
- 23.6% – 44,500.00 (Minor Support)
- 38.2% – 44,600.00 (Key Pivot Zone)
- 50.0% – 44,700.00 (Mid-Level Resistance)
- 61.8% – 44,800.00 (Breakout Level)
- 78.6% – 44,900.00 (Upside Target)
📌 A move above 44,800 (61.8% Fib) could trigger a bullish breakout toward 44,874.79 (R3).
📌 Failure to hold 44,500 (23.6% Fib) may push the Dow toward 44,334.61 (S3).
📐 GANN THEORY ANALYSIS
According to Gann’s time cycle theory, the Dow is approaching a critical inflection point, where a breakout above 44,707.87 may confirm continued bullish momentum.
📌 Key Gann Angles:
- Bullish Scenario: If the Dow breaks 44,771.61 (R2), it could continue toward 44,900+.
- Bearish Scenario: A failure to hold 44,501.52 (S1) could lead to a decline toward 44,334.61 (S3).
📊 ELLIOTT WAVE ANALYSIS: DOW IN WAVE 4 CONSOLIDATION?
The Dow appears to be in a Wave 4 correction, suggesting a possible Wave 5 rally if support holds.
📌 Wave Count:
1️⃣ Wave 1: Rally toward 44,771.61 (R2)
2️⃣ Wave 2: Pullback to 44,500.00 (S1)
3️⃣ Wave 3: Attempt to test 44,874.79 (R3)
4️⃣ Wave 4: Sideways consolidation near 44,604.70 (Pivot)
5️⃣ Wave 5 (Pending): Potential surge above 44,900+ if momentum holds.
📌 TRADING STRATEGY & OUTLOOK
🔹 Bullish Case (Above 44,800 – 61.8% Fib)
✅ Buy DJIA if it breaks above 44,800, targeting 44,900+.
✅ Stop Loss: Below 44,600 (Pivot Level).
🔹 Bearish Case (Below 44,500 – Support Breakdown)
❌ Sell DJIA below 44,500, targeting 44,334 (S3).
❌ Stop Loss: Above 44,700.
🏆 FINAL OUTLOOK: SLIGHTLY BULLISH BIAS
📈 Short-term Bias: Neutral, with a slightly bullish inclination if the Dow stays above 44,604.70.
📉 Medium-term Trend: If the Dow breaks below 44,500, expect a move toward 44,334.61.
📌 Key Watch: US economic data, corporate earnings, and Fed policy signals for further market direction.
👉 Traders should monitor a breakout above 44,800 for bullish confirmation or a drop below 44,500 for a bearish continuation. 🚀📊
Disclaimer
This analysis is for educational purposes only. Bitcoin trading is highly volatile and carries significant risks. Always use proper risk and money management strategies, as trading without them can result in substantial financial loss.
BTC/USD DAILY MARKET ANALYSIS REPORT
📈 DAILY BITCOIN (BTC/USD) MARKET ANALYSIS – FEBRUARY 19, 2025
🔹 OVERVIEW: BITCOIN CONSOLIDATES NEAR $95,271 AS BULLS DEFEND SUPPORT
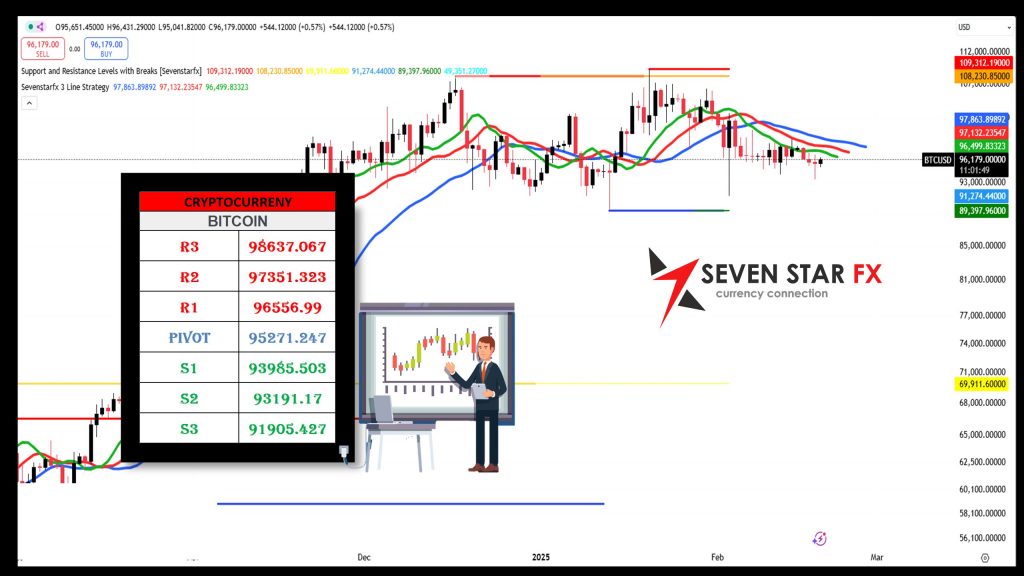
Bitcoin (BTC/USD) is currently trading around the $95,271 pivot level, as investors monitor institutional inflows, US regulatory developments, and macroeconomic trends. The cryptocurrency market remains bullish in the long run, but short-term consolidation could lead to a breakout or correction depending on upcoming catalysts.
- Current Price: $95,271 (Pivot)
- Daily Range: $91,905 – $98,637
📊 Resistance & Support Levels:
✅ R3: $98,637 | R2: $97,351 | R1: $96,556
✅ Pivot Point: $95,271
✅ S1: $93,985 | S2: $93,191 | S3: $91,905
🔍 FUNDAMENTAL ANALYSIS
🌎 GLOBAL FACTORS IMPACTING BITCOIN
📌 Institutional Demand & Bitcoin ETFs:
- Institutional inflows into Bitcoin ETFs remain strong, boosting long-term demand.
- Any increase in BTC ETF adoption by major funds may push Bitcoin toward $100K+.
📌 US Interest Rates & Federal Reserve Outlook:
- The FOMC minutes release will impact risk assets, including Bitcoin.
- A delayed Fed rate cut could strengthen the US Dollar, leading to short-term Bitcoin selling pressure.
📌 Macroeconomic Risks & Market Sentiment:
- Stock market performance influences BTC, with higher risk appetite favoring crypto investments.
- Geopolitical tensions in Eastern Europe & the Middle East could increase BTC’s safe-haven demand.
📌 Regulatory Developments:
- The SEC’s stance on Bitcoin & crypto regulations will play a role in BTC’s trajectory.
- Any positive regulatory news could trigger a rally toward $98,637 (R3).
📉 TECHNICAL ANALYSIS: BITCOIN TESTING KEY RESISTANCE LEVELS
🔹 Fibonacci Retracement Levels (Based on Recent Highs & Lows)
- 23.6% – $94,500 (Minor Support)
- 38.2% – $95,500 (Key Pivot Zone)
- 50.0% – $96,000 (Critical Resistance)
- 61.8% – $96,800 (Breakout Level)
- 78.6% – $97,800 (Upside Target)
📌 A move above $96,800 (61.8% Fib) could trigger a bullish breakout toward $98,637 (R3).
📌 Failure to hold $94,500 (23.6% Fib) may push BTC toward $93,191 (S2).
📐 GANN THEORY ANALYSIS
Gann’s time cycle analysis suggests that Bitcoin is nearing a breakout phase, with $96,000+ as a key upside trigger.
📌 Key Gann Angles:
- Bullish Scenario: If BTC/USD breaks $96,800, it could rally toward $100,000.
- Bearish Scenario: A failure to hold $93,985 (S1) could see Bitcoin retest $91,905 (S3).
📊 ELLIOTT WAVE ANALYSIS: BITCOIN IN A WAVE 5 EXTENSION?
Bitcoin appears to be in a Wave 4 correction, with a potential Wave 5 breakout if it holds above $95,000.
📌 Wave Count:
1️⃣ Wave 1: Rally toward $97,351 (R2)
2️⃣ Wave 2: Pullback to $93,985 (S1)
3️⃣ Wave 3: Surge to $98,637 (R3)
4️⃣ Wave 4: Sideways consolidation near $95,271 (Pivot)
5️⃣ Wave 5 (Pending): Breakout above $100K if resistance is cleared.
📌 TRADING STRATEGY & OUTLOOK
🔹 Bullish Case (Above $96,800 – 61.8% Fib)
✅ Buy BTC above $96,800, targeting $98,637 (R3) and $100K.
✅ Stop Loss: Below $94,500 (23.6% Fib).
🔹 Bearish Case (Below $93,985 – S1 Level)
❌ Sell BTC below $93,985, targeting $93,191 (S2) and $91,905 (S3).
❌ Stop Loss: Above $95,500.
🏆 FINAL OUTLOOK: SLIGHTLY BULLISH BIAS
📈 Short-term Bias: Neutral-to-bullish as long as BTC holds above $95,000.
📉 Medium-term Trend: If BTC breaks below $93,985, expect a move toward $91,905.
📌 Key Watch: US Fed policy, ETF inflows, and macroeconomic sentiment for further Bitcoin movement.
👉 Traders should monitor a breakout above $96,800 for bullish confirmation or a drop below $93,985 for a bearish continuation. 🚀📊
Disclaimer
This analysis is for educational purposes only. Bitcoin trading is highly volatile and carries significant risks. Always use proper risk and money management strategies, as trading without them can result in substantial financial loss.
————————————————————————————————————————————————————————————————————————————-
Notice: The data presented is derived from technical analysis and does not constitute financial advice. For those trading in forex, consulting a qualified financial advisor prior to making investment decisions is strongly recommended.
Caution: The information above reflects ongoing technical analysis and should not be interpreted as financial advice. Forex trading involves high volatility, and without proper knowledge, you risk losing all your capital. It is essential to consult with a financial advisor before investing.
Advisory: The insights shared are the result of technical analysis and are not intended as financial advice. Forex traders should seek advice from professional financial advisors before making any investment decisions. Remember, the forex market is highly volatile, and trading without adequate knowledge can lead to significant losses.
Important: The analysis provided is for informational purposes only and should not be seen as financial advice. Forex trading carries substantial risks, and it is advisable to consult financial advisors before proceeding with any investments. This content is intended solely for Wealth Management Education purposes.