Market Wrap: Stocks, Bonds, Commodities
Most Asian currencies moved little on Monday, while the dollar steadied from a tumble from over two-year highs after soft U.S. inflation data spurred some hopes that interest rates will still fall in 2025.
The Dow Jones Industrial Average rose 498.02 points to 42,840.26, the S&P 500 gain 1.09% to 5,930.85 and the Nasdaq Composite up 199.83 points to 19,572.60.
MSCI’s index of Asia-Pacific stocks outside Japan is down 0.01% to 707.25 levels. The Australian index was higher by 1.67% to 8,201.60. Japanese Nikkei Index increase 1.16% today.
European stocks were negative on Monday, with the Stoxx Europe 50 Index decrease 0.38% to 4,860.55 Germany’s DAX descend 0.43% to 19,884.75, and France’s CAC lower 0.27% to 7,274.48 and U.K.’s FTSE 100 loss 0.26% to 8,084.61.
Benchmark 10-year U.S. Treasury rose as demand for safe assets slipped again, today 10-year bond yields 0.04% to 4.5250.
Oil prices rose on Monday as lower-than-expected U.S. inflation data revived hopes for further policy easing, although the outlook for a supply surplus next year weighed on the market.
Spot Brent crude oil increase 0.45% to $72.89 per barrel. US West Texas Intermediate crude is increase 0.35% to $69.81 a barrel.
The yellow metal gold is down 0.03% to 2,644.36 dollars per ounce.
Market Wrap: Forex
The dollar recently notched fresh year-to-date highs against its rivals and is likely to remain strong after the Federal Reserve leaned more hawkish at its recent December meeting, analysts from UBS said in a recent note.
Today, the U.S. dollar index measures the Greenback against a trade-weighted basket of six major currencies, which either ascend 0.22% to 107.585.
The Euro US Dollar (EUR/USD) is a widely traded is up 0.05% today. This left the pair trading around $1.04340.
The Japanese yen was will move positive against the U.S. dollar on Monday. Today USD/JPY is trades pair that increase 0.24% to the 156.79 level.
Another commodity-related currency positive against the U.S dollar, AUD/USD gain 0.02% to 0.62510, and NZD/USD increase 0.02% to 0.56520 level.
EUR/USD Intraday: Trend on the upside
Our pivot point is at 1.04330
Preferable Price Action: Take buy positions above pivot level with targets at 1.04550 & 1.04750 in extension.
Alternative Price Action: Sell pivot looks for a further downside to 1.04110 & 1.03900.
Comment: RSI is above 50 levels.
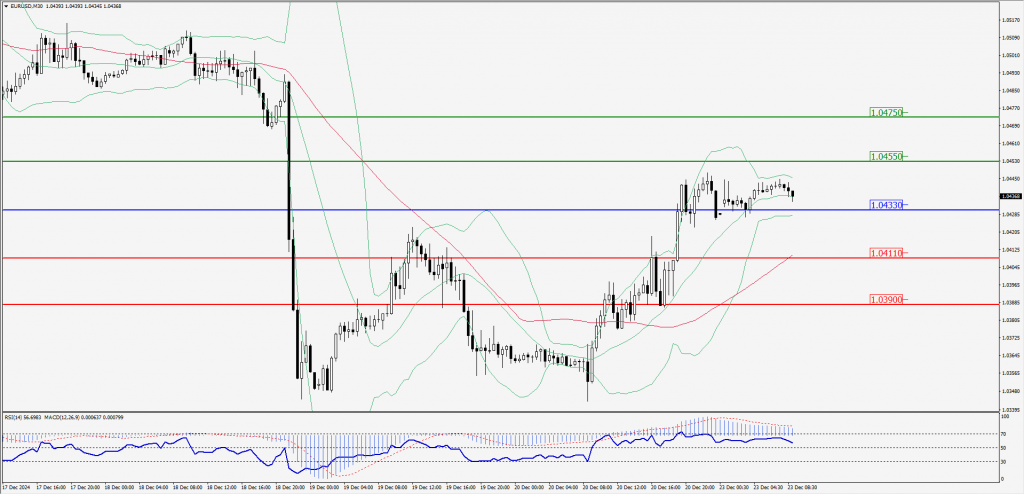
Green Lines Indicate Resistance Levels – Red Lines Indicate Support Levels
Light Blue is a Pivot Point – Black represents the price when the report was produced
GBP/USD Intraday: Trend on the downside
Our pivot point is at 1.25820
Preferable Price Action: Sell positions below pivot with targets at 1.25490 & 1.25190 in extension.
Alternative Price Action: The price above pivot would call for further upside to 1.26140 & 1.26460.
Comment: RSI is below 50 levels and pairs below its 20MA.
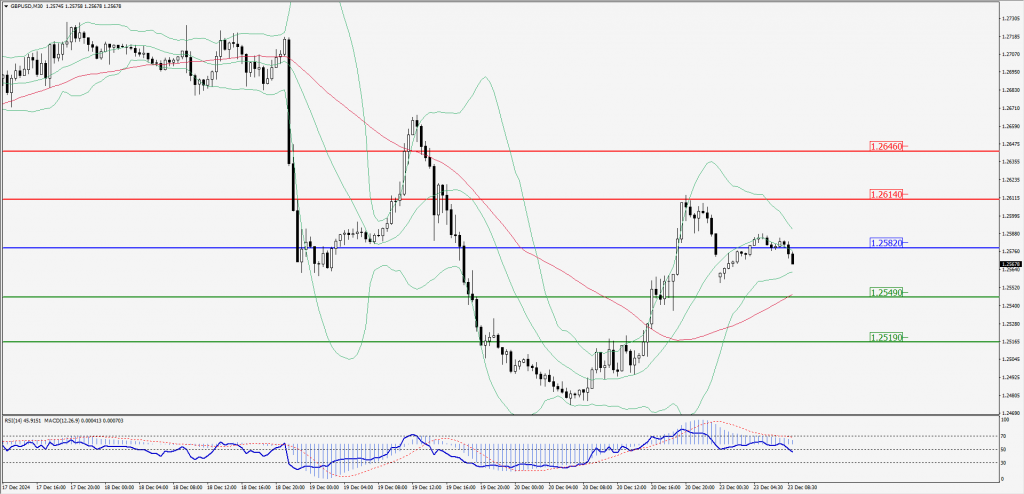
Green Lines Indicate Resistance Levels – Red Lines Indicate Support Levels
Light Blue is a Pivot Point – Black represents the price when the report was produced
USD/JPY Intraday: Trend on the upside
Our pivot point is at 156.480
Preferable Price Action: Buy position above pivot with the target at 157.250 and 157.930 in extension.
Alternative Price Action: The downside breakout of the pivot would call for 155.780 and 155.080.
Comment: MACD is above 50 levels and pairs above its 20MA.
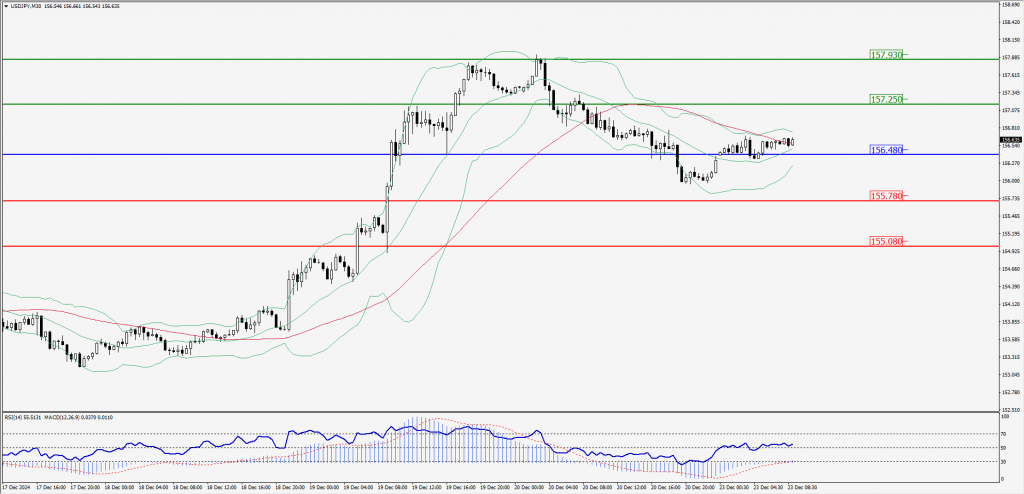
Green Lines Indicate Resistance Levels – Red Lines Indicate Support Levels
Light Blue is a Pivot Point – Black represents the price when the report was produced
AUD/USD Intraday: Trend on the upside
Our pivot point is at 0.62520
Preferable Price Action: Buy positions above pivot with targets at 0.62740 & 0.62930 in extension.
Alternative Price Action: Below pivot a further downside with 0.62300 & 0.62110 as targets.
Comment: RSI is above 50 levels and pairs above its 20MA & 55MA.
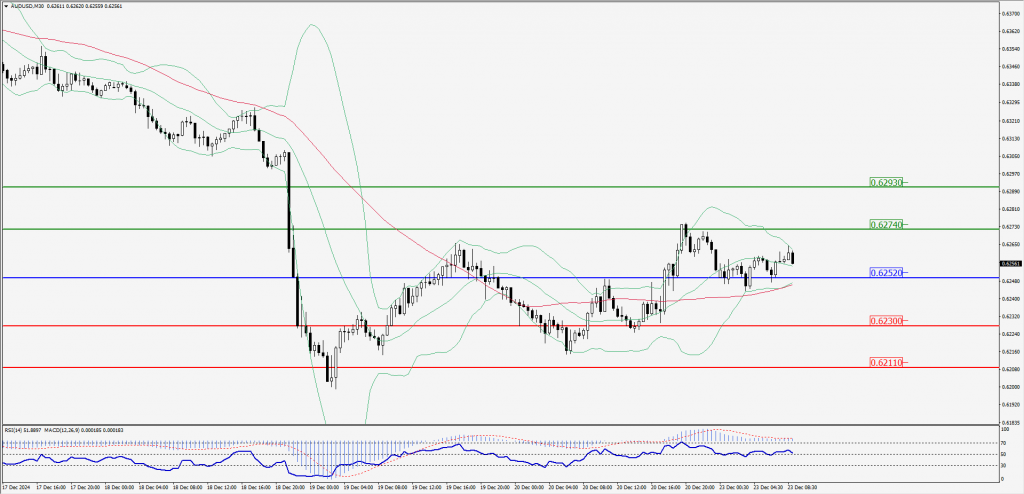
Green Lines Indicate Resistance Levels – Red Lines Indicate Support Levels
Light Blue is a Pivot Point – Black represents the price when the report was produced
CRUDEOIL Intraday: Trend on the upside
Our pivot point is at 69.71
Preferable Price Action: Above pivot buy oil with 69.97 & 70.22 as targets.
Alternative Price Action: Sell crude below pivot with targets at 69.44 & 69.19 in extension.
Comment: RSI is at above 50 levels and pairs above its 55MA & 20MA.
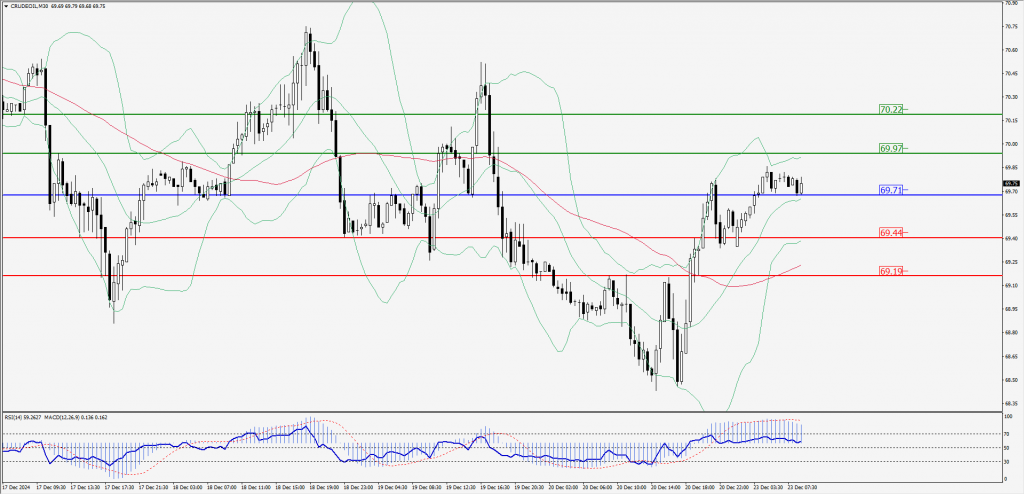
Green Lines Indicate Resistance Levels – Red Lines Indicate Support Levels
Light Blue is a Pivot Point – Black represents the price when the report was produced
XAU/USD Intraday: Major trend on the upside
Our pivot point is at 2628.70
Preferable Price Action: Further upside to 2638.80 and 2647.70.
Alternative Price Action: If the price gives an downside breakout of a pivot, then the price extends to 2618.50 and 2609.80.
Comment: MACD is above 50 levels and pairs above its 20MA & 55MA.
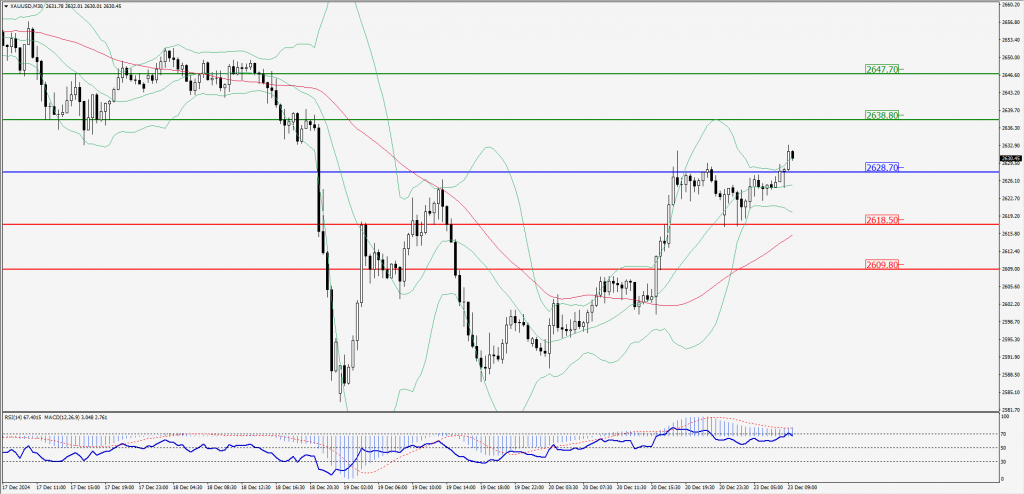
Green Lines Indicate Resistance Levels – Red Lines Indicate Support Levels
Light Blue is a Pivot Point – Black represents the price when the report was produced
Dow Jones Intraday: Trend on the upside
Our pivot point is 42,957.70
Preferable Price Action: Take buy positions above the pivot with targets at 43,173.70 & 43,371.30.
Alternative Price Action: Below 42,957.70 looks for further downside to 42,744.00 & 42,555.60.
Comment: RSI is above 50 levels and pairs above its 55MA & 20MA.
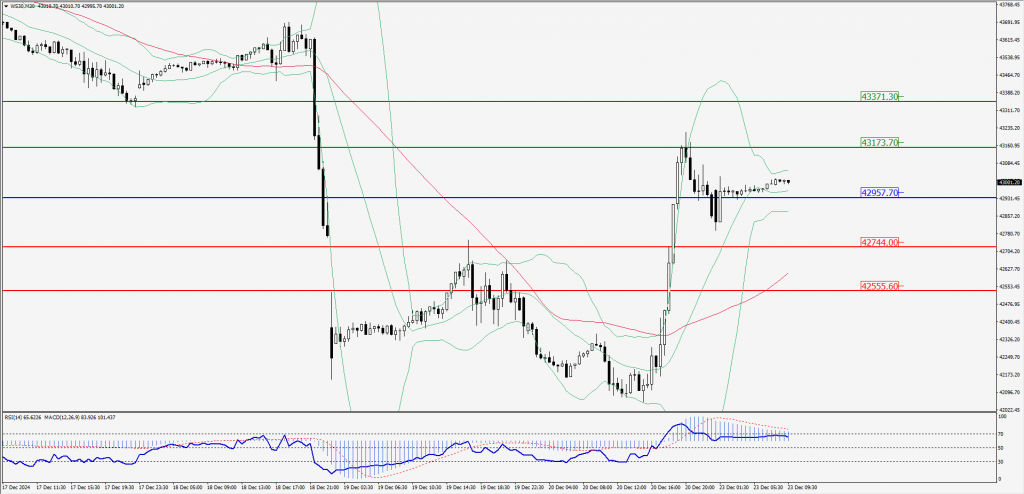
Green Lines Indicate Resistance Levels – Red Lines Indicate Support Levels
Light Blue is a Pivot Point – Black represents the price when the report was produced