Market Wrap: Stocks, Bonds, Commodities
Most Asian currencies weakened on Thursday, with the yen hitting a near one-month low after the Bank of Japan kept interest rates steady and flagged a cautious outlook.
The Dow Jones Industrial Average fail 1123.03 points to 42,326.87, the S&P 500 loss 2.95% to 5,872.16 and the Nasdaq Composite down 716.37 points to 19,392.69.
MSCI’s index of Asia-Pacific stocks outside Japan is down 0.85% to 707.59 levels. The Australian index was lower by 1.70% to 8,168.20. Japanese Nikkei Index decrease 0.80% today.
European stocks were negative on Thursday, with the Stoxx Europe 50 Index decrease 1.33% to 4,891.45 Germany’s DAX descend 0.94% to 20,069.55, and France’s CAC lower 1.23% to 7,293.73 and U.K.’s FTSE 100 loss 1.17% to 8,103.00.
Benchmark 10-year U.S. Treasury rose as demand for safe assets slipped again, today 10-year bond yields 0.60% to 4.5280.
Oil prices fell in Asian trade on Thursday after the U.S. Federal Reserve signalled it would slow the pace of interest rate cuts in 2025, which could slow economic growth and reduce fuel demand.
Spot Brent crude oil decrease 0.74% to $72.85 per barrel. US West Texas Intermediate crude is decrease 1.69% to $69.39 a barrel.
The yellow metal gold is down 0.92% to 2,628.99 dollars per ounce.
Market Wrap: Forex
The Japanese yen weakened beyond the significant 155 mark against the U.S. dollar on Thursday after the country’s central bank kept interest rates unchanged.
Today, the U.S. dollar index measures the Greenback against a trade-weighted basket of six major currencies, which either descend 0.02% to 107.730.
The Euro US Dollar (EUR/USD) is a widely traded is up 0.48% today. This left the pair trading around $1.04020.
The Japanese yen was will move positive against the U.S. dollar on Thursday. Today USD/JPY is trades pair that increase 1.09% to the 156.48 level.
Another commodity-related currency positive against the U.S dollar, AUD/USD gain 0.31% to 0.62360, and NZD/USD increase 0.36% to 0.56430 level.
EUR/USD Intraday: Trend on the downside
Our pivot point is at 1.03940
Preferable Price Action: Take sell positions below pivot level with targets at 1.03690 & 1.03470 in extension.
Alternative Price Action: Buy pivot looks for a further upside to 1.04180 & 1.04400.
Comment: RSI is below 50 levels and pairs below its 55MA.
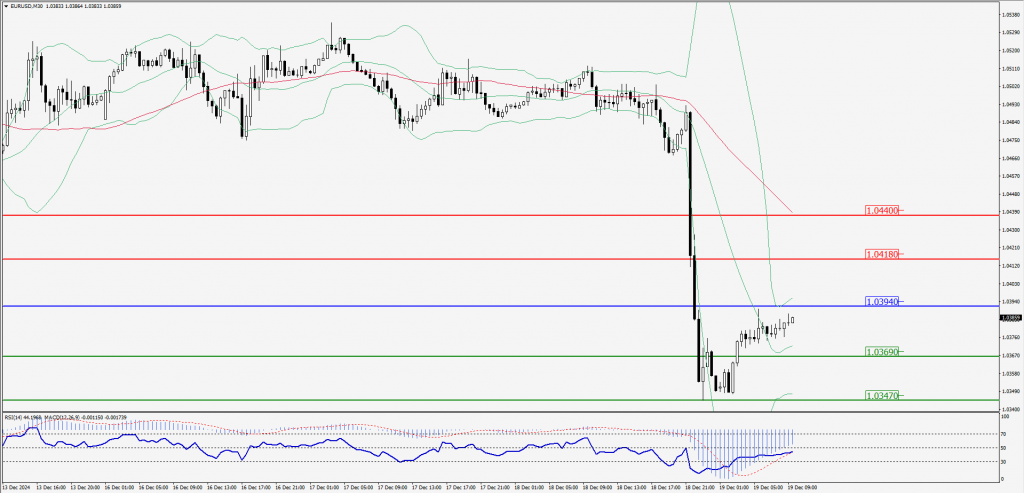
Green Lines Indicate Resistance Levels – Red Lines Indicate Support Levels
Light Blue is a Pivot Point – Black represents the price when the report was produced
GBP/USD Intraday: Trend on the downside
Our pivot point is at 1.26010
Preferable Price Action: Sell positions below pivot with targets at 1.25770 & 1.25580 in extension.
Alternative Price Action: The price above pivot would call for further upside to 1.26250 & 1.26440.
Comment: RSI is below 50 levels and pairs below its 55MA.
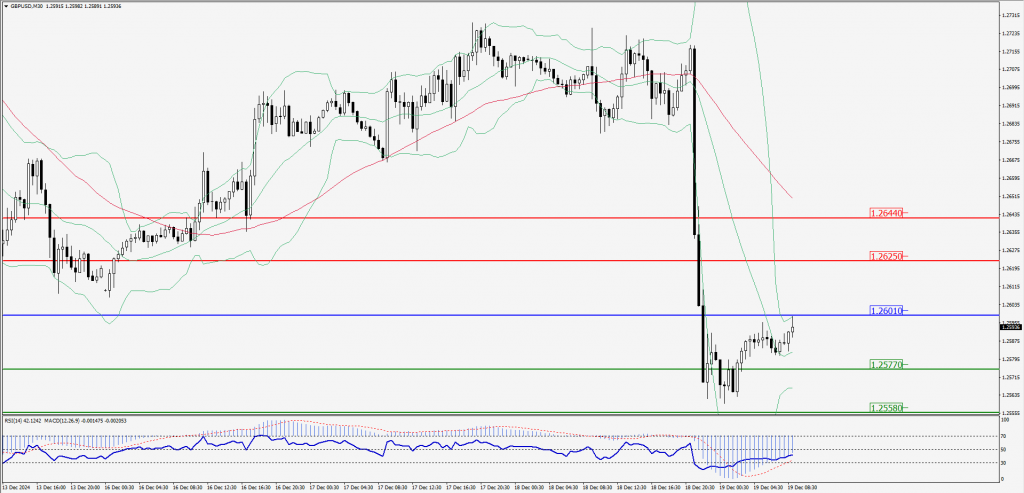
Green Lines Indicate Resistance Levels – Red Lines Indicate Support Levels
Light Blue is a Pivot Point – Black represents the price when the report was produced
USD/JPY Intraday: Major trend on the upside
Our pivot point is at 155.780
Preferable Price Action: Buy position above pivot with the target at 156.290 and 156.730 in extension.
Alternative Price Action: The downside breakout of the pivot would call for 155.290 and 154.850.
Comment: MACD is above 50 levels and pairs above its 55MA & 20MA.
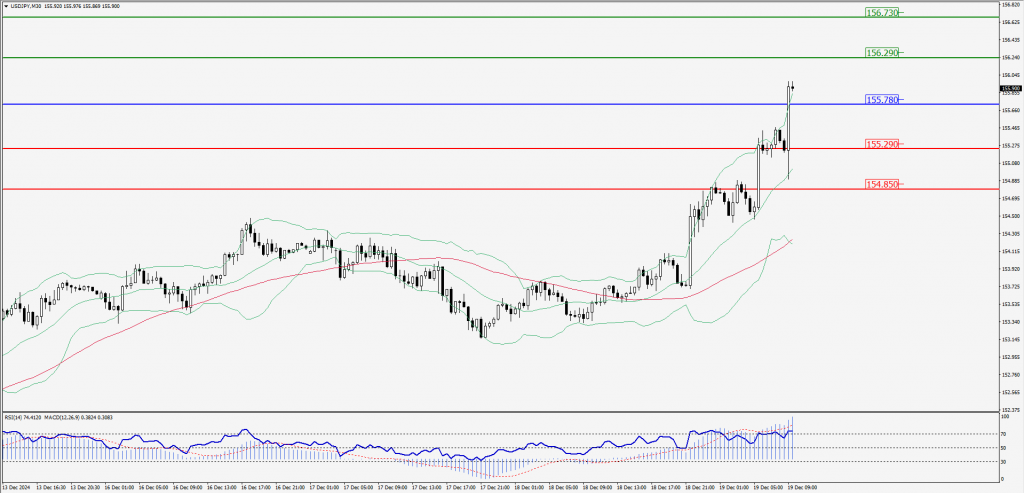
Green Lines Indicate Resistance Levels – Red Lines Indicate Support Levels
Light Blue is a Pivot Point – Black represents the price when the report was produced
AUD/USD Intraday: Trend on the downside
Our pivot point is at 0.62370
Preferable Price Action: Sell positions below pivot with targets at 0.62170 & 0.61980 in extension.
Alternative Price Action: Above pivot a further upside with 0.62580 & 0.62780 as targets.
Comment: RSI is below 50 levels and pairs below its 55MA.
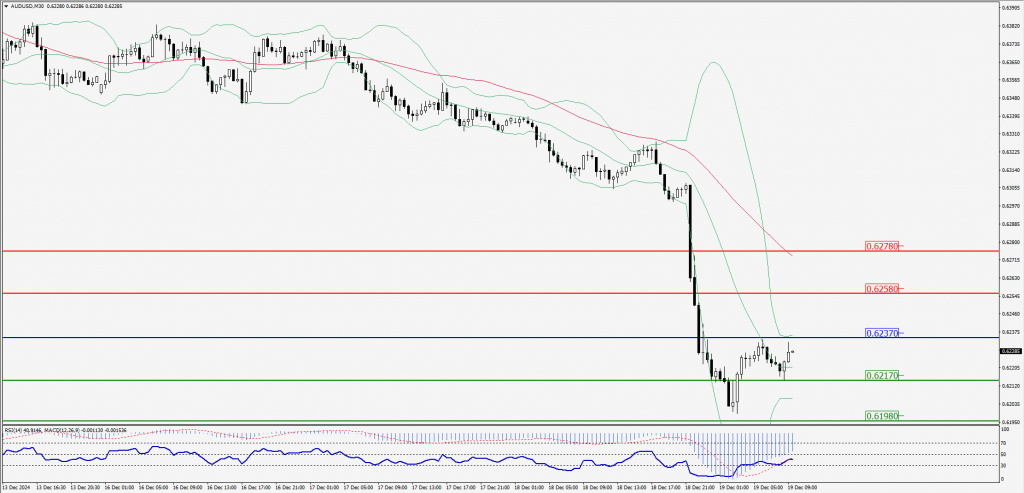
Green Lines Indicate Resistance Levels – Red Lines Indicate Support Levels
Light Blue is a Pivot Point – Black represents the price when the report was produced
CRUDEOIL Intraday: Trend on the upside
Our pivot point is at 69.69
Preferable Price Action: Above pivot buy oil with 69.96 & 70.23 as targets.
Alternative Price Action: Sell crude above pivot with targets at 69.44 & 69.19 in extension.
Comment: RSI is at above 50 levels and pairs above its 20MA.
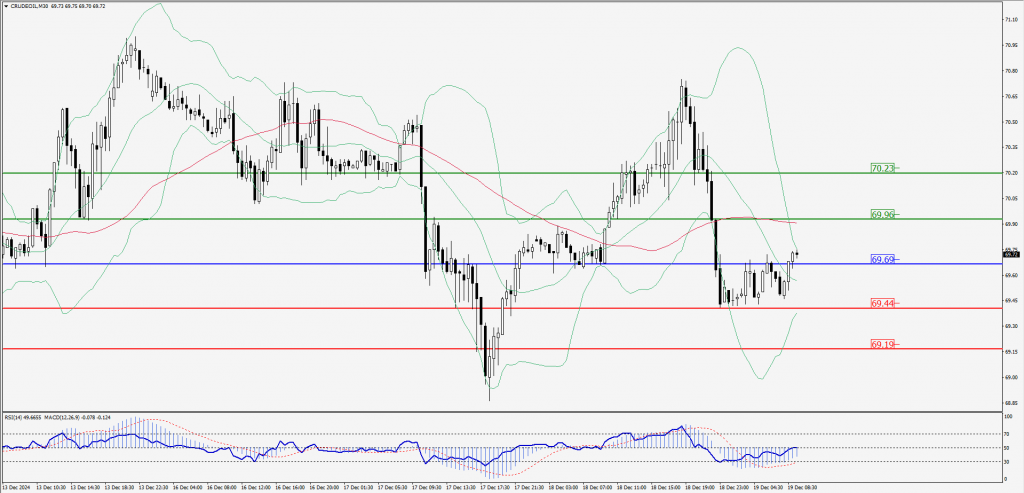
Green Lines Indicate Resistance Levels – Red Lines Indicate Support Levels
Light Blue is a Pivot Point – Black represents the price when the report was produced
XAU/USD Intraday: Trend on the downside
Our pivot point is at 2617.50
Preferable Price Action: Further downside to 2603.70 and 2591.90.
Alternative Price Action: If the price gives an upside breakout of a pivot, then the price extends to 2631.70 and 2642.90.
Comment: MACD is below 50 levels and pairs below its 55MA.
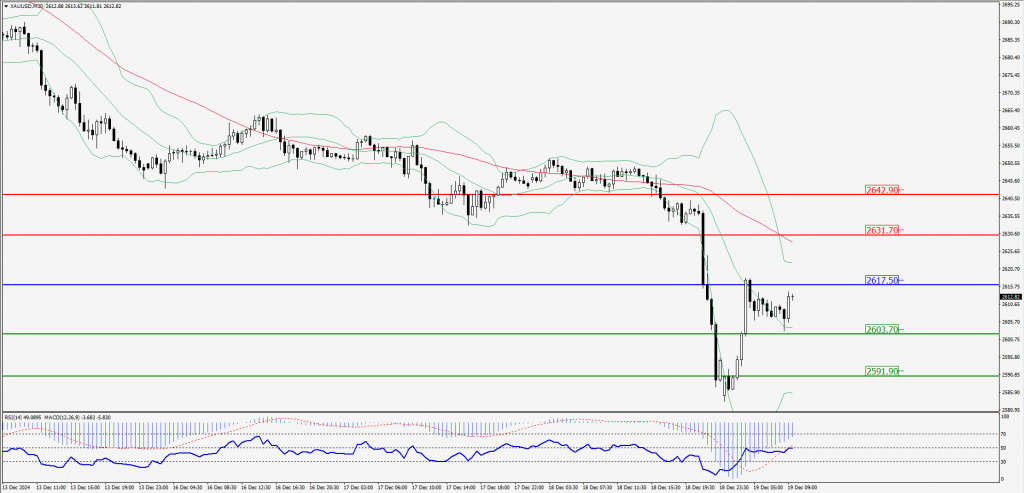
Green Lines Indicate Resistance Levels – Red Lines Indicate Support Levels
Light Blue is a Pivot Point – Black represents the price when the report was produced
Dow Jones Intraday: Major trend on the downside
Our pivot point is 42,441.90
Preferable Price Action: Take sell positions below the pivot with targets at 42,202.90 & 42,003.80.
Alternative Price Action: Above 42,441.90 looks for further upside to 42,690.10 & 42,926.00.
Comment: RSI is below 50 levels and pairs below its 20MA & 55MA.
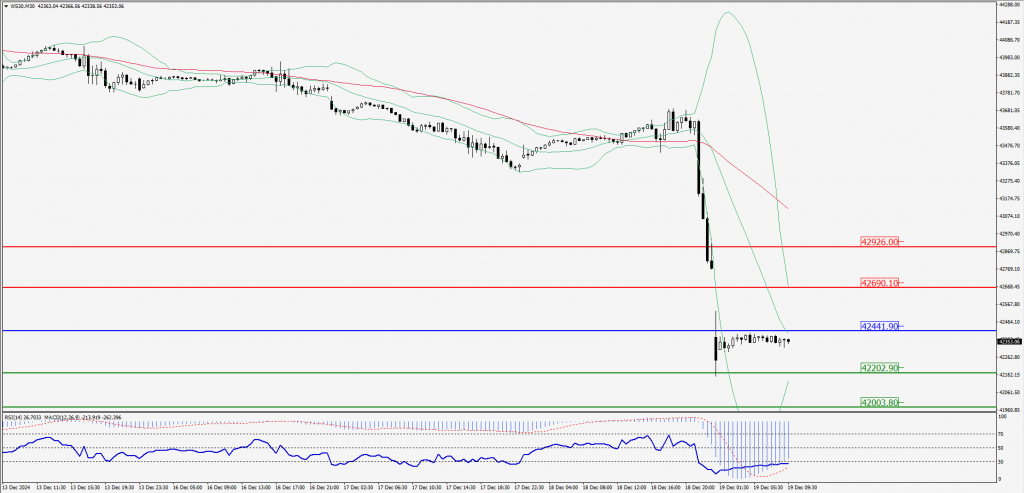
Green Lines Indicate Resistance Levels – Red Lines Indicate Support Levels
Light Blue is a Pivot Point – Black represents the price when the report was produced