Market Wrap: Stocks, Bonds, Commodities
Most Asian currencies inched higher on Tuesday as investors cheered signals of more stimulus measures from China, while the Australian dollar fell sharply after the country’s central bank held rates steady and struck a less hawkish chord.
The Dow Jones Industrial Average fail 240.59 points to 44,401.93, the S&P 500 loss 0.61% to 6,052.85 and the Nasdaq Composite down 123.08 points to 19,736.69.
MSCI’s index of Asia-Pacific stocks outside Japan is up 0.78% to 726.79 levels. The Australian index was lower by 0.36% to 8,393.00. Japanese Nikkei Index increase 0.55% today.
European stocks were mixed on Tuesday, with the Stoxx Europe 50 Index increase 0.15% to 4,985.15 Germany’s DAX descend 0.19% to 20,345.96, and France’s CAC higher 0.72% to 7,480.14 and U.K.’s FTSE 100 gain 0.52% to 8,352.08.
Benchmark 10-year U.S. Treasury fail as demand for safe assets slipped again, today 10-year bond yields 0.31% to 4.1870.
Oil prices slipped on Tuesday as concerns eased about the fallout from Syrian President Bashar al-Assad’s overthrow, but the market found support in China’s vow to ramp up policy stimulus, which could boost the top global crude buyer’s demand.
Spot Brent crude oil decrease 0.37% to $71.87 per barrel. US West Texas Intermediate crude is decrease 0.47% to $68.05 a barrel.
The yellow metal gold is up 0.24% to 2,692.21 dollars per ounce.
Market Wrap: Forex
South Korea’s central bank governor said it was difficult for the dollar-won exchange rate to return to levels seen in the past, the Yonhap news agency reported on Tuesday.
Today, the U.S. dollar index measures the Greenback against a trade-weighted basket of six major currencies, which either descend 0.05% to 105.765.
The Euro US Dollar (EUR/USD) is a widely traded is up 0.11% today. This left the pair trading around $1.05640.
The Japanese yen was will move positive against the U.S. dollar on Tuesday. Today USD/JPY is trades pair that increase 0.01% to the 151.21 level.
Another commodity-related currency negative against the U.S dollar, AUD/USD loss 0.58% to 0.64000, and NZD/USD decrease 0.49% to 0.58340 level.
EUR/USD Intraday: Trend on the upside
Our pivot point is at 1.05610
Preferable Price Action: Take buy positions above pivot level with targets at 1.05820 & 1.06010 in extension.
Alternative Price Action: Sell pivot looks for a further downside to 1.05410 & 1.05230.
Comment: RSI is above 50 levels and pairs above its 55MA & 20MA.
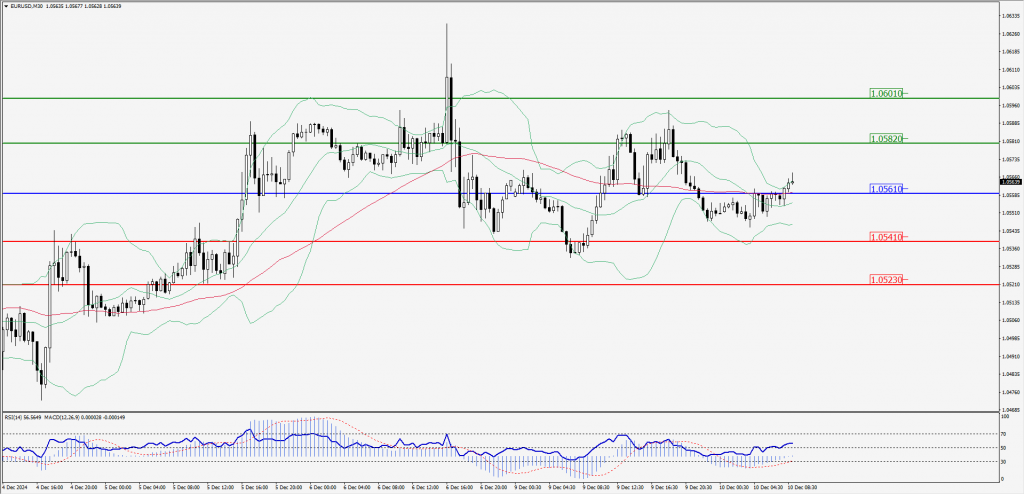
Green Lines Indicate Resistance Levels – Red Lines Indicate Support Levels
Light Blue is a Pivot Point – Black represents the price when the report was produced
GBP/USD Intraday: Trend on the upside
Our pivot point is at 1.27550
Preferable Price Action: Buy positions above pivot with targets at 1.27760 & 1.27960 in extension.
Alternative Price Action: The price below pivot would call for further downside to 1.27350 & 1.27170.
Comment: RSI is above 50 levels and pairs above its 20MA & 55MA.
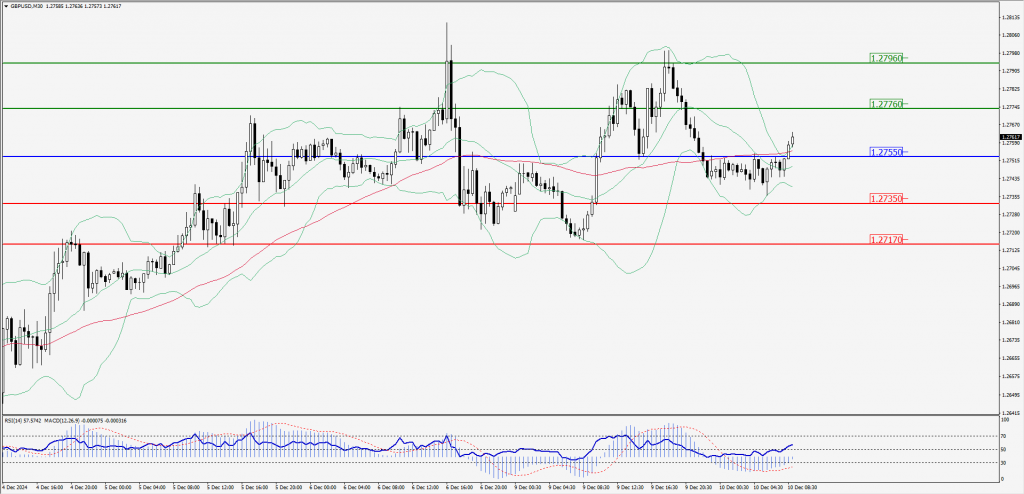
Green Lines Indicate Resistance Levels – Red Lines Indicate Support Levels
Light Blue is a Pivot Point – Black represents the price when the report was produced
USD/JPY Intraday: Trend on the upside
Our pivot point is at 151.180
Preferable Price Action: Buy position above pivot with the target at 151.410 and 151.620 in extension.
Alternative Price Action: The downside breakout of the pivot would call for 150.960 and 150.740.
Comment: MACD is above 50 levels and pairs above its 55MA.
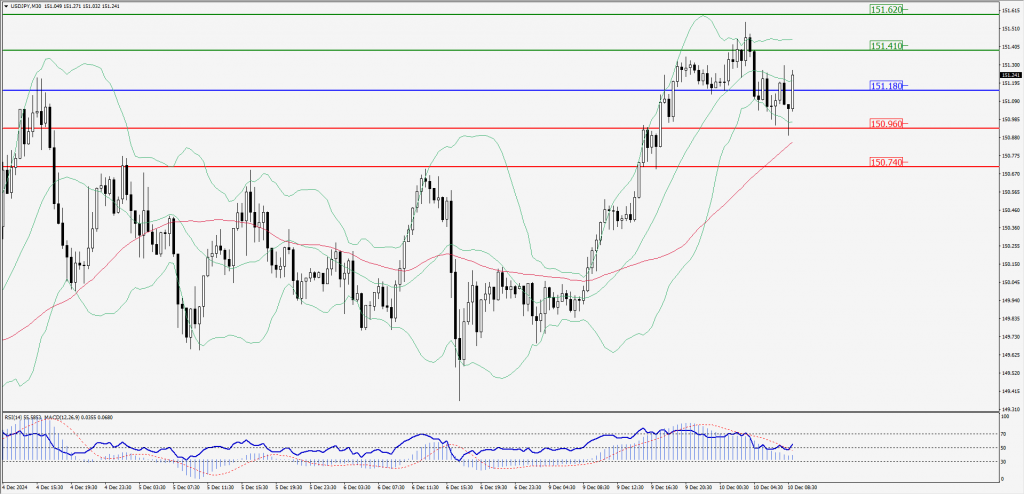
Green Lines Indicate Resistance Levels – Red Lines Indicate Support Levels
Light Blue is a Pivot Point – Black represents the price when the report was produced
AUD/USD Intraday: Trend on the downside
Our pivot point is at 0.64030
Preferable Price Action: Sell positions below pivot with targets at 0.63900 & 0.63790 in extension.
Alternative Price Action: Above pivot a further upside with 0.64160 & 0.64270 as targets.
Comment: RSI is below 50 levels and pairs below its 55MA & 20MA.
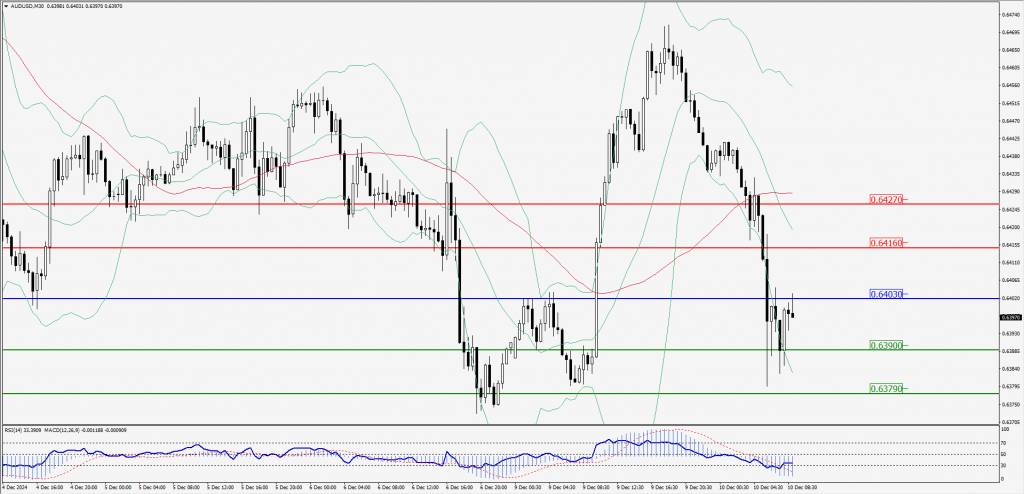
Green Lines Indicate Resistance Levels – Red Lines Indicate Support Levels
Light Blue is a Pivot Point – Black represents the price when the report was produced
CRUDEOIL Intraday: Trend on the downside
Our pivot point is at 68.02
Preferable Price Action: Below pivot sell oil with 67.59 & 67.19 as targets.
Alternative Price Action: Buy crude above pivot with targets at 68.46 & 68.81 in extension.
Comment: RSI is at below 50 levels and pairs below its 55MA & 20MA.
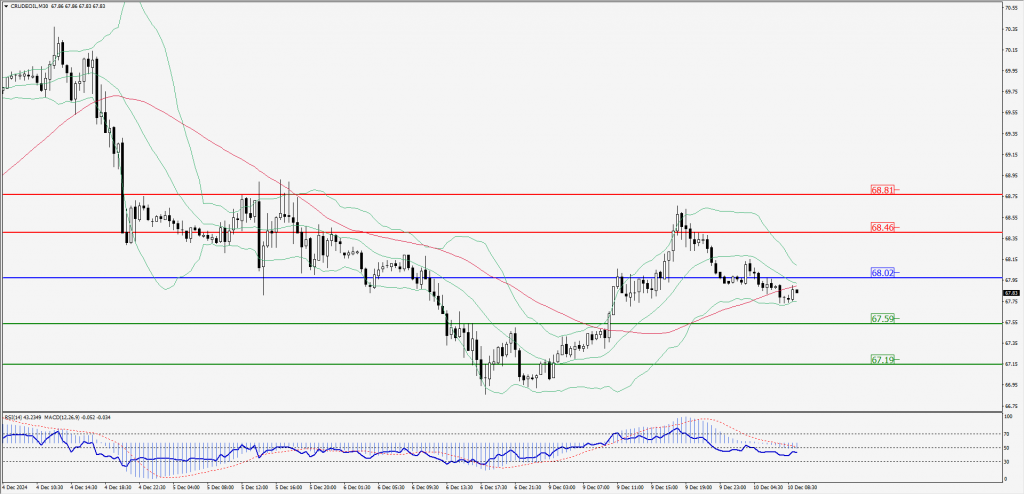
Green Lines Indicate Resistance Levels – Red Lines Indicate Support Levels
Light Blue is a Pivot Point – Black represents the price when the report was produced
XAU/USD Intraday: Trend on the upside
Our pivot point is at 2666.30
Preferable Price Action: Further upside to 2674.00 and 2680.80.
Alternative Price Action: If the price gives an downside breakout of a pivot, then the price extends to 2659.40 and 2652.80.
Comment: MACD is above 50 levels and pairs above its 20MA & 55MA.
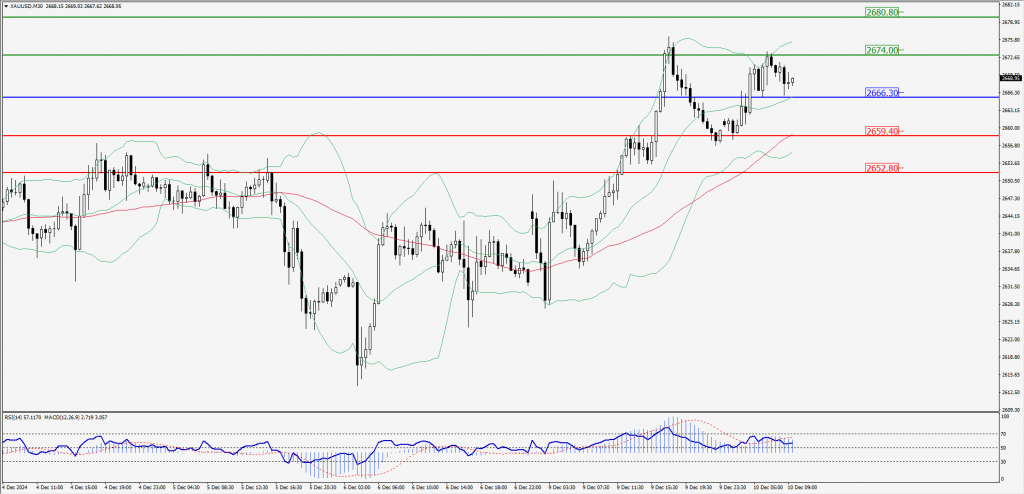
Green Lines Indicate Resistance Levels – Red Lines Indicate Support Levels
Light Blue is a Pivot Point – Black represents the price when the report was produced
Dow Jones Intraday: Trend on the downside
Our pivot point is 44,450.80
Preferable Price Action: Take sell positions below the pivot with targets at 44,325.50 & 44,210.00.
Alternative Price Action: Above 44,450.80 looks for further upside to 44,580.30 & 44,692.90.
Comment: RSI is below 50 levels and pairs below its 55MA.
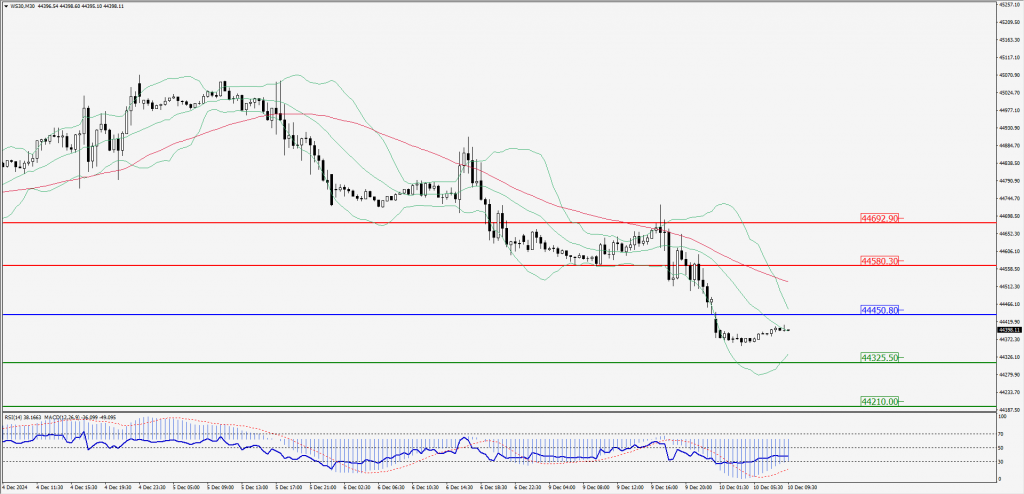
Green Lines Indicate Resistance Levels – Red Lines Indicate Support Levels
Light Blue is a Pivot Point – Black represents the price when the report was produced