Market Wrap: Stocks, Bonds, Commodities
Most Asian currencies were subdued on Friday, with South Korean won leading losses ahead of key U.S. jobs data, while the Indian rupee was slightly higher after the country’s central bank held rates steady but cut bank reserve requirements.
The Dow Jones Industrial Average fail 248.33 points to 44,765.71, the S&P 500 loss 0.19% to 6,075.11 and the Nasdaq Composite down 34.86 points to 19,700.26.
MSCI’s index of Asia-Pacific stocks outside Japan is up 0.38% to 721.49 levels. The Australian index was lower by 0.64% to 8,420.90. Japanese Nikkei Index decrease 0.80% today.
European stocks were positive on Friday, with the Stoxx Europe 50 Index increase 0.63% to 4,950.25 Germany’s DAX ascend 0.63% to 20,358.80, and France’s CAC higher 0.37% to 7,330.54 and U.K.’s FTSE 100 gain 0.16% to 8,349.38.
Benchmark 10-year U.S. Treasury fail as demand for safe assets slipped again, today 10-year bond yields 0.17% to 4.1730.
Oil prices edged lower on Friday, with weak demand in focus after the OPEC+ group postponed planned supply increases and extended deep output cuts to the end of 2026.
Spot Brent crude oil decrease 0.26% to $71.90 per barrel. US West Texas Intermediate crude is decrease 0.19% to $68.17 a barrel.
The yellow metal gold is up 0.43% to 2,659.79 dollars per ounce.
Market Wrap: Forex
U.S. President-elect Donald Trump on Thursday said he was appointing former PayPal (NASDAQ:PYPL) Chief Operating Officer David Sacks as his “White House A.I. & Crypto Czar,” another step towards overhauling U.S. policy.
Today, the U.S. dollar index measures the Greenback against a trade-weighted basket of six major currencies, which either ascend 0.12% to 105.832.
The Euro US Dollar (EUR/USD) is a widely traded is down 0.14% today. This left the pair trading around $1.05710.
The Japanese yen was will move negative against the U.S. dollar on Friday. Today USD/JPY is trades pair that decrease 0.05% to the 150.00 level.
Another commodity-related currency negative against the U.S dollar, AUD/USD loss 0.42% to 0.64230, and NZD/USD decrease 0.48% to 0.58560 level.
EUR/USD Intraday: Trend on the upside
Our pivot point is at 1.05740
Preferable Price Action: Take buy positions above pivot level with targets at 1.05910 & 1.06060 in extension.
Alternative Price Action: Sell pivot looks for a further downside to 1.05570 & 1.05420.
Comment: RSI is above 50 levels and pairs above its 55MA.
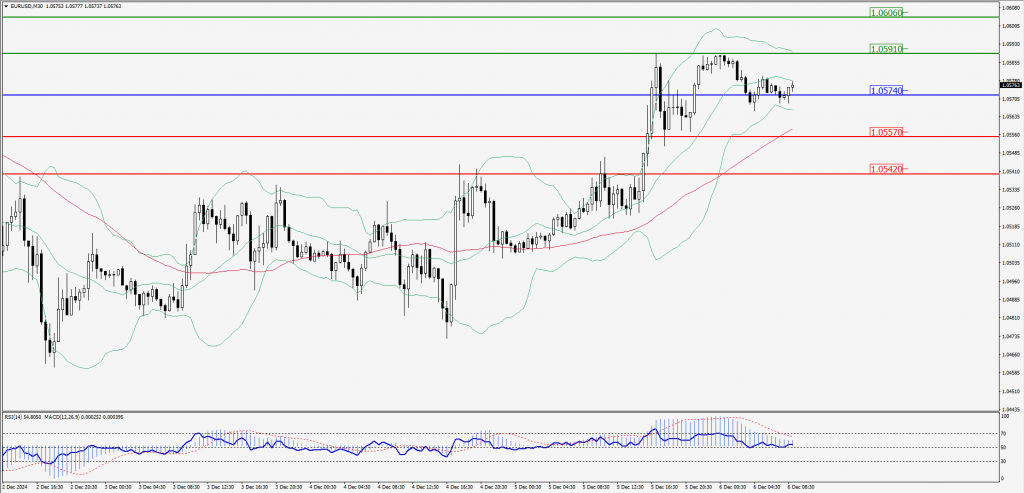
Green Lines Indicate Resistance Levels – Red Lines Indicate Support Levels
Light Blue is a Pivot Point – Black represents the price when the report was produced
GBP/USD Intraday: Trend on the downside
Our pivot point is at 1.27530
Preferable Price Action: Sell positions below pivot with targets at 1.27320 & 1.27130 in extension.
Alternative Price Action: The price above pivot would call for further upside to 1.27730 & 1.27920.
Comment: RSI is below 50 levels and pairs below its 20MA.
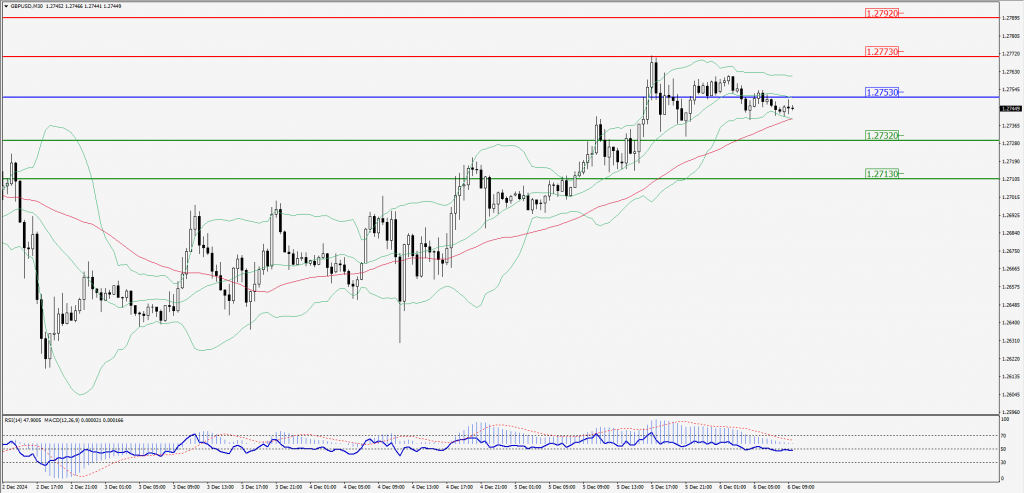
Green Lines Indicate Resistance Levels – Red Lines Indicate Support Levels
Light Blue is a Pivot Point – Black represents the price when the report was produced
USD/JPY Intraday: Trend on the downside
Our pivot point is at 149.930
Preferable Price Action: Sell position below pivot with the target at 149.610 and 149.300 in extension.
Alternative Price Action: The upside breakout of the pivot would call for 150.250 and 150.550.
Comment: MACD is below 50 levels and pairs below its 55MA & 20MA.
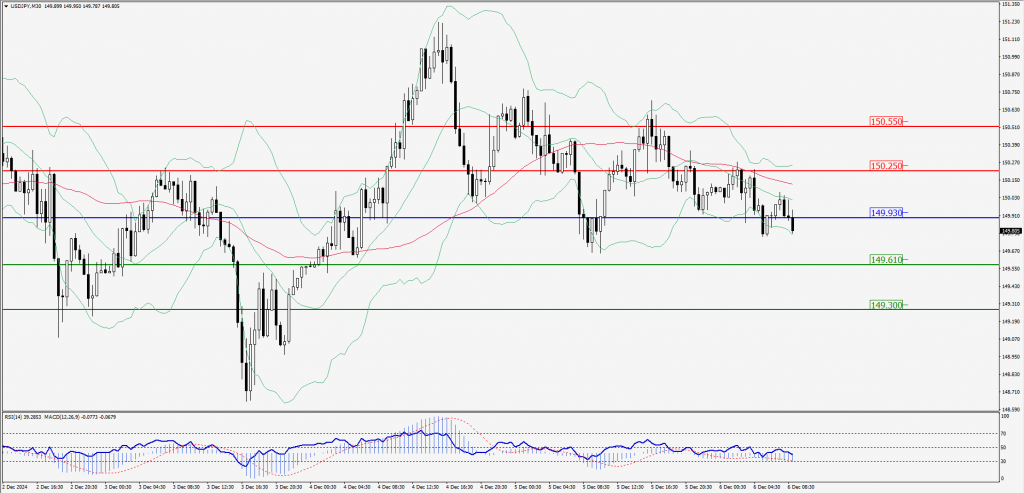
Green Lines Indicate Resistance Levels – Red Lines Indicate Support Levels
Light Blue is a Pivot Point – Black represents the price when the report was produced
AUD/USD Intraday: Trend on the downside
Our pivot point is at 0.64340
Preferable Price Action: Sell positions below pivot with targets at 0.64180 & 0.64030 in extension.
Alternative Price Action: Above pivot a further upside with 0.64500 & 0.64650 as targets.
Comment: RSI is below 50 levels and pairs below its 55MA & 20MA.
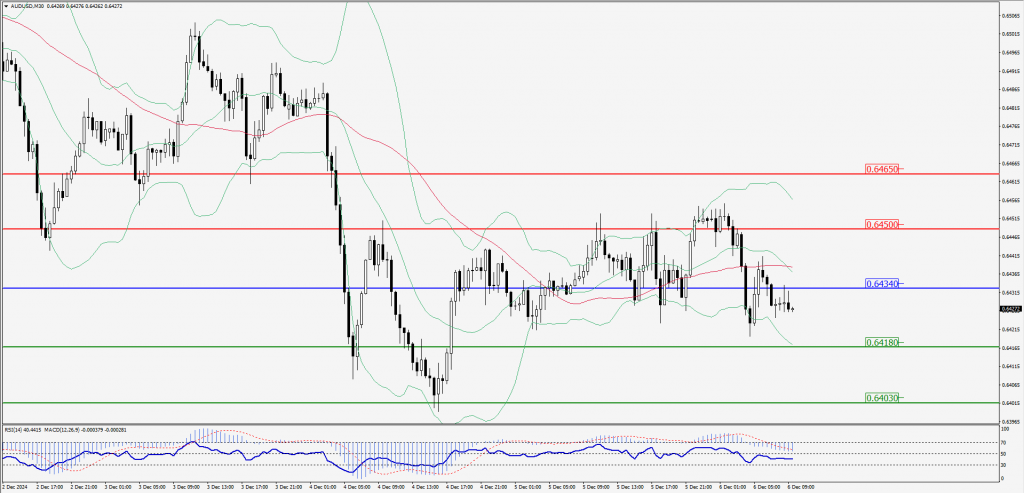
Green Lines Indicate Resistance Levels – Red Lines Indicate Support Levels
Light Blue is a Pivot Point – Black represents the price when the report was produced
CRUDEOIL Intraday: Trend on the downside
Our pivot point is at 68.21
Preferable Price Action: Below pivot sell oil with 67.83 & 67.53 as targets.
Alternative Price Action: Buy crude above pivot with targets at 68.58 & 68.89 in extension.
Comment: RSI is at below 50 levels and pairs below its 55MA.
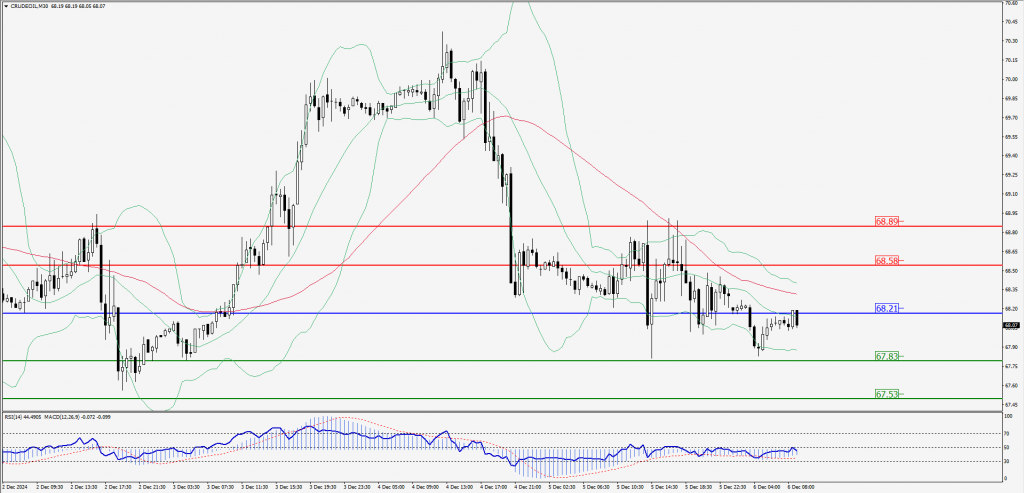
Green Lines Indicate Resistance Levels – Red Lines Indicate Support Levels
Light Blue is a Pivot Point – Black represents the price when the report was produced
XAU/USD Intraday: Trend on the upside
Our pivot point is at 2636.00
Preferable Price Action: Further upside to 2641.40 and 2646.70.
Alternative Price Action: If the price gives an downside breakout of a pivot, then the price extends to 2630.60 and 2625.30.
Comment: MACD is above 50 levels and pairs above its 20MA.
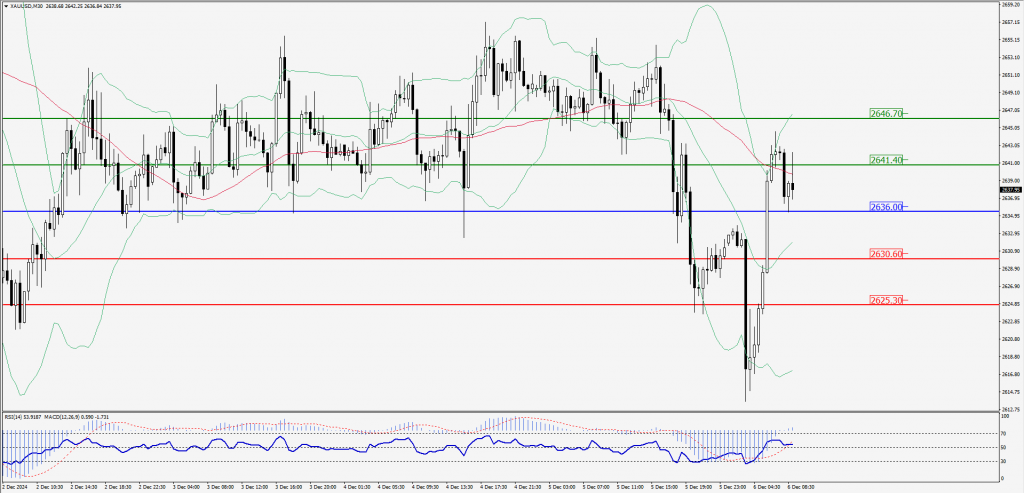
Green Lines Indicate Resistance Levels – Red Lines Indicate Support Levels
Light Blue is a Pivot Point – Black represents the price when the report was produced
Dow Jones Intraday: Trend on the downside
Our pivot point is 44,782.90
Preferable Price Action: Take sell positions below the pivot with targets at 44,715.60 & 44,654.50.
Alternative Price Action: Above 44,782.90 looks for further upside to 44,850.30 & 44,910.70.
Comment: RSI is below 50 levels and pairs below its 55MA.
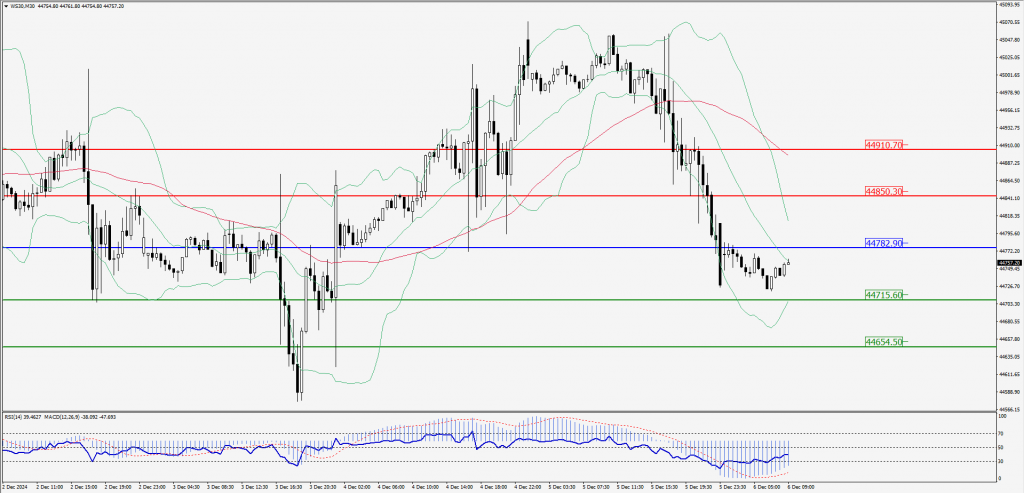
Green Lines Indicate Resistance Levels – Red Lines Indicate Support Levels
Light Blue is a Pivot Point – Black represents the price when the report was produced