Market Wrap: Stocks, Bonds, Commodities
Asian currencies drifted lower on Wednesday with the South Korean won at a two-year low after President Yoon Suk-Yeol’s failed attempt to impose martial law, while the Australian dollar fell to a four-month low on weak gross domestic product data.
The Dow Jones Industrial Average fail 76.47 points to 44,705.53, the S&P 500 gain 0.05% to 6,049.88 and the Nasdaq Composite up 76.96 points to 19,480.91.
MSCI’s index of Asia-Pacific stocks outside Japan is up 1.34% to 718.98 levels. The Australian index was lower by 0.38% to 8,462.60. Japanese Nikkei Index increase 0.06% today.
European stocks were positive on Wednesday, with the Stoxx Europe 50 Index increase 0.64% to 4,877.75 Germany’s DAX ascend 0.42% to 20,016.75, and France’s CAC higher 0.26% to 7,255.42 and U.K.’s FTSE 100 gain 0.56% to 8,359.41.
Benchmark 10-year U.S. Treasury rose as demand for safe assets slipped again, today 10-year bond yields 0.40% to 4.2400.
Oil prices firmed on Wednesday as market participants weighed up geopolitical tensions and the prospect of OPEC+ extending supply cuts against weaker demand.
Spot Brent crude oil increase 0.25% to $73.87 per barrel. US West Texas Intermediate crude is increase 0.24% to $70.18 a barrel.
The yellow metal gold is up 0.08% to 2,670.10 dollars per ounce.
Market Wrap: Forex
The Australian dollar weakened sharply on Wednesday after softer-than-expected gross domestic product data spurred increased bets that the Reserve Bank will cut interest rates earlier in 2025.
Today, the U.S. dollar index measures the Greenback against a trade-weighted basket of six major currencies, which either descend 0.07% to 106.264.
The Euro US Dollar (EUR/USD) is a widely traded is up 0.12% today. This left the pair trading around $1.05220.
The Japanese yen was will move positive against the U.S. dollar on Wednesday. Today USD/JPY is trades pair that increase 0.33% to the 150.09 level.
Another commodity-related currency negative against the U.S dollar, AUD/USD loss 0.62% to 0.64430, and NZD/USD decrease 0.39% to 0.58580 level.
EUR/USD Intraday: Trend on the upside
Our pivot point is at 1.05130
Preferable Price Action: Take buy positions above pivot level with targets at 1.05300 & 1.05440 in extension.
Alternative Price Action: Sell pivot looks for a further downside to 1.04960 & 1.04820.
Comment: RSI is above 50 levels and pairs above its 20MA & 55MA.
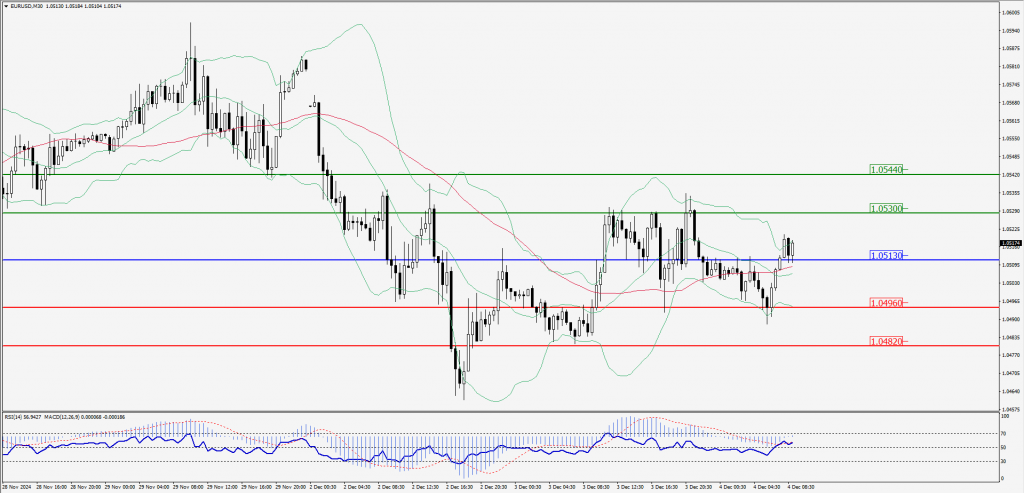
Green Lines Indicate Resistance Levels – Red Lines Indicate Support Levels
Light Blue is a Pivot Point – Black represents the price when the report was produced
GBP/USD Intraday: Trend on the upside
Our pivot point is at 1.26890
Preferable Price Action: Buy positions above pivot with targets at 1.27060 & 1.27220 in extension.
Alternative Price Action: The price below pivot would call for further downside to 1.26720 & 1.26560.
Comment: RSI is above 50 levels and pairs above its 55MA & 20MA.
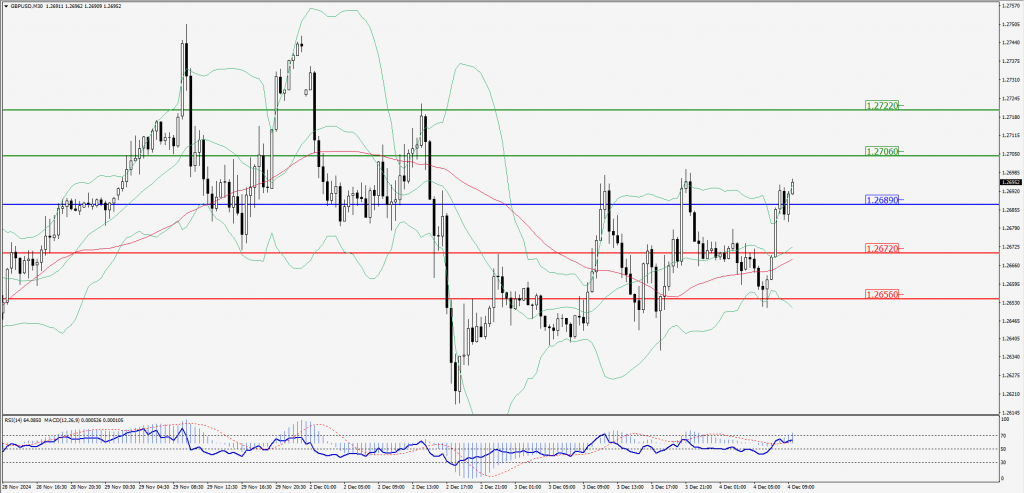
Green Lines Indicate Resistance Levels – Red Lines Indicate Support Levels
Light Blue is a Pivot Point – Black represents the price when the report was produced
USD/JPY Intraday: Trend on the upside
Our pivot point is at 149.880
Preferable Price Action: Buy position above pivot with the target at 150.340 and 150.680 in extension.
Alternative Price Action: The downside breakout of the pivot would call for 149.420 and 149.070.
Comment: MACD is above 50 levels and pairs above its 55MA & 20MA.
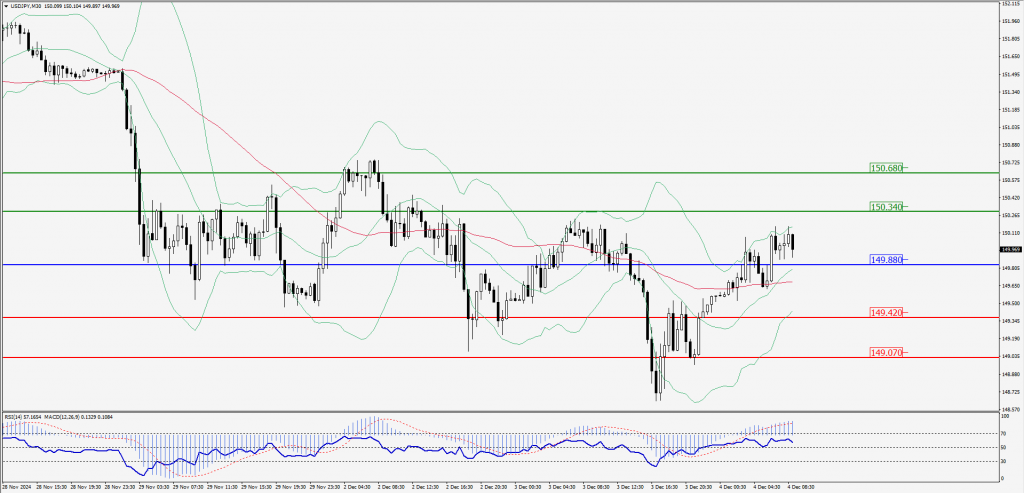
Green Lines Indicate Resistance Levels – Red Lines Indicate Support Levels
Light Blue is a Pivot Point – Black represents the price when the report was produced
AUD/USD Intraday: Trend on the downside
Our pivot point is at 0.64480
Preferable Price Action: Sell positions below pivot with targets at 0.64330 & 0.64200 in extension.
Alternative Price Action: Above pivot a further upside with 0.64630 & 0.64760 as targets.
Comment: RSI is below 50 levels and pairs below its 55MA & 20MA.
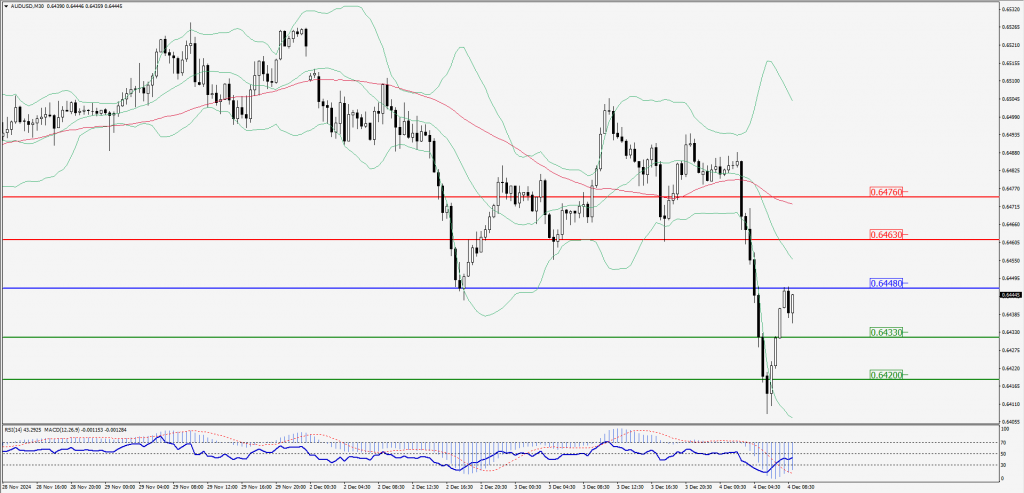
Green Lines Indicate Resistance Levels – Red Lines Indicate Support Levels
Light Blue is a Pivot Point – Black represents the price when the report was produced
CRUDEOIL Intraday: Trend on the upside
Our pivot point is at 69.83
Preferable Price Action: Above pivot buy oil with 70.15 & 70.44 as targets.
Alternative Price Action: Sell crude below pivot with targets at 69.52 & 69.21 in extension.
Comment: RSI is at above 50 levels and pairs above its 20MA & 55MA.
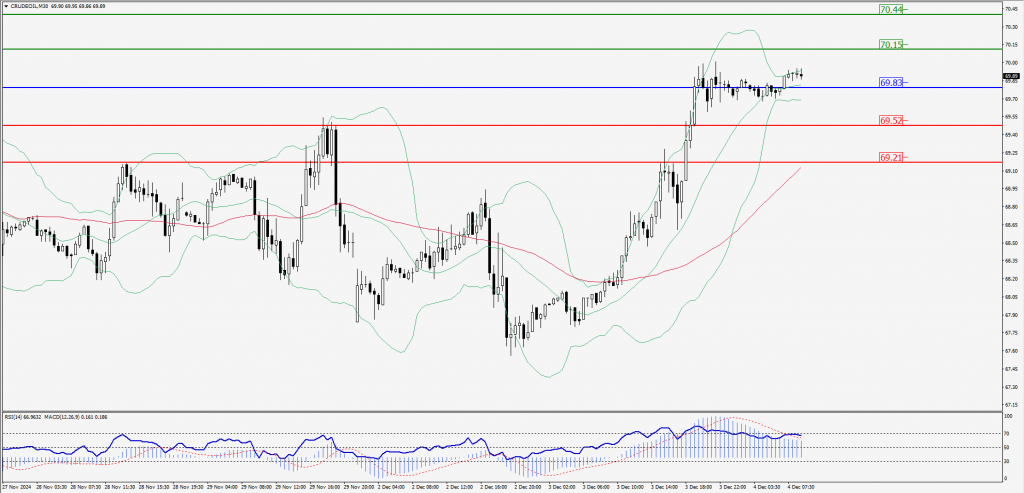
Green Lines Indicate Resistance Levels – Red Lines Indicate Support Levels
Light Blue is a Pivot Point – Black represents the price when the report was produced
XAU/USD Intraday: Trend on the upside
Our pivot point is at 2648.40
Preferable Price Action: Further upside to 2659.30 and 2654.40.
Alternative Price Action: If the price gives an downside breakout of a pivot, then the price extends to 2642.90 and 2638.20.
Comment: MACD is above 50 levels and pairs above its 55MA & 20MA.
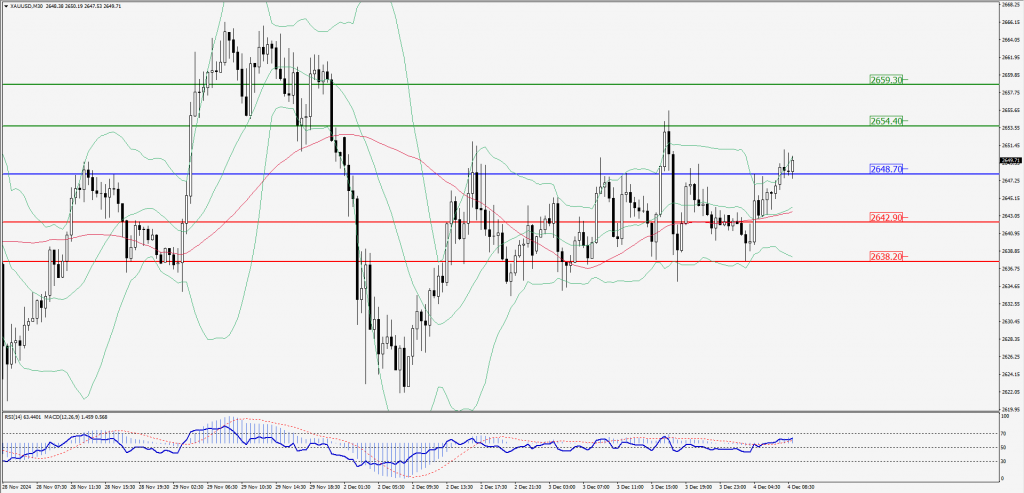
Green Lines Indicate Resistance Levels – Red Lines Indicate Support Levels
Light Blue is a Pivot Point – Black represents the price when the report was produced
Dow Jones Intraday: Trend on the upside
Our pivot point is 44,807.10
Preferable Price Action: Take buy positions above the pivot with targets at 44,872.40 & 44,932.80.
Alternative Price Action: Below 44,807.10 looks for further downside to 44,741.90 & 44,687.70.
Comment: RSI is above 50 levels and pairs above its 20MA & 55MA.
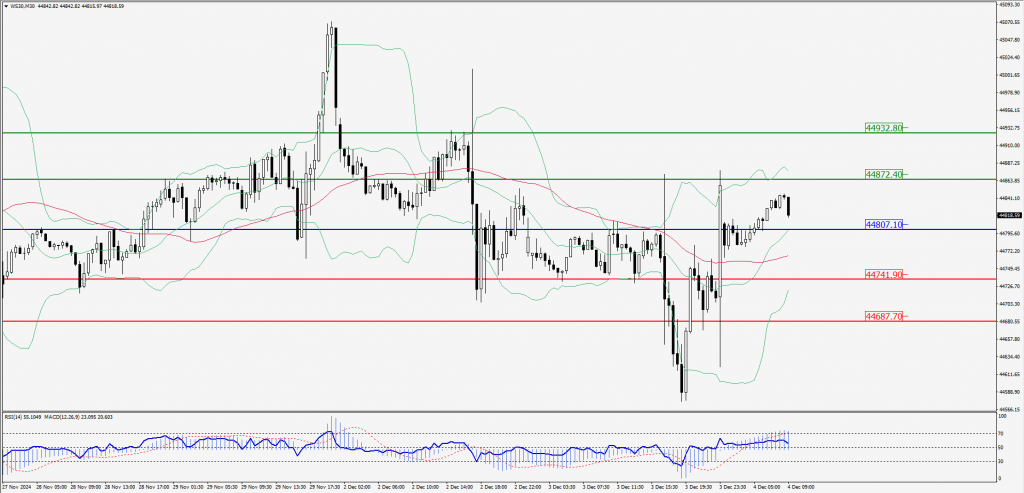
Green Lines Indicate Resistance Levels – Red Lines Indicate Support Levels
Light Blue is a Pivot Point – Black represents the price when the report was produced